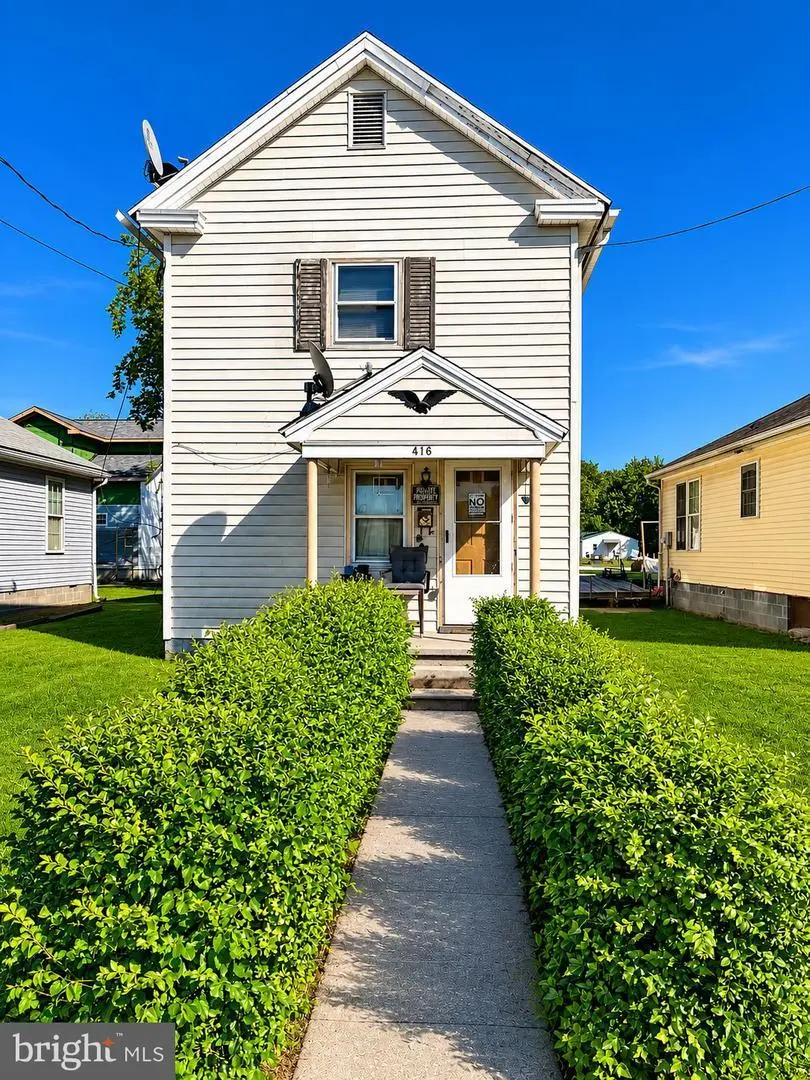
416 Camper St · Cambridge, MD
Flood risk 1/10 · Minimal
- FEMA flood zone
- X (unshaded)
- Chance of flooding over 30 yrs
- 0.0%
- Est. flood insurance / yr
- $507 – $1,088
Fire risk 3/10 · Minor
- Est. fire insurance / yr
- $755 – $1,403
Heat risk 9/10 · Severe
- Hot days now (above 105°F)
- 7 days/yr
- Hot days in 30 yrs
- 16 days/yr
Wind risk 6/10 · Moderate
- Chance of severe wind over 30 yrs
- 75.0%
Air-quality risk 3/10 · Minor
- Unhealthy air days now
- 2 days/yr
- Unhealthy air days in 30 yrs
- 3 days/yr
Risk factors via First Street. Map © Google.
Why this score? — see what drove the B- grade
The composite is a weighted blend of 9 inputs, each scored 0–100. Each bar is that input's sub-score; the figure is the points it added to the 100-point composite (weight × sub-score).
- Cash flow +30.0/30.0
- 1% rule +10.0/10.0
- DSCR +10.0/10.0
- ARV discount +7.5/15.0
- Livability +3.2/5.0
- Rent growth +2.5/5.0
- Condition / age +2.5/5.0
- Schools +1.5/10.0
- Appreciation +0.0/10.0
$69,900
🖨 Deal sheet 📄 Offer letter ✓ Due diligence
Listing remarks MLS
Affordable home in Cambridge. Occupied, shown by appt only.
Key facts
- Up-and-coming area
- 3,076 sq ft lot
- Built 1952
Tags
Property features AI
Finance
- Other: Land assessed value noted; Improvement assessed value noted
- Financial info: Ownership: Fee simple
Exterior
- Parking: Driveway; On-street parking
- Utilities: Public water; Public sewer; Hot water: electric and natural gas; Heating fuel: electric and natural gas
- Home design: Detached property; 840 finished square feet above grade
- Construction: Shingle siding; Slab foundation; Above-grade and below-grade structures noted; Year built (per assessor)
- Exterior features: Located inside city limits (Cambridge); Tidal water not present
Interior
- Bedrooms: Two bedrooms on the upper level
- Bathrooms: One full bathroom on the main level; One full bathroom total
- Heating & cooling: Baseboard electric heating; Heat pump with natural gas backup
- Interior features: No basement
Neighborhood map
What this means for you Summary
Snapshot
- This is a 2-bed/1.0-bath single-family listed at $70k.
Deal economics
- At list price, monthly cash flow is $524 ($6k/yr) — positive.
- The deal already cash-flows at list — no discount required.
- Meets the 1% rule at list price ($1k rent vs $70k).
- Recommended offer: $68k (3.0% below list) — sets the bar for market timing.
- Cap rate 15.3% vs local median 4.2% in Cambridge — top-decile yield for the area; either an underpriced asset or a hidden risk that comps aren't pricing in. Stress-test before assuming the spread holds.
Location & tenants
- Location reads 65/100 on livability (#255 in MD) — a middle-class / working-renter tenant base. Strengths: cost of living A+, health & safety A+, housing B+; Watch: amenities D, schools F, crime F.
- Dorchester County Public Schools (rural): math 10% / reading 23% proficiency, ranked #23 of 24 in MD (top 96%) — low school quality limits family demand, transient renter base, plan for 1-2y turnover.
- Market conditions: 292 active listings in the ZIP; 1 comparable units currently listed for rent nearby; 81 units permitted in Dorchester County in 2024 (0 in 5+ unit buildings).
Forward outlook
- Local home prices are declining (-3.0%/yr); year-one equity from $483 of loan paydown is wiped out by about $2k of value loss. Plan a longer hold.
- Dorchester County population projected to shrink 10% by 2050 — rents likely to lag national; underwrite the cash flow, not the appreciation.
- At projected returns (-3.0% appreciation + 3.0% rent growth), your $20k cash investment doubles in ~4 years — after that, you're playing with house money.
Negotiation context
- It's been on market 37 days — a 3% lower offer ($68k) is reasonable based on typical stale-listing flexibility.
- 2 sale attempts since 20y ago with the ask held roughly flat each time — persistent listings suggest the price (not the market) is what's stuck; bring a comps-based counter.
Risks & watch-outs
- Watch-outs: built in 1952 — expect roof / HVAC / electrical / plumbing capex.
- Climate carrying-cost: major wind risk, 75% chance of damaging wind over 30y; extreme-heat days projected 7→16/yr by 2055 (HVAC capex compounding) — expect insurance premiums to compound above CPI over the hold.
Questions for the listing agent
- It's been on market 37 days. Have you received any prior offers? Is the seller open to a 3% concession, seller financing, or rate buy-down credit?
- Built in 1952 — when were the roof, HVAC, electrical panel, plumbing, and water heater last replaced?
- Is there a deadline driving the sale (1031 exchange, divorce, estate, relocation)? That informs how much negotiation room exists.
- Schools are F-rated, which usually means shorter tenancies and higher turnover. Who's the typical renter profile here, and what's been the actual vacancy rate?
- Crime grade is F in this area — have there been break-ins, vandalism, or insurance claims at this property in the last 3 years? What carrier currently insures it and at what premium?
- What's the average days-on-market for RENTAL listings here right now (not sales)? A rising rental-DOM trend means longer vacancies and softer asking-rent achievability than the comps imply.
- What's the recent tenant-quality profile in this submarket — average credit score on applications, eviction rate, late-payment / NSF rate, and stable-employment percentage? A property-management company in the area should have these aggregated.
- How much new for-sale + rental construction is in the pipeline within 1–3 miles? Heavy new supply typically softens prices + rents 12–24 months out; constrained supply supports both.
Investment metrics
- 1% rule
- 1.71% ✓
- Cap rate
- 15.29%
- Cash-on-cash
- 32.14%
- DSCR
- 2.43
- GRM
- 4.9
CMA / ARV
- ARV (median comp)
- $142,526
- List price
- $69,900
- Delta
- -50.96%
- Verdict
- UNDERPRICED
- Comps
- 20 within 1.0 mi
Show comp detail 12 sales within ~0.75 mi
| Address | Dist | Beds/Ba | Sqft | Sold | Price | $/sf | Match |
|---|---|---|---|---|---|---|---|
| 623 Cross St | 0.24mi | 2/1.0 | 864 (+3%) | 7mo | $66,780 | $77 | 78 |
| 513 High St | 0.20mi | 2/1.0 | 864 (+3%) | 16mo | $30,000 | $35 | 73 |
| 1105 Holland Ave | 0.32mi | 2/1.0 | 752 (-10%) | 1mo | $190,000 | $253 | 67 |
| 411 Linden Ave | 0.15mi | 3/2.5 (+1) | 816 (-3%) | 14mo | $220,000 | $270 | 66 |
| 418 Leonards Ln | 0.25mi | 2/1.0 | 810 (-4%) | 20mo | $185,000 | $228 | 66 |
| 633 High St | 0.31mi | 2/1.0 | 833 (-1%) | 22mo | $41,000 | $49 | 65 |
| 710 Stiles Cir | 0.40mi | 3/1.0 (+1) | 864 (+3%) | 12mo | $147,000 | $170 | 62 |
| 622 Washington St | 0.48mi | 3/1.0 (+1) | 768 (-9%) | 3mo | $114,000 | $148 | 56 |
| 624 High St | 0.33mi | 2/1.0 | 910 (+8%) | 20mo | $123,500 | $136 | 54 |
| 513 Cedar St | 0.40mi | 3/1.0 (+1) | 928 (+10%) | 8mo | $25,000 | $27 | 52 |
| 619 Washington St | 0.46mi | 2/1.0 | 780 (-7%) | 24mo | $50,000 | $64 | 47 |
| 221 Hayward St | 0.64mi | 3/1.5 (+1) | 948 (+13%) | 20mo | $105,000 | $111 | 25 |
Match score weights: distance 35% · size 25% · config 20% · recency 20%. Top-matched comps best support the ARV.
Projected returns pro-forma
-3.0% appreciation · 3.0% rent growth · sell at horizon
- IRR
- 27.1%
- Equity multiple
- 2.13×
- Total profit
- $22,041
- Equity at exit
- $10,422
- IRR
- 34.7%
- Equity multiple
- 4.17×
- Total profit
- $62,101
- Equity at exit
- $6,044
Cash invested: $19,572 (down + closing). Projections, not guarantees.
Landlord ↔ Tenant lean methodology
- Overall (STATE)
- 27 Tenant-Leaning
- State Maryland
- 27 Tenant-Leaning · D+14
- County
- — inherits STATE
- City
- — inherits STATE
ZIP-level market 21613
- Home prices YoY
- -25.1%
- Active inventory
- 292
- Price-to-rent
- 4.9×
Monthly cashflow live
- Estimated rent
- $1,195 medium interval (Pro) →
- Mortgage (P&I)
- −$367
- Tax from tax record
- −$24 /mo · $290/yr
- Insurance
- −$29
- HOA
- −$0
- Vacancy / Maint / Mgmt
- −$251
- Net cashflow
- $524
Break-even live
UW: 25.0% down · 7.5% · 30yr · 1.5% tax · 5.0% vac · 8.0% maint · 8.0% mgmt
Financing live
Cash to close
- Down payment
- $17,475
- Closing costs
- $2,097
- Reserves months
- —
- Total cash needed
- —
Loan-product check · same deal, 3 products live
Conventional
25% down · 7.5% · 30yr
- Down + closing
- —
- Monthly P&I
- —
- Monthly cashflow
- —
- DSCR
- —
- Eligible?
- —
Personal DTI + credit; lowest rate.
DSCR
20% down · 8.5% · 30yr
- Down + closing
- —
- Monthly P&I
- —
- Monthly cashflow
- —
- DSCR
- —
- Eligible?
- —
No personal income docs; deal must DSCR.
Hard money
10% down · 12.0% · 12mo
- Down + closing
- —
- Monthly P&I
- —
- Monthly cashflow
- —
- DSCR
- —
- Eligible?
- —
Short-term bridge; refi at stabilization.
Rent comps 1 comps
| Address | Beds | Baths | Sqft | Rent | $/sqft | DOM | Units | Dist |
|---|---|---|---|---|---|---|---|---|
| 800 Travers St #5 Cambridge, MD | 2.0 | 1.0 | 1000 | $1,195 | $1.20 | 43d | 1 | 0.37mi |
Listing history 22 events
-
2026-06-18days on market $69,900 Active 37 DOM
-
2026-06-17days on market $69,900 Active 36 DOM
-
2026-06-16days on market $69,900 Active 35 DOM
-
2026-06-15days on market $69,900 Active 34 DOM
-
2026-06-13days on market $69,900 Active 32 DOM
-
2026-06-12days on market $69,900 Active 31 DOM
-
2026-06-09days on market $69,900 Active 28 DOM
-
2026-06-08days on market $69,900 Active 27 DOM
-
2026-06-07days on market $69,900 Active 26 DOM
-
2026-06-07days on market $69,900 Active 25 DOM
-
2026-06-04days on market $69,900 Active 22 DOM
-
2026-06-02days on market $69,900 Active 21 DOM
-
2026-06-01days on market $69,900 Active 20 DOM
-
2026-05-31days on market $69,900 Active 19 DOM
-
2026-05-31days on market $69,900 Active 18 DOM
-
2026-05-12$69,900 Active 572-char remark
-
2006-09-18soldstatus $66,489
-
2006-09-18soldstatus $66,489
-
2006-08-30soldstatus $66,489 59-char remark
Show marketing remark (59 chars)
Affordable home in Cambridge. Occupied, shown by appt only.
-
2006-07-19historical 59-char remark
Show marketing remark (59 chars)
Affordable home in Cambridge. Occupied, shown by appt only.
-
2006-02-08$62,500 59-char remark
Show marketing remark (59 chars)
Affordable home in Cambridge. Occupied, shown by appt only.
-
1998-12-29soldstatus $47,500
ⓘ Source: listings_history table (triggers on properties + properties_extension) + one-shot
backfill from property_details.listing_events for pre-trigger history.
Tax reassessment forecast MD · Partial reset (capped growth)
- Current annual tax
- $290 · $24/mo
- Projected year-2 tax
- $526 · $44/mo
- Expected delta
- +$236/yr (+$20/mo · 81.5%)
ⓘ Screening estimate from a state-policy table — verify with the county assessor before closing.
Climate risk First Street
- Flood 1/10 Low FEMA zone X (unshaded) · 0% chance over 30 yrs
- Wildfire 3/10 Moderate
- Heat 9/10 Extreme 7 d/yr ≥105°F today · 16 d/yr by 30 yrs out
- Wind 6/10 Major 75% chance of damaging wind over 30 yrs
- Air quality 3/10 Moderate 2 unhealthy d/yr today · 3 by 30 yrs out
Nearby sold comps map
Loading sold comps map…
Walkable amenities ~0.75 mi
Loading nearby amenities…
Taxation est. · year 1
- Rental income
- $14,340
- − Mortgage interest
- −$3,915
- − Property taxes
- −$290
- − Insurance
- −$350
- − Repairs & maintenance
- −$1,147
- − Management
- −$1,147
- − Depreciation
- −$2,033
- Taxable income
- $5,458
- Est. tax owed @ 24.0%
- −$1,310
- After-tax cash flow
- $4,981/yr
For passive investors: Depreciation is non-cash, so a rental often shows a tax loss while cash-flowing — sheltering income. Rental losses are passive: they offset passive income freely, and up to $25,000/yr can offset ordinary (W-2) income if you actively participate and your MAGI is under $100k (phasing out to $0 by $150k); unused losses carry forward. On sale, claimed depreciation is recaptured at up to 25%, and gains may owe capital-gains tax (a 1031 exchange can defer both). Figures are a year-1 estimate at your 24.0% rate — not tax advice; consult a CPA.
Schools (NCES district)
- District
- Dorchester County Public Schools
- NCES district ID
- 2400300
- Math proficiency
- 10% ▼ -14.00%
- Reading proficiency
- 23% ▼ -12.00%
- Median HH income
- $46,767
- Composite
- 14.65/100
- National rank
- #9404
- State rank
- #23 of 24 in MD
Livability — Cambridge
- Score
- 65/100
- State rank
- #255
- US rank
- #13046
Category grades
Schools grade is shown separately in the Schools card above.
Census & demographics
- Census place
- Cambridge, MD
- Population (ZIP)
- 18,167
Population outlook (Dorchester County) Hauer SSP2
- Today (2025)
- 31,699 people
- By 2030
- 31,054 · -2.0%
- By 2040
- 29,712 · -6.3%
- By 2050
- 28,618 · -9.7%
- By 2075
- 28,436 · -10.3%
- By 2100
- 28,937 · -8.7%
Race, ethnicity, and origin ACS 2023
- Neighborhood character
- Diverse neighborhood (Simpson 0.62)
- Race & ethnicity
- White 52% Black 33% Two or more races 10% Hispanic / Latino 6% Asian 2%
- Hispanic origin (detail)
- Puerto Rican 3%
- Common ancestry
- Romanian 1% Lithuanian 1% Italian 1%
- Foreign-born
- 4% · Canada
- Languages at home
- 95% English-only · Spanish 3% Other Indo-European 1% German/W. Germanic 1%
Political lean MEDSL · Dorchester
- 2024 margin
- R (+14.6) · D 41.6% · R 56.1% · Other 2.3%
- 2008→2024 swing
- -6.3pp toward R · 2008: -8.2pp · 2024: -14.6pp
- All cycles
- 2024: R+14.6 2020: R+11.9 2016: R+16.0 2012: R+6.6 2008: R+8.2
Not yet ingested
- Civics
- —
Market trends
- HPI YoY
- ▼ -91.03%
- Current HPI
- 271.1127
- Rent YoY
- —
- Metro
- —
- State GDP YoY
- ▲ 2.97%
- F500 in state
- 12
Industry mix (Fortune 500 HQ in MD)
| Industry | F500 HQs | Revenue |
|---|---|---|
| Aerospace / Defense | 1 | $71B |
|
||
| Utilities | 1 | $25B |
|
||
| Hotels | 1 | $24B |
|
||
| Consumer Goods | 1 | $7B |
|
||
| Real Estate | 1 | $6B |
|
||
| Chemicals | 1 | $2B |
|
||
Price history
+47.2% since first listed7 events — show timeline
- 2026-05-12 Listed $69,900 BRIGHT MLS
- 2006-09-18 Sold (Public Records) $66,489 Public Records
- 2006-09-18 Sold (Public Records) $66,489 Public Records
- 2006-08-30 Sold (MLS) $66,489 MRIS
- 2006-07-19 Delisted — MRIS
- 2006-02-08 Listed $62,500 MRIS
- 1998-12-29 Sold (Public Records) $47,500 Public Records
Property tax history
-2.3%/yrLatest (2025): $290 · -45.7% YoY. Source: county tax records.
Cash-flow waterfall
monthlySold comps — $/sqft
last 12 mo · ≤1 miLoading sold comps…