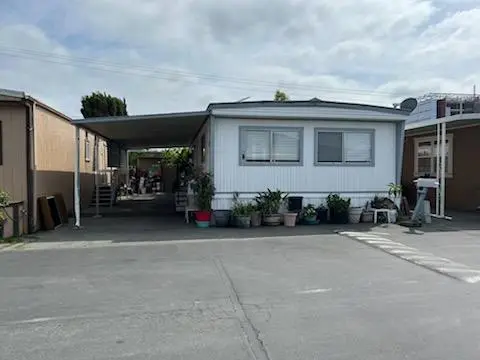
2053 East Bayshore #7 · Redwood City, CA
Flood risk 6/10 · Moderate
- FEMA flood zone
- AE
- Chance of flooding over 30 yrs
- 0.89%
- Est. flood insurance / yr
- $1,737 – $8,500
Fire risk 3/10 · Minor
- Est. fire insurance / yr
- $659 – $1,223
Heat risk 3/10 · Minor
- Hot days now (above 91°F)
- 7 days/yr
- Hot days in 30 yrs
- 14 days/yr
Wind risk 1/10 · Minimal
- Chance of severe wind over 30 yrs
- —
Air-quality risk 8/10 · Major
- Unhealthy air days now
- 16 days/yr
- Unhealthy air days in 30 yrs
- 16 days/yr
Risk factors via First Street. Map © Google.
Why this score? — see what drove the B grade
The composite is a weighted blend of 9 inputs, each scored 0–100. Each bar is that input's sub-score; the figure is the points it added to the 100-point composite (weight × sub-score).
- Cash flow +30.0/30.0
- 1% rule +10.0/10.0
- DSCR +10.0/10.0
- ARV discount +8.0/15.0
- Schools +5.8/10.0
- Rent growth +3.7/5.0
- Livability +2.5/5.0
- Condition / age +2.5/5.0
- Appreciation +0.0/10.0
$239,000
🖨 Deal sheet 📄 Offer letter ✓ Due diligence
Listing remarks MLS
Welcome to this lovely and well-maintained 2-bedroom, 1-bathroom home in Redwood City community of Redwood States. The home features a spacious living room, kitchen with granite counter, plenty of natural lighting, laminated flooring throughout the house, double pane windows, and a nice private outdoor BBQ area. The home offers an indoor laundry area and a covered carport for 3 cars. Perfect for first-time buyers or downsizers. Just minutes from highway 101, 84, major tech companies such as Facebook and Google, Stanford University, top hospitals. Own this great home instead of renting! You will love this charming home!
Key facts
- Indoor laundry area
- Granite counter
- Covered carport
Tags
Property features AI
Finance
- Other: No age restrictions; Board approval required; Pet restrictions (number limits)
- HOA & community: Club house; Sauna / spa / hot tub
Exterior
- Parking: Carport with 2 spaces (space #7); Space rent $1,150
- Utilities: Public water; Public sewer
- Home design: Single-story; Leased land (park home site)
- Construction: Living area approximately 860
- Exterior features: Other roof (see remarks); Public utilities
Interior
- Kitchen: Gas cooktop; Granite countertops; Oven/range
- Bedrooms: 2 bedrooms
- Flooring: Laminate
- Bathrooms: 1 full bathroom with shower and tub
- Heating & cooling: Central forced air heating; Evaporative cooler
- Interior features: Storage; Laminate flooring; Hookups only for laundry
- Laundry & utility: Washer/dryer hookups only
Neighborhood map
What this means for you Summary
Snapshot
- This is a 2-bed/1.0-bath manufactured listed at $239k.
Deal economics
- At list price, monthly cash flow is $1k ($13k/yr) — positive.
- The deal already cash-flows at list — no discount required.
- Meets the 1% rule at list price ($4k rent vs $239k).
- Recommended offer: $232k (3.0% below list) — sets the bar for market timing.
- Cap rate 14.0% vs local median 1.3% in Redwood City — top-decile yield for the area; either an underpriced asset or a hidden risk that comps aren't pricing in. Stress-test before assuming the spread holds.
Location & tenants
- Location reads: area grade B — affects rentability + tenant quality, not the cash-flow math above.
- Sequoia Union High (suburban): math 52% / reading 69% proficiency, ranked #159 of 1,400 in CA (top 11%) — acceptable for families but not a draw, mixed tenant base, ~2y average lease.
- Market conditions: Rents rising fast (+4.9%/yr); 29 active listings in the ZIP; 14 comparable units currently listed for rent nearby; rentals leasing fast (median 2d on market — plan ~1-2 weeks tenant-placement turnaround); high-income renter base; 1,019 units permitted in San Mateo County in 2024 (484 in 5+ unit buildings).
- This rent runs 42% of the median local income ($117k/yr) — at the standard rent-burdened threshold; future hikes will face affordability resistance.
Forward outlook
- Local home prices are declining (-3.0%/yr); year-one equity from $2k of loan paydown is wiped out by about $7k of value loss. Plan a longer hold.
- San Mateo County population projected at +24% by 2050 — long-run rental-demand tailwind backs the buy-and-hold thesis.
- At projected returns (-3.0% appreciation + 4.9% rent growth), your $67k cash investment doubles in ~6 years — after that, you're playing with house money.
Negotiation context
- It's been on market 31 days — a 3% lower offer ($232k) is reasonable based on typical stale-listing flexibility.
- 3 sale attempts since 18y ago with the ask held roughly flat each time — persistent listings suggest the price (not the market) is what's stuck; bring a comps-based counter.
- Current owner paid $55k; list at $239k implies a 335% gain — meaningful room to come down on a strong offer.
Risks & watch-outs
- Watch-outs: flood insurance adds $427/mo.
- Climate carrying-cost: in FEMA flood zone AE (mandatory federal flood insurance) — expect insurance premiums to compound above CPI over the hold.
Questions for the listing agent
- It's been on market 31 days. Have you received any prior offers? Is the seller open to a 3% concession, seller financing, or rate buy-down credit?
- Built in 1968 — when were the roof, HVAC, electrical panel, plumbing, and water heater last replaced?
- What's the actual annual flood-insurance premium (NFIP or private), and is the property in a SFHA with mandatory coverage?
- Is there a deadline driving the sale (1031 exchange, divorce, estate, relocation)? That informs how much negotiation room exists.
- What's the average days-on-market for RENTAL listings here right now (not sales)? A rising rental-DOM trend means longer vacancies and softer asking-rent achievability than the comps imply.
- What's the recent tenant-quality profile in this submarket — average credit score on applications, eviction rate, late-payment / NSF rate, and stable-employment percentage? A property-management company in the area should have these aggregated.
- How much new for-sale + rental construction is in the pipeline within 1–3 miles? Heavy new supply typically softens prices + rents 12–24 months out; constrained supply supports both.
Investment metrics
- 1% rule
- 1.69% ✓
- Cap rate
- 14.03%
- Cash-on-cash
- 27.62%
- DSCR
- 2.23
- GRM
- 4.9
CMA / ARV
- ARV (on-the-fly)
- $241,660
- Comps found
- 2
Show comp detail 2 sales within ~0.75 mi
| Address | Dist | Beds/Ba | Sqft | Sold | Price | $/sf | Match |
|---|---|---|---|---|---|---|---|
| 3015 E Bayshore Rd #353 | 0.15mi | 2/2.0 | 960 (+12%) | 12mo | $269,900 | $281 | 60 |
| 3015 E Bayshore Rd #211 | 0.41mi | 3/2.0 (+1) | 983 (+14%) | 15mo | $275,000 | $280 | 36 |
Match score weights: distance 35% · size 25% · config 20% · recency 20%. Top-matched comps best support the ARV.
Projected returns pro-forma
-3.0% appreciation · 4.92% rent growth · sell at horizon
- IRR
- 14.7%
- Equity multiple
- 1.60×
- Total profit
- $40,486
- Equity at exit
- $35,636
- IRR
- 25.1%
- Equity multiple
- 3.42×
- Total profit
- $161,858
- Equity at exit
- $20,664
Cash invested: $66,920 (down + closing). Projections, not guarantees.
Landlord ↔ Tenant lean methodology
- Overall (STATE)
- 18 Strongly Tenant-Friendly
- State California
- 18 Strongly Tenant-Friendly · D+13
- County
- — inherits STATE
- City
- — inherits STATE
ZIP-level market 94063
- Rents YoY
- 4.9%
- Active inventory
- 29
- Price-to-rent
- 4.9×
Monthly cashflow live
- Estimated rent
- $4,040 high interval (Pro) →
- Mortgage (P&I)
- −$1,253
- Tax est. 1.5%
- −$299 /mo · $3,585/yr
- Insurance
- −$100
- Flood insurance flood zone
- −$427 /mo · $5,118/yr
- HOA
- −$0
- Vacancy / Maint / Mgmt
- −$849
- Net cashflow
- $1,114
Break-even live
UW: 25.0% down · 7.5% · 30yr · 1.5% tax · 5.0% vac · 8.0% maint · 8.0% mgmt
Financing live
Cash to close
- Down payment
- $59,750
- Closing costs
- $7,170
- Reserves months
- —
- Total cash needed
- —
Loan-product check · same deal, 3 products live
Conventional
25% down · 7.5% · 30yr
- Down + closing
- —
- Monthly P&I
- —
- Monthly cashflow
- —
- DSCR
- —
- Eligible?
- —
Personal DTI + credit; lowest rate.
DSCR
20% down · 8.5% · 30yr
- Down + closing
- —
- Monthly P&I
- —
- Monthly cashflow
- —
- DSCR
- —
- Eligible?
- —
No personal income docs; deal must DSCR.
Hard money
10% down · 12.0% · 12mo
- Down + closing
- —
- Monthly P&I
- —
- Monthly cashflow
- —
- DSCR
- —
- Eligible?
- —
Short-term bridge; refi at stabilization.
Rent comps 14 comps
| Address | Beds | Baths | Sqft | Rent | $/sqft | DOM | Units | Dist |
|---|---|---|---|---|---|---|---|---|
| 657 Hurlingame Ave Redwood City, CA | 3.0 | 1.0 | 775 | $4,500 | $5.81 | 1d | 1 | 0.69mi |
| 3566 Rolison Rd Unit 07 Redwood City, CA | 2.0 | 1.0 | 800 | $2,900 | $3.62 | 1d | 1 | 0.76mi |
| 3639 Haven Ave Menlo Park, CA | 1.0–2.0 | 1.0–2.0 | 949 | $5,867 | $6.18 | 1d | 12 | 0.92mi |
| 900 Chestnut St Redwood City, CA | 3.0 | 1.0–2.0 | 748 | $3,353 | $4.48 | 1d | 14 | 1.00mi |
| 3645 Haven Ave Menlo Park, CA | 1.0–2.0 | 1.0–2.0 | 893 | $4,719 | $5.28 | 1d | 3 | 1.01mi |
| 1405 Marshall St Redwood City, CA | 1.0–2.0 | 1.0–2.0 | 915 | $3,395 | $3.71 | 1d | 6 | 1.04mi |
| 1321 Marshall St Redwood City, CA | 1.0 | 1.0 | 730 | $2,495 | $3.42 | 1d | 3 | 1.06mi |
| 348 Fourth Ave Apt 17 Redwood City, CA | 1.0 | 1.0 | 550 | $1,950 | $3.55 | 7d | 1 | 1.14mi |
| 520 Hilton St Apt 3 Redwood City, CA | 1.0 | 1.0 | 608 | $2,400 | $3.95 | 1d | 1 | 1.18mi |
| 531 Cedar St Unit 537 Redwood City, CA | 2.0 | 1.0 | 750 | $3,550 | $4.73 | 1d | 1 | 1.21mi |
| 110 Constitution Dr Menlo Park, CA | 2.0 | 1.0–2.0 | 807 | $5,430 | $6.72 | 1d | 20 | 1.27mi |
| 2580 El Camino Real Redwood City, CA | 1.0–2.0 | 1.0–2.0 | 805 | $5,856 | $7.27 | 1d | 1 | 1.42mi |
| 1 Blu Harbor Blvd Redwood City, CA | 3.0 | 1.0–2.0 | 1181 | $7,492 | $6.34 | 1d | 12 | 1.45mi |
| 707 Leahy St Redwood City, CA | 1.0 | 1.0 | 524 | $4,007 | $7.64 | 1d | 3 | 1.47mi |
Listing history 20 events
-
2026-06-18days on market $239,000 Active 31 DOM
-
2026-06-17days on market $239,000 Active 30 DOM
-
2026-06-16days on market $239,000 Active 29 DOM
-
2026-06-15days on market $239,000 Active 28 DOM
-
2026-06-13days on market $239,000 Active 26 DOM
-
2026-06-13days on market $239,000 Active 25 DOM
-
2026-06-09days on market $239,000 Active 22 DOM
-
2026-06-08days on market $239,000 Active 21 DOM
-
2026-06-07days on market $239,000 Active 20 DOM
-
2026-06-04days on market $239,000 Active 17 DOM
-
2026-06-03days on market $239,000 Active 16 DOM
-
2026-06-02days on market $239,000 Active 15 DOM
-
2026-06-01days on market $239,000 Active 14 DOM
-
2026-05-31days on market $239,000 Active 13 DOM
-
2026-05-18$239,000 Active 626-char remark
Show marketing remark (626 chars)
Welcome to this lovely and well-maintained 2-bedroom, 1-bathroom home in Redwood City community of Redwood States. The home features a spacious living room, kitchen with granite counter, plenty of natural lighting, laminated flooring throughout the house, double pane windows, and a nice private outdoor BBQ area. The home offers an indoor laundry area and a covered carport for 3 cars. Perfect for first-time buyers or downsizers. Just minutes from highway 101, 84, major tech companies such as Facebook and Google, Stanford University, top hospitals. Own this great home instead of renting! You will love this charming home!
-
2009-01-21soldstatus $55,000 Sold 136-char remark
Show marketing remark (136 chars)
Nice two bedroom one bath affordable housing - newer roof -- pleasant relaxing enclosed patio area with Koi fish pond. Motivated seller.
-
2009-01-10historical 136-char remark
Show marketing remark (136 chars)
Nice two bedroom one bath affordable housing - newer roof -- pleasant relaxing enclosed patio area with Koi fish pond. Motivated seller.
-
2008-11-24price $62,500 136-char remark
Show marketing remark (136 chars)
Nice two bedroom one bath affordable housing - newer roof -- pleasant relaxing enclosed patio area with Koi fish pond. Motivated seller.
-
2008-11-19$72,000 136-char remark
Show marketing remark (136 chars)
Nice two bedroom one bath affordable housing - newer roof -- pleasant relaxing enclosed patio area with Koi fish pond. Motivated seller.
ⓘ Source: listings_history table (triggers on properties + properties_extension) + one-shot
backfill from property_details.listing_events for pre-trigger history.
Climate risk First Street
- Flood 6/10 Major FEMA zone AE · 89% chance over 30 yrs
- Wildfire 3/10 Moderate
- Heat 3/10 Moderate 7 d/yr ≥91°F today · 14 d/yr by 30 yrs out
- Wind 1/10 Low
- Air quality 8/10 Severe 16 unhealthy d/yr today · 16 by 30 yrs out
Nearby sold comps map
Loading sold comps map…
Walkable amenities ~0.75 mi
Loading nearby amenities…
Taxation est. · year 1
- Rental income
- $48,486
- − Mortgage interest
- −$13,388
- − Property taxes
- −$3,585
- − Insurance
- −$6,314
- − Repairs & maintenance
- −$3,879
- − Management
- −$3,879
- − Depreciation
- −$6,953
- Taxable income
- $10,489
- Est. tax owed @ 24.0%
- −$2,517
- After-tax cash flow
- $10,848/yr
For passive investors: Depreciation is non-cash, so a rental often shows a tax loss while cash-flowing — sheltering income. Rental losses are passive: they offset passive income freely, and up to $25,000/yr can offset ordinary (W-2) income if you actively participate and your MAGI is under $100k (phasing out to $0 by $150k); unused losses carry forward. On sale, claimed depreciation is recaptured at up to 25%, and gains may owe capital-gains tax (a 1031 exchange can defer both). Figures are a year-1 estimate at your 24.0% rate — not tax advice; consult a CPA.
Schools (NCES district)
- District
- Sequoia Union High
- NCES district ID
- 0636390
- Math proficiency
- 52% ▲ 5.00%
- Reading proficiency
- 69% ▲ 7.00%
- Median HH income
- $106,953
- Composite
- 58.48/100
- National rank
- #2055
- State rank
- #159 of 1400 in CA
Livability — Redwood City
No livability data for this city. (Only ~50 U.S. cities are tracked.)
Census & demographics
- Census place
- Redwood City, CA
- County
- San Mateo County · 733,415 people
- City population
- 83,154
- Metro
- San Francisco-Oakland-Berkeley, CA
- Population (ZIP)
- 34,433
- Household income
- $116,760
- Rent vs Own
- Severe rent burden
- 1812.0
Population outlook (San Mateo County) Hauer SSP2
- Today (2025)
- 864,008 people
- By 2030
- 910,523 · +5.4%
- By 2040
- 997,285 · +15.4%
- By 2050
- 1,071,189 · +24.0%
- By 2075
- 1,197,206 · +38.6%
- By 2100
- 1,192,523 · +38.0%
Race, ethnicity, and origin ACS 2023
- Neighborhood character
- Majority Hispanic (64%)
- Race & ethnicity
- Hispanic / Latino 64% Two or more races 22% White 19% Asian 11% Native American 3% Black 2% Pacific Islander 1%
- Hispanic origin (detail)
- Mexican 49% Puerto Rican 1%
- Common ancestry
- Lithuanian 1% Scotch-Irish 1% Italian 1%
- Foreign-born
- 41% · Canada, China, South Korea
- Languages at home
- 37% English-only · Spanish 52% Chinese 3% Other Asian/Pacific 2%
Political lean MEDSL · San Mateo
- 2024 margin
- Solid D (+50.3) · D 73.5% · R 23.2% · Other 3.3%
- 2008→2024 swing
- +1.6pp toward D · 2008: 48.7pp · 2024: 50.3pp
- All cycles
- 2024: D+50.3 2020: D+57.7 2016: D+57.7 2012: D+44.8 2008: D+48.7
Not yet ingested
- Civics
- —
Market trends
- HPI YoY
- ▼ -1489.51%
- Current HPI
- 366.9986
- Rent YoY
- ▲ 4.92%
- Metro
- San Francisco-Oakland-Berkeley, CA
- State GDP YoY
- ▲ 3.21%
- F500 in state
- 116
Industry mix (Fortune 500 HQ in CA)
| Industry | F500 HQs | Revenue |
|---|---|---|
| Technology | 27 | $1,492B |
|
||
| Financial Services | 3 | $174B |
|
||
| Retail | 3 | $44B |
|
||
| Insurance | 3 | $26B |
|
||
| Media / Entertainment | 2 | $115B |
|
||
| Pharmaceuticals / Biotech | 2 | $62B |
|
||
Price history
+231.9% since first listed6 events — show timeline
- 2026-05-18 Listed $239,000 bridgeMLS, Bay East AOR, or Contra Costa AOR
- 2026-05-18 Listed $239,000 MLSListings
- 2009-01-21 Sold (MLS) $55,000 MLSListings
- 2009-01-10 Listing Removed — MLSListings
- 2008-11-24 Price Changed $62,500 MLSListings
- 2008-11-19 Listed $72,000 MLSListings
Cash-flow waterfall
monthlySold comps — $/sqft
last 12 mo · ≤1 miLoading sold comps…