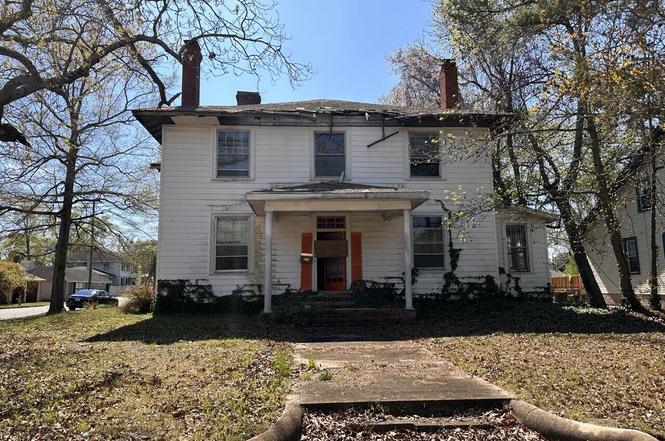
733 Tarboro St · Rocky Mount, NC
Flood risk 1/10 · Minimal
- FEMA flood zone
- X (unshaded)
- Chance of flooding over 30 yrs
- 0.0%
- Est. flood insurance / yr
- $507 – $1,088
Fire risk 3/10 · Minor
- Est. fire insurance / yr
- $906 – $1,684
Heat risk 7/10 · Major
- Hot days now (above 107°F)
- 7 days/yr
- Hot days in 30 yrs
- 16 days/yr
Wind risk 6/10 · Moderate
- Chance of severe wind over 30 yrs
- 76.0%
Air-quality risk 2/10 · Minimal
- Unhealthy air days now
- 1 days/yr
- Unhealthy air days in 30 yrs
- 2 days/yr
Risk factors via First Street. Map © Google.
Why this score? — see what drove the B- grade
The composite is a weighted blend of 9 inputs, each scored 0–100. Each bar is that input's sub-score; the figure is the points it added to the 100-point composite (weight × sub-score).
- Cash flow +30.0/30.0
- 1% rule +10.0/10.0
- DSCR +10.0/10.0
- ARV discount +7.5/15.0
- Livability +3.5/5.0
- Rent growth +2.5/5.0
- Condition / age +2.5/5.0
- Schools +2.0/10.0
- Appreciation +0.0/10.0
$59,000
🖨 Deal sheet 📄 Offer letter ✓ Due diligence
Listing remarks
This is a value-add opportunity geared toward experienced investors, portfolio builders, or buyers looking to acquire and hold real estate long-term. The property is being offered strictly AS-IS, with no repairs, credits, or concessions to be made by the seller due to the current condition of the home. The seller is a licensed real estate broker and brokerage owner who is intentionally liquidating a portion of his portfolio, creating a rare chance to step into a deal with strong potential for the right buyer. This property is best suited for those who understand rehab, repositioning, or long-term hold strategies and are comfortable evaluating condition and risk upfront. Priced aggressively
Key facts
- Built 1908
- Listed 146 days
Property features AI
Finance
- HOA & community: No homeowners association
Exterior
- Utilities: Public water; Public sewer
- Home design: Single-story house
- Construction: Vinyl siding
- Exterior features: Shingle roof; Combination foundation
Interior
- Bedrooms: 1 bedroom (main level)
- Flooring: Vinyl
- Bathrooms: 2 full bathrooms; 1 half bathroom
- Heating & cooling: Forced air heating; Central air conditioning
- Interior features: Vinyl flooring
Neighborhood map
What this means for you Summary
Snapshot
- This is a 1-bed/1.5-bath single-family listed at $59k.
Deal economics
- At list price, monthly cash flow is $500 ($6k/yr) — positive.
- The deal already cash-flows at list — no discount required.
- Meets the 1% rule at list price ($1k rent vs $59k).
- Recommended offer: $52k (12.0% below list) — sets the bar for market timing.
- Cap rate 16.5% vs local median 4.5% in Rocky Mount — top-decile yield for the area; either an underpriced asset or a hidden risk that comps aren't pricing in. Stress-test before assuming the spread holds.
Location & tenants
- Location reads 70/100 on livability (#134 in NC) — a middle-class / working-renter tenant base. Strengths: cost of living A+, housing A+, health & safety A+; Watch: schools F, crime F, amenities F.
- Edgecombe County Public Schools (rural): math 21% / reading 27% proficiency, ranked #163 of 178 in NC (top 92%) — low school quality limits family demand, transient renter base, plan for 1-2y turnover; 74% free/reduced lunch — lower-income household profile, screen leases tightly.
- Market conditions: 133 active listings in the ZIP; lower-income renter base — watch delinquency; 50 units permitted in Edgecombe County in 2024 (5 in 5+ unit buildings).
- This rent runs 30% of the median local income ($45k/yr) — at the standard rent-burdened threshold; future hikes will face affordability resistance.
Forward outlook
- Local home prices are declining (-3.0%/yr); year-one equity from $408 of loan paydown is wiped out by about $2k of value loss. Plan a longer hold.
- Edgecombe County population projected at -34% by 2050 — secular population decline; favor cash flow + early exit over multi-decade hold.
- At projected returns (-3.0% appreciation + 3.0% rent growth), your $17k cash investment doubles in ~4 years — after that, you're playing with house money.
Negotiation context
- It's been on market 147 days — a 12% lower offer ($52k) is reasonable based on typical stale-listing flexibility.
- 2 sale attempts since 18y ago with the ask held roughly flat each time — persistent listings suggest the price (not the market) is what's stuck; bring a comps-based counter.
Risks & watch-outs
- Watch-outs: built in 1908 — expect roof / HVAC / electrical / plumbing capex.
- Climate carrying-cost: major wind risk, 76% chance of damaging wind over 30y; extreme-heat days projected 7→16/yr by 2055 (HVAC capex compounding) — expect insurance premiums to compound above CPI over the hold.
Questions for the listing agent
- It's been on market 147 days. Have you received any prior offers? Is the seller open to a 12% concession, seller financing, or rate buy-down credit?
- Built in 1908 — when were the roof, HVAC, electrical panel, plumbing, and water heater last replaced?
- Why hasn't it sold? Are there any deal-killer items the seller is aware of (foundation, flood, title, zoning, code violations)?
- Is there a deadline driving the sale (1031 exchange, divorce, estate, relocation)? That informs how much negotiation room exists.
- Schools are F-rated, which usually means shorter tenancies and higher turnover. Who's the typical renter profile here, and what's been the actual vacancy rate?
- Crime grade is F in this area — have there been break-ins, vandalism, or insurance claims at this property in the last 3 years? What carrier currently insures it and at what premium?
- What's the average days-on-market for RENTAL listings here right now (not sales)? A rising rental-DOM trend means longer vacancies and softer asking-rent achievability than the comps imply.
- What's the recent tenant-quality profile in this submarket — average credit score on applications, eviction rate, late-payment / NSF rate, and stable-employment percentage? A property-management company in the area should have these aggregated.
- How much new for-sale + rental construction is in the pipeline within 1–3 miles? Heavy new supply typically softens prices + rents 12–24 months out; constrained supply supports both.
Investment metrics
- 1% rule
- 1.92% ✓
- Cap rate
- 16.46%
- Cash-on-cash
- 36.30%
- DSCR
- 2.62
- GRM
- 4.3
CMA / ARV
No comps found within radius.
Projected returns pro-forma
-3.0% appreciation · 3.0% rent growth · sell at horizon
- IRR
- 32.1%
- Equity multiple
- 2.35×
- Total profit
- $22,274
- Equity at exit
- $8,797
- IRR
- 39.1%
- Equity multiple
- 4.66×
- Total profit
- $60,412
- Equity at exit
- $5,101
Cash invested: $16,520 (down + closing). Projections, not guarantees.
Landlord ↔ Tenant lean methodology
- Overall (STATE)
- 85 Strongly Landlord-Friendly
- State North Carolina
- 85 Strongly Landlord-Friendly · R+3
- County
- — inherits STATE
- City
- — inherits STATE
ZIP-level market 27801
- Home prices YoY
- -5.6%
- Active inventory
- 133
- Price-to-rent
- 4.3×
Monthly cashflow live
- Estimated rent
- $1,131 medium interval (Pro) →
- Mortgage (P&I)
- −$309
- Tax from tax record
- −$60 /mo · $719/yr
- Insurance
- −$25
- HOA
- −$0
- Vacancy / Maint / Mgmt
- −$238
- Net cashflow
- $500
Break-even live
UW: 25.0% down · 7.5% · 30yr · 1.5% tax · 5.0% vac · 8.0% maint · 8.0% mgmt
Financing live
Cash to close
- Down payment
- $14,750
- Closing costs
- $1,770
- Reserves months
- —
- Total cash needed
- —
Loan-product check · same deal, 3 products live
Conventional
25% down · 7.5% · 30yr
- Down + closing
- —
- Monthly P&I
- —
- Monthly cashflow
- —
- DSCR
- —
- Eligible?
- —
Personal DTI + credit; lowest rate.
DSCR
20% down · 8.5% · 30yr
- Down + closing
- —
- Monthly P&I
- —
- Monthly cashflow
- —
- DSCR
- —
- Eligible?
- —
No personal income docs; deal must DSCR.
Hard money
10% down · 12.0% · 12mo
- Down + closing
- —
- Monthly P&I
- —
- Monthly cashflow
- —
- DSCR
- —
- Eligible?
- —
Short-term bridge; refi at stabilization.
Listing history 20 events
-
2026-06-19days on market $59,000 Active 147 DOM
-
2026-06-18days on market $59,000 Active 146 DOM
-
2026-06-17days on market $59,000 Active 145 DOM
-
2026-06-16days on market $59,000 Active 144 DOM
-
2026-06-15days on market $59,000 Active 143 DOM
-
2026-06-14days on market $59,000 Active 141 DOM
-
2026-06-13days on market $59,000 Active 140 DOM
-
2026-06-10days on market $59,000 Active 138 DOM
-
2026-06-09days on market $59,000 Active 137 DOM
-
2026-06-08days on market $59,000 Active 136 DOM
-
2026-06-07days on market $59,000 Active 135 DOM
-
2026-06-03days on market $59,000 Active 131 DOM
-
2026-06-02days on market $59,000 Active 130 DOM
-
2026-06-01days on market $59,000 Active 129 DOM
-
2026-05-31days on market $59,000 Active 128 DOM
-
2026-05-30days on market $59,000 Active 127 DOM
-
2026-01-21$59,000 Active
-
2009-05-07historical
-
2008-05-07$59,900
-
1997-10-29soldstatus $84,000
ⓘ Source: listings_history table (triggers on properties + properties_extension) + one-shot
backfill from property_details.listing_events for pre-trigger history.
Tax reassessment forecast NC · Resets to sale price
- Current annual tax
- $719 · $60/mo
- Projected year-2 tax
- $719 · $60/mo
- Expected delta
- $0/yr ($0/mo · 0.0%)
ⓘ Screening estimate from a state-policy table — verify with the county assessor before closing.
Climate risk First Street
- Flood 1/10 Low FEMA zone X (unshaded) · 0% chance over 30 yrs
- Wildfire 3/10 Moderate
- Heat 7/10 Severe 7 d/yr ≥107°F today · 16 d/yr by 30 yrs out
- Wind 6/10 Major 76% chance of damaging wind over 30 yrs
- Air quality 2/10 Low 1 unhealthy d/yr today · 2 by 30 yrs out
Nearby sold comps map
Loading sold comps map…
Walkable amenities ~0.75 mi
Loading nearby amenities…
Taxation est. · year 1
- Rental income
- $13,573
- − Mortgage interest
- −$3,305
- − Property taxes
- −$719
- − Insurance
- −$295
- − Repairs & maintenance
- −$1,086
- − Management
- −$1,086
- − Depreciation
- −$1,716
- Taxable income
- $5,367
- Est. tax owed @ 24.0%
- −$1,288
- After-tax cash flow
- $4,708/yr
For passive investors: Depreciation is non-cash, so a rental often shows a tax loss while cash-flowing — sheltering income. Rental losses are passive: they offset passive income freely, and up to $25,000/yr can offset ordinary (W-2) income if you actively participate and your MAGI is under $100k (phasing out to $0 by $150k); unused losses carry forward. On sale, claimed depreciation is recaptured at up to 25%, and gains may owe capital-gains tax (a 1031 exchange can defer both). Figures are a year-1 estimate at your 24.0% rate — not tax advice; consult a CPA.
Schools (NCES district)
- District
- Edgecombe County Public Schools
- NCES district ID
- 3701320
- Math proficiency
- 21% ▼ -2.00%
- Reading proficiency
- 27% ▲ 2.00%
- Median HH income
- $35,711
- Composite
- 19.85/100
- National rank
- #8696
- State rank
- #163 of 178 in NC
Livability — Rocky Mount
- Score
- 70/100
- State rank
- #134
- US rank
- #7692
Category grades
Schools grade is shown separately in the Schools card above.
Census & demographics
- Census place
- Rocky Mount, NC
- County
- Edgecombe County · 37,913 people
- City population
- 70,300
- Metro
- Rocky Mount, NC
- Population (ZIP)
- 19,532
- Household income
- $44,884
- Rent vs Own
- Severe rent burden
- 900.0
Population outlook (Edgecombe County) Hauer SSP2
- Today (2025)
- 47,800 people
- By 2030
- 44,396 · -7.1%
- By 2040
- 37,562 · -21.4%
- By 2050
- 31,495 · -34.1%
- By 2075
- 20,943 · -56.2%
- By 2100
- 13,674 · -71.4%
Race, ethnicity, and origin ACS 2023
- Neighborhood character
- Predominantly Black (70%)
- Race & ethnicity
- Black 70% White 24% Two or more races 3% Hispanic / Latino 1%
- Common ancestry
- Romanian 1%
- Foreign-born
- 1% · Canada
- Languages at home
- 97% English-only · Spanish 2%
Political lean MEDSL · Edgecombe
- 2024 margin
- Strong D (+22.7) · D 61.0% · R 38.3%
- 2008→2024 swing
- -11.8pp toward R · 2008: 34.5pp · 2024: 22.7pp
- All cycles
- 2024: D+22.7 2020: D+27.0 2016: D+32.2 2012: D+36.4 2008: D+34.5
Not yet ingested
- Civics
- —
Market trends
- HPI YoY
- ▼ -17.65%
- Current HPI
- 296.3428
- Rent YoY
- —
- Metro
- Rocky Mount, NC
- State GDP YoY
- ▲ 3.28%
- F500 in state
- 26
Industry mix (Fortune 500 HQ in NC)
| Industry | F500 HQs | Revenue |
|---|---|---|
| Financial Services | 2 | $213B |
|
||
| Retail | 2 | $95B |
|
||
| Industrial Conglomerate | 1 | $38B |
|
||
| Metals / Steel | 1 | $35B |
|
||
| Utilities | 1 | $30B |
|
||
| Industrial Machinery | 1 | $19B |
|
||
Price history
-29.8% since first listed4 events — show timeline
- 2026-01-21 Listed $59,000 TMLS
- 2009-05-07 Listing Removed — TMLS
- 2008-05-07 Listed $59,900 TMLS
- 1997-10-29 Sold (Public Records) $84,000 Public Records
Property tax history
-2.6%/yrLatest (2025): $719 · +0.0% YoY. Source: county tax records.
Cash-flow waterfall
monthlySold comps — $/sqft
last 12 mo · ≤1 miLoading sold comps…