 🏷️ Likely Rental
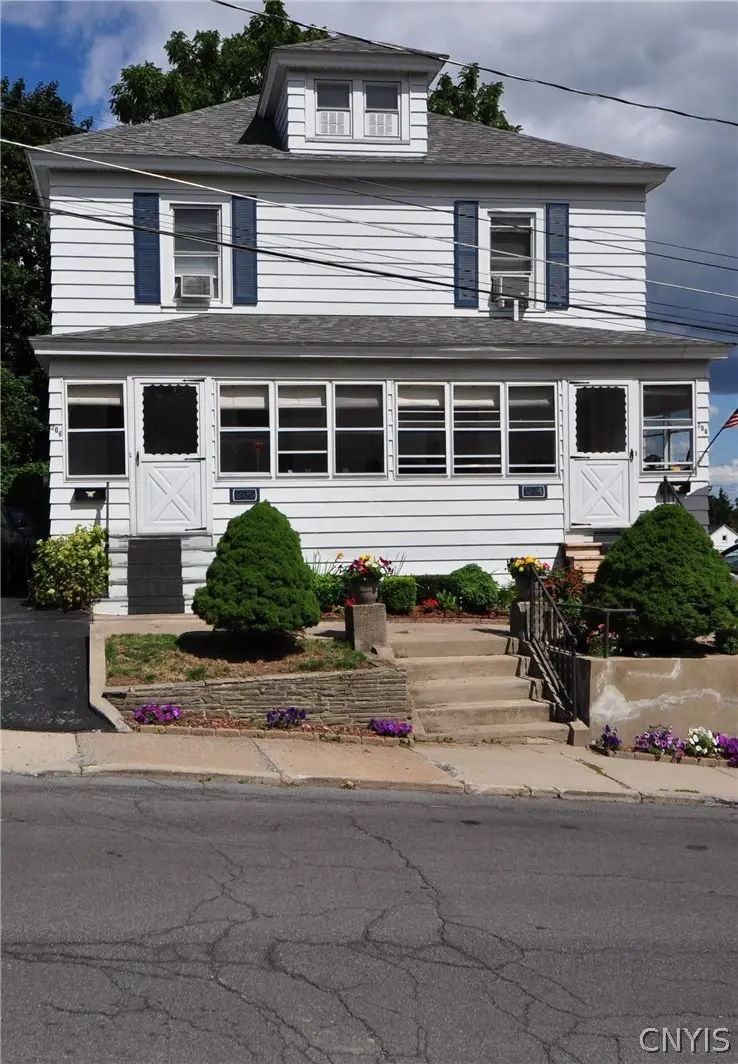
204 7th St · Solvay, NY
Flood risk 1/10 · Minimal
- FEMA flood zone
- X (unshaded)
- Chance of flooding over 30 yrs
- 0.0%
- Est. flood insurance / yr
- $473 – $860
Fire risk 1/10 · Minimal
- Est. fire insurance / yr
- $691 – $1,283
Heat risk 3/10 · Minor
- Hot days now (above 95°F)
- 7 days/yr
- Hot days in 30 yrs
- 16 days/yr
Wind risk 1/10 · Minimal
- Chance of severe wind over 30 yrs
- 0.0%
Air-quality risk 2/10 · Minimal
- Unhealthy air days now
- 0 days/yr
- Unhealthy air days in 30 yrs
- 1 days/yr
Risk factors via First Street. Map © Google.
Why this score? — see what drove the B+ grade
The composite is a weighted blend of 9 inputs, each scored 0–100. Each bar is that input's sub-score; the figure is the points it added to the 100-point composite (weight × sub-score).
- Cash flow +30.0/30.0
- ARV discount +15.0/15.0
- DSCR +10.0/10.0
- 1% rule +9.7/10.0
- Livability +3.6/5.0
- Schools +3.1/10.0
- Rent growth +2.5/5.0
- Condition / age +2.5/5.0
- Appreciation +0.0/10.0
$245,000
🖨 Deal sheet 📄 Offer letter ✓ Due diligence
Multi-family units
County records classify this as Multi-Family (2-4 Unit). Listing-text estimate: 2 units. confirmed
Listing remarks
High-Yield Investment Opportunity: 2-Family Duplex + 6-Unit Garage Complex Maximize your portfolio with this meticulously maintained, fully occupied side-by-side duplex. Situated on a prominent corner lot with easy access to transit and retail, this property offers a rare combination of residential rental income and storage revenue. Dual Income Streams: Enjoy steady cash flow from two 3-bedroom units and six individual garage bays, all currently 100% occupied. Tenant Perks: Both units feature private front and rear entrances, off-street parking, and a shared backyard patio. Tenants also benefit from inexpensive Solvay Electric, a high-demand feature for local renters. Exceptional Storage
Key facts
- Off street parking
- 2 family duplex
- 9,600 sq ft lot
Tags
Property features AI
Finance
- Financial info: Property contains 2 units with separate gas and electric meters; Both units are leased (current rents listed per unit); Operating expenses include professional management; Owner pays grounds care and snow removal; tenants pay all utilities; rent includes gardener and snow removal
Exterior
- Parking: Paved parking with two or more spaces; 6-car garage
- Utilities: Public water connected; Sewer connected
- Home design: Two-story multifamily building; Existing structure
- Construction: Aluminum siding; Blown-in insulation; Asphalt roof; Poured foundation; Built prior to current listing (existing)
- Exterior features: Private yard; Porch and enclosed porch; Corner lot near public transit; Rectangular lot
Interior
- Kitchen: Each unit includes an oven/range and refrigerator; Formal dining room in each unit
- Bedrooms: Two 3-bedroom units (each unit is on its own level)
- Flooring: Carpet; Hardwood; Varies
- Bathrooms: Two full bathrooms (one in each unit)
- Heating & cooling: Gas forced-air heating
- Interior features: Carpet and hardwood flooring with varied materials in places; Enclosed porch and porch (listed as interior/exterior living space); Full basement
- Laundry & utility: Laundry in-unit with washer hookup; Gas water heater
Neighborhood map
What this means for you Summary
Snapshot
- This is a 2 × 3-bed/1.0-bath units multifamily listed at $245k.
Deal economics
- At list price, monthly cash flow is $932 ($11k/yr) — positive. Per door: $466/mo.
- The deal already cash-flows at list — no discount required.
- Meets the 1% rule at list price ($4k rent vs $245k).
Location & tenants
- Location reads 72/100 on livability (#350 in NY) — a middle-class / working-renter tenant base. Strengths: housing A+, health & safety A+, cost of living A; Watch: employment D+, crime D, amenities F.
- Solvay Union Free School District (suburban): math 31% / reading 42% proficiency, ranked #550 of 590 in NY (top 93%) — families likely to look elsewhere, expect single-tenant / working-renter base with shorter leases.
- Market conditions: 59 active listings in the ZIP; 1 comparable units currently listed for rent nearby; 616 units permitted in Onondaga County in 2024 (256 in 5+ unit buildings).
- At $3,611/mo this rent would consume 64% of the median local household income ($68k/yr) (locally 210% of renters already pay >50% of income on rent) — very limited rent-growth headroom before tenants either downsize or default.
Forward outlook
- Local home prices are declining (-3.0%/yr); year-one equity from $2k of loan paydown is wiped out by about $7k of value loss. Plan a longer hold.
- Onondaga County population projected to shrink 9% by 2050 — rents likely to lag national; underwrite the cash flow, not the appreciation.
- At projected returns (-3.0% appreciation + 3.0% rent growth), your $69k cash investment doubles in ~8 years — after that, you're playing with house money.
Negotiation context
- Only 10 days on market — expect competitive offers; lowballing is unlikely to land.
- 3 sale attempts since 10y ago with the ask held roughly flat each time — persistent listings suggest the price (not the market) is what's stuck; bring a comps-based counter.
- Current owner paid $124k; list at $245k implies a 98% gain — meaningful room to come down on a strong offer.
Risks & watch-outs
- Watch-outs: property tax is 2.6% of price; built in 1918 — expect roof / HVAC / electrical / plumbing capex.
Questions for the listing agent
- Can we see the unit-by-unit rent roll, current vacancy, and any below-market leases? What's the average tenancy length?
- What capital expenditures (roof, boiler, parking lot, exteriors) have been made in the last 5 years, and what's planned in the next 2?
- Built in 1918 — when were the roof, HVAC, electrical panel, plumbing, and water heater last replaced?
- Property tax is high relative to price — has the assessment been appealed recently, and will the sale trigger a re-assessment?
- Is there a deadline driving the sale (1031 exchange, divorce, estate, relocation)? That informs how much negotiation room exists.
- Schools are B-rated — typically a magnet for longer-tenancy family renters. What's the average tenant stay here, and is there a school-zone premium baked into asking?
- Crime grade is D in this area — have there been break-ins, vandalism, or insurance claims at this property in the last 3 years? What carrier currently insures it and at what premium?
- What's the average days-on-market for RENTAL listings here right now (not sales)? A rising rental-DOM trend means longer vacancies and softer asking-rent achievability than the comps imply.
- What's the recent tenant-quality profile in this submarket — average credit score on applications, eviction rate, late-payment / NSF rate, and stable-employment percentage? A property-management company in the area should have these aggregated.
- How much new apartment / multifamily construction is in the pipeline within 1–3 miles? Heavy new supply (>2% of stock underway) typically softens rents 12–24 months out; light construction supports rent growth.
Investment metrics
- 1% rule
- 1.47% ✓
- Cap rate
- 10.86%
- Cash-on-cash
- 16.30%
- DSCR
- 1.73
- GRM
- 5.7
CMA / ARV
- ARV (median comp)
- $375,156
- List price
- $245,000
- Delta
- -34.69%
- Verdict
- UNDERPRICED
- Comps
- 20 within 1.0 mi
Show comp detail 5 sales within ~0.75 mi
| Address | Dist | Beds/Ba | Sqft | Sold | Price | $/sf | Match |
|---|---|---|---|---|---|---|---|
| 333 1st St | 0.26mi | 6/2.0 | 2,218 (-1%) | 10mo | $180,000 | $81 | 78 |
| 810 3rd St | 0.41mi | 6/2.0 | 2,268 (+1%) | 12mo | $235,000 | $104 | 69 |
| 505 Cogswell Ave | 0.11mi | 7/3.0 (+1) | 2,410 (+8%) | 8mo | $390,000 | $162 | 66 |
| 222 Lamont Ave | 0.67mi | 5/2.0 (-1) | 2,068 (-8%) | 9mo | $125,000 | $60 | 43 |
| 307 Gertrude Ave | 0.24mi | 5/3.0 (-1) | 1,936 (-14%) | 20mo | $185,000 | $96 | 40 |
Match score weights: distance 35% · size 25% · config 20% · recency 20%. Top-matched comps best support the ARV.
Projected returns pro-forma
-3.0% appreciation · 3.0% rent growth · sell at horizon
- IRR
- 7.4%
- Equity multiple
- 1.29×
- Total profit
- $19,857
- Equity at exit
- $36,530
- IRR
- 16.7%
- Equity multiple
- 2.38×
- Total profit
- $94,521
- Equity at exit
- $21,183
Cash invested: $68,600 (down + closing). Projections, not guarantees.
Landlord ↔ Tenant lean methodology
- Overall (STATE)
- 15 Strongly Tenant-Friendly
- State New York
- 15 Strongly Tenant-Friendly · D+10
- County
- — inherits STATE
- City
- — inherits STATE
ZIP-level market 13209
- Home prices YoY
- -7.7%
- Active inventory
- 59
- Price-to-rent
- 11.3×
Monthly cashflow live
- Estimated rent
- $3,611 high interval (Pro) →
- Mortgage (P&I)
- −$1,285
- Tax from tax record
- −$534 /mo · $6,405/yr
- Insurance
- −$102
- HOA
- −$0
- Vacancy / Maint / Mgmt
- −$758
- Net cashflow
- $932
Break-even live
2-unit breakdown (identical units grouped — click to expand)
| Units | Beds | Baths | Est. rent |
|---|---|---|---|
| 2× units | 3 | 1 | $3,612 |
| #1 | 3 | 1 | $1,806 |
| #2 | 3 | 1 | $1,806 |
| Total (2 units) | $3,611 | ||
UW: 25.0% down · 7.5% · 30yr · 1.5% tax · 5.0% vac · 8.0% maint · 8.0% mgmt
Financing live
Cash to close
- Down payment
- $61,250
- Closing costs
- $7,350
- Reserves months
- —
- Total cash needed
- —
Loan-product check · same deal, 3 products live
Conventional
25% down · 7.5% · 30yr
- Down + closing
- —
- Monthly P&I
- —
- Monthly cashflow
- —
- DSCR
- —
- Eligible?
- —
Personal DTI + credit; lowest rate.
DSCR
20% down · 8.5% · 30yr
- Down + closing
- —
- Monthly P&I
- —
- Monthly cashflow
- —
- DSCR
- —
- Eligible?
- —
No personal income docs; deal must DSCR.
Hard money
10% down · 12.0% · 12mo
- Down + closing
- —
- Monthly P&I
- —
- Monthly cashflow
- —
- DSCR
- —
- Eligible?
- —
Short-term bridge; refi at stabilization.
Rent comps 1 comps
| Address | Beds | Baths | Sqft | Rent | $/sqft | DOM | Units | Dist |
|---|---|---|---|---|---|---|---|---|
| 312 Hall Ave Solvay, NY | 5.0 | 2.5 | 1800 | $3,600 | $2.00 | 21d | 1 | 0.54mi |
Listing history 7 events
-
2026-05-11status Pending 1076-char remark
-
2026-05-01$245,000 Active 1076-char remark
-
2023-11-08historical $1,085
-
2023-11-02$1,085
-
2016-08-10historical
-
2016-08-09$950 Active
-
2008-08-29soldstatus $124,000
ⓘ Source: listings_history table (triggers on properties + properties_extension) + one-shot
backfill from property_details.listing_events for pre-trigger history.
Tax reassessment forecast NY · Partial reset (capped growth)
- Current annual tax
- $6,405 · $534/mo
- Projected year-2 tax
- $6,405 · $534/mo
- Expected delta
- $0/yr ($0/mo · 0.0%)
ⓘ Screening estimate from a state-policy table — verify with the county assessor before closing.
Climate risk First Street
- Flood 1/10 Low FEMA zone X (unshaded) · 0% chance over 30 yrs
- Wildfire 1/10 Low
- Heat 3/10 Moderate 7 d/yr ≥95°F today · 16 d/yr by 30 yrs out
- Wind 1/10 Low 0% chance of damaging wind over 30 yrs
- Air quality 2/10 Low 0 unhealthy d/yr today · 1 by 30 yrs out
Nearby sold comps map
Loading sold comps map…
Walkable amenities ~0.75 mi
Loading nearby amenities…
Taxation est. · year 1
- Rental income
- $43,332
- − Mortgage interest
- −$13,724
- − Property taxes
- −$6,405
- − Insurance
- −$1,225
- − Repairs & maintenance
- −$3,467
- − Management
- −$3,467
- − Depreciation
- −$7,127
- Taxable income
- $7,918
- Est. tax owed @ 24.0%
- −$1,900
- After-tax cash flow
- $9,284/yr
For passive investors: Depreciation is non-cash, so a rental often shows a tax loss while cash-flowing — sheltering income. Rental losses are passive: they offset passive income freely, and up to $25,000/yr can offset ordinary (W-2) income if you actively participate and your MAGI is under $100k (phasing out to $0 by $150k); unused losses carry forward. On sale, claimed depreciation is recaptured at up to 25%, and gains may owe capital-gains tax (a 1031 exchange can defer both). Figures are a year-1 estimate at your 24.0% rate — not tax advice; consult a CPA.
Schools (NCES district)
- District
- Solvay Union Free School District
- NCES district ID
- 3627150
- Math proficiency
- 31% ▼ -14.00%
- Reading proficiency
- 42% ▼ -4.00%
- Median HH income
- $47,163
- Composite
- 31.28/100
- National rank
- #6018
- State rank
- #550 of 590 in NY
Livability — Solvay
- Score
- 72/100
- State rank
- #350
- US rank
- #5913
Category grades
Schools grade is shown separately in the Schools card above.
Census & demographics
- Census place
- Solvay, NY
- County
- Onondaga County · 247,257 people
- Metro
- Syracuse, NY
- Population (ZIP)
- 12,714
- Household income
- $68,138
- Rent vs Own
- Severe rent burden
- 210.0
Population outlook (Onondaga County) Hauer SSP2
- Today (2025)
- 467,894 people
- By 2030
- 463,381 · -1.0%
- By 2040
- 447,697 · -4.3%
- By 2050
- 426,399 · -8.9%
- By 2075
- 373,661 · -20.1%
- By 2100
- 307,967 · -34.2%
Race, ethnicity, and origin ACS 2023
- Neighborhood character
- Predominantly White (86%)
- Race & ethnicity
- White 86% Two or more races 6% Hispanic / Latino 6% Black 3%
- Hispanic origin (detail)
- Mexican 1% Puerto Rican 4%
- Common ancestry
- Romanian 11% Subsaharan African 6% Lithuanian 2%
- Foreign-born
- 11% · Canada, China
- Languages at home
- 87% English-only · Russian/Polish/Slavic 5% Spanish 3% Arabic 2%
Political lean MEDSL · Onondaga
- 2024 margin
- D (+17.3) · D 58.6% · R 41.4%
- 2008→2024 swing
- -3.0pp toward R · 2008: 20.3pp · 2024: 17.3pp
- All cycles
- 2024: D+17.3 2020: D+20.6 2016: D+12.8 2012: D+21.1 2008: D+20.3
Not yet ingested
- Civics
- —
Market trends
- HPI YoY
- ▼ -27.23%
- Current HPI
- 326.7671
- Rent YoY
- —
- Metro
- Syracuse, NY
- State GDP YoY
- ▲ 2.60%
- F500 in state
- 92
Industry mix (Fortune 500 HQ in NY)
| Industry | F500 HQs | Revenue |
|---|---|---|
| Financial Services | 10 | $950B |
|
||
| Consumer Goods | 9 | $162B |
|
||
| Insurance | 4 | $225B |
|
||
| Telecommunications | 2 | $144B |
|
||
| Pharmaceuticals | 2 | $112B |
|
||
| Media / Entertainment | 2 | $69B |
|
||
Price history
+97.6% since first listed7 events — show timeline
- 2026-05-11 Pending — CNYIS
- 2026-05-01 Listed $245,000 CNYIS
- 2023-11-08 Rental Removed $1,085 APPFOLIO
- 2023-11-02 Listed for Rent $1,085 APPFOLIO
- 2016-08-10 Listing Removed — WNYREIS
- 2016-08-09 Listed $950 WNYREIS
- 2008-08-29 Sold (Public Records) $124,000 Public Records
Property tax history
+3.4%/yrLatest (2025): $6,405 · +9.8% YoY. Source: county tax records.
Cash-flow waterfall
monthlySold comps — $/sqft
last 12 mo · ≤1 miLoading sold comps…