7616 Upper Seguin Rd · Converse, TX
Flood risk 1/10 · Minimal
- FEMA flood zone
- X (unshaded)
- Chance of flooding over 30 yrs
- 0.0%
- Est. flood insurance / yr
- $507 – $1,088
Fire risk 5/10 · Moderate
- Est. fire insurance / yr
- $1,222 – $2,270
Heat risk 8/10 · Major
- Hot days now (above 108°F)
- 7 days/yr
- Hot days in 30 yrs
- 22 days/yr
Wind risk 8/10 · Major
- Chance of severe wind over 30 yrs
- 80.0%
Air-quality risk 1/10 · Minimal
- Unhealthy air days now
- 0 days/yr
- Unhealthy air days in 30 yrs
- 0 days/yr
Risk factors via First Street. Map © Google.
Why this score? — see what drove the B- grade
The composite is a weighted blend of 9 inputs, each scored 0–100. Each bar is that input's sub-score; the figure is the points it added to the 100-point composite (weight × sub-score).
- Cash flow +30.0/30.0
- 1% rule +10.0/10.0
- DSCR +10.0/10.0
- ARV discount +7.5/15.0
- Livability +3.3/5.0
- Schools +2.4/10.0
- Rent growth +2.2/5.0
- Condition / age +2.2/5.0
- Appreciation +0.0/10.0
$79,000
🖨 Deal sheet 📄 Offer letter ✓ Due diligence
Listing remarks
Front and rear flood lights Ring surveillance all around Hardy Board Skirting Close to Judson Highschool Tier 3 Insulation Large front porch small back porch
Key facts
- Hardy board skirting
- Large front porch
- Tier 3 insulation
Tags
Property features AI
Exterior
- Home design: Built in 2018
- Construction: Living area of approximately 1,456
- Exterior features: Located in the Northeast Side subdivision
Neighborhood map
What this means for you Summary
Snapshot
- This is a 3-bed/2.0-bath manufactured listed at $79k. Condition is rated fair.
Deal economics
- At list price, monthly cash flow is $705 ($8k/yr) — positive.
- The deal already cash-flows at list — no discount required.
- Meets the 1% rule at list price ($2k rent vs $79k).
- Recommended offer: $78k (1.5% below list) — sets the bar for market timing.
- Cap rate 17.0% vs local median 4.4% in Converse — top-decile yield for the area; either an underpriced asset or a hidden risk that comps aren't pricing in. Stress-test before assuming the spread holds.
Location & tenants
- Location reads 66/100 on livability (#649 in TX) — a middle-class / working-renter tenant base. Strengths: cost of living A+, housing A+, employment B; Watch: schools C-, crime C-, amenities F.
- Judson ISD (suburban): math 21% / reading 33% proficiency, ranked #660 of 826 in TX (top 80%) — low school quality limits family demand, transient renter base, plan for 1-2y turnover.
- Market conditions: Rents soft (-1.1%/yr); 1152 active listings in the ZIP; 40 comparable units currently listed for rent nearby; rentals at typical pace (median 15d on market — plan ~3-4 weeks tenant-placement turnaround); solid renter incomes; 8,308 units permitted in Bexar County in 2024 (2,506 in 5+ unit buildings).
Forward outlook
- Local home prices are declining (-3.0%/yr); year-one equity from $546 of loan paydown is wiped out by about $2k of value loss. Plan a longer hold.
- Bexar County population projected at +50% by 2050 — long-run rental-demand tailwind backs the buy-and-hold thesis.
- At projected returns (-3.0% appreciation + 0.0% rent growth), your $22k cash investment doubles in ~4 years — after that, you're playing with house money.
Negotiation context
- It's been on market 15 days — a 2% lower offer ($78k) is reasonable based on typical stale-listing flexibility.
- 2 sale attempts since 23y ago with the ask held roughly flat each time — persistent listings suggest the price (not the market) is what's stuck; bring a comps-based counter.
Risks & watch-outs
- Climate carrying-cost: severe wind risk, 80% chance of damaging wind over 30y; moderate wildfire risk; extreme-heat days projected 7→22/yr by 2055 (HVAC capex compounding) — expect insurance premiums to compound above CPI over the hold.
Questions for the listing agent
- Have any recent inspections been done? Can we get a copy of the seller's disclosures and any deferred-maintenance estimates?
- Is there a deadline driving the sale (1031 exchange, divorce, estate, relocation)? That informs how much negotiation room exists.
- What's the average days-on-market for RENTAL listings here right now (not sales)? A rising rental-DOM trend means longer vacancies and softer asking-rent achievability than the comps imply.
- What's the recent tenant-quality profile in this submarket — average credit score on applications, eviction rate, late-payment / NSF rate, and stable-employment percentage? A property-management company in the area should have these aggregated.
- How much new for-sale + rental construction is in the pipeline within 1–3 miles? Heavy new supply typically softens prices + rents 12–24 months out; constrained supply supports both.
Investment metrics
- 1% rule
- 2.04% ✓
- Cap rate
- 17.00%
- Cash-on-cash
- 38.23%
- DSCR
- 2.70
- GRM
- 4.1
CMA / ARV
No comps found within radius.
Projected returns pro-forma
-3.0% appreciation · 0.0% rent growth · sell at horizon
- IRR
- 30.8%
- Equity multiple
- 2.24×
- Total profit
- $27,386
- Equity at exit
- $11,779
- IRR
- 36.3%
- Equity multiple
- 3.87×
- Total profit
- $63,510
- Equity at exit
- $6,830
Cash invested: $22,120 (down + closing). Projections, not guarantees.
Landlord ↔ Tenant lean methodology
- Overall (STATE)
- 87 Strongly Landlord-Friendly
- State Texas
- 87 Strongly Landlord-Friendly · R+5
- County
- — inherits STATE
- City
- — inherits STATE
ZIP-level market 78109
- Home prices YoY
- -17.8%
- Rents YoY
- -1.1%
- Active inventory
- 1152
- Price-to-rent
- 4.1×
Monthly cashflow live
- Estimated rent
- $1,615 high interval (Pro) →
- Mortgage (P&I)
- −$414
- Tax from tax record
- −$124 /mo · $1,489/yr
- Insurance
- −$33
- HOA
- −$0
- Vacancy / Maint / Mgmt
- −$339
- Net cashflow
- $705
Break-even live
UW: 25.0% down · 7.5% · 30yr · 1.5% tax · 5.0% vac · 8.0% maint · 8.0% mgmt
Financing live
Cash to close
- Down payment
- $19,750
- Closing costs
- $2,370
- Reserves months
- —
- Total cash needed
- —
Loan-product check · same deal, 3 products live
Conventional
25% down · 7.5% · 30yr
- Down + closing
- —
- Monthly P&I
- —
- Monthly cashflow
- —
- DSCR
- —
- Eligible?
- —
Personal DTI + credit; lowest rate.
DSCR
20% down · 8.5% · 30yr
- Down + closing
- —
- Monthly P&I
- —
- Monthly cashflow
- —
- DSCR
- —
- Eligible?
- —
No personal income docs; deal must DSCR.
Hard money
10% down · 12.0% · 12mo
- Down + closing
- —
- Monthly P&I
- —
- Monthly cashflow
- —
- DSCR
- —
- Eligible?
- —
Short-term bridge; refi at stabilization.
Rent comps 40 comps
| Address | Beds | Baths | Sqft | Rent | $/sqft | DOM | Units | Dist |
|---|---|---|---|---|---|---|---|---|
| 8827 Slumber Ln Converse, TX | 3.0 | 2.0 | 1292 | $2,000 | $1.55 | 44d | 1 | 0.22mi |
| 8818 Slumber Ln Converse, TX | 3.0 | 2.0 | 1259 | $1,700 | $1.35 | 2d | 1 | 0.25mi |
| 317 Vivian Dr Converse, TX | 3.0 | 2.0 | 1454 | $1,650 | $1.13 | 3d | 1 | 0.31mi |
| 10814 Lillia BR San Antonio, TX | 3.0 | 2.0 | 1266 | $1,600 | $1.26 | 44d | 1 | 0.37mi |
| 305 Jeanette Dr Converse, TX | 3.0 | 2.0 | 1084 | $1,600 | $1.48 | 24d | 1 | 0.41mi |
| 309 Jeanette Dr Converse, TX | 4.0 | 2.0 | 1105 | $1,595 | $1.44 | 24d | 1 | 0.42mi |
| 9060 FM 78 Converse, TX | 1.0–2.0 | 1.0 | 769 | $1,150 | $1.50 | 2d | 11 | 0.42mi |
| 209 Royal Dr Converse, TX | 3.0 | 2.0 | 952 | $1,500 | $1.58 | 15d | 1 | 0.48mi |
| 6907 Saharastone Dr Converse, TX | 3.0 | 3.0 | 1211 | $1,310 | $1.08 | 4d | 1 | 0.49mi |
| 6907 Saharastone Dr Converse, TX | 3.0 | 3.0 | 1211 | $1,416 | $1.17 | 12d | 1 | 0.49mi |
| 6610 Eastern Clouds Converse, TX | 3.0 | 2.0 | 1496 | $1,660 | $1.11 | 4d | 1 | 0.64mi |
| 812 Station St Converse, TX | 2.0 | 1.0 | 1100 | $975 | $0.89 | 24d | 1 | 0.66mi |
| 810 Station St Apt 3 Converse, TX | 2.0 | 2.0 | 1088 | $825 | $0.76 | 4d | 1 | 0.68mi |
| 810 Station St Unit 1 Converse, TX | 2.0 | 2.0 | 1088 | $899 | $0.83 | 24d | 1 | 0.68mi |
| 202 Ash Dr Unit 103 Converse, TX | 2.0 | 2.0 | 900 | $995 | $1.11 | 24d | 1 | 0.69mi |
| 8355 Crestway Dr Unit 710 Converse, TX | 2.0 | 2.0 | 865 | $947 | $1.09 | 3d | 1 | 0.70mi |
| 6822 Eden Grove Dr Converse, TX | 3.0 | 2.0 | 1435 | $1,490 | $1.04 | 44d | 1 | 0.74mi |
| 517 Oak Dr Converse, TX | 3.0 | 1.5 | 894 | $1,500 | $1.68 | 24d | 1 | 0.74mi |
| 6846 Columbia Ridge Dr Converse, TX | 3.0 | 2.0 | 1307 | $1,430 | $1.09 | 4d | 1 | 0.77mi |
| 9019 Gore Cres Converse, TX | 3.0–5.0 | 2.0–3.5 | 2058 | $2,220 | $1.08 | 2d | 1 | 0.79mi |
| 7611 Overview Pl San Antonio, TX | 3.0 | 2.0 | 1451 | $1,750 | $1.21 | 15d | 1 | 0.80mi |
| 8206 Longhorn Ridge Dr Converse, TX | 3.0 | 2.0 | 1386 | $1,525 | $1.10 | 3d | 1 | 0.82mi |
| 103 Avenue F Unit A Converse, TX | 2.0 | 1.0 | 1372 | $1,175 | $0.86 | 44d | 1 | 0.88mi |
| 9234 Foxing Blfs Converse, TX | 3.0 | 2.5 | 1414 | $1,825 | $1.29 | 3d | 1 | 0.88mi |
| 8304 Heights Vly Converse, TX | 3.0 | 2.0 | 1249 | $1,450 | $1.16 | 15d | 1 | 0.92mi |
| 301 Converse Center St Converse, TX | 1.0–3.0 | 1.0–2.0 | 975 | $1,417 | $1.45 | 44d | 1 | 0.93mi |
| 320 Station St Unit 101 Converse, TX | 2.0 | 2.0 | 877 | $825 | $0.94 | 12d | 1 | 0.98mi |
| 9180 Shadow Creek Ln Unit 710 Converse, TX | 2.0 | 2.0 | 848 | $1,169 | $1.38 | 3d | 1 | 1.00mi |
| 8848 Staghorn Ml Converse, TX | 3.0 | 2.0 | 1212 | $1,500 | $1.24 | 4d | 1 | 1.02mi |
| 6426 Thorpe Holw Converse, TX | 3.0 | 2.5 | 1414 | $1,600 | $1.13 | 24d | 1 | 1.03mi |
| 9619 Copper Rock Converse, TX | 3.0 | 2.0 | 1301 | $1,700 | $1.31 | 44d | 1 | 1.03mi |
| 9711 Copper Rock Converse, TX | 3.0 | 2.0 | 1327 | $1,645 | $1.24 | 44d | 1 | 1.06mi |
| 6027 Kensinger Pass Converse, TX | 3.0 | 2.0 | 1332 | $1,480 | $1.11 | 4d | 1 | 1.07mi |
| 7135 Grassy Trl San Antonio, TX | 3.0 | 2.0 | 1422 | $2,000 | $1.41 | 44d | 1 | 1.20mi |
| 208 Michelle Dr Converse, TX | 3.0 | 2.0 | 1156 | $1,400 | $1.21 | 24d | 1 | 1.22mi |
| 9205 Farm to Market Road 78 Unit 710 Converse, TX | 2.0 | 2.0 | 896 | $1,051 | $1.17 | 3d | 1 | 1.32mi |
| 5736 Brook Pr San Antonio, TX | 3.0 | 2.5 | 1497 | $1,500 | $1.00 | 24d | 1 | 1.39mi |
| 7919 Wayside Trl San Antonio, TX | 3.0 | 2.0 | 1453 | $1,400 | $0.96 | 44d | 1 | 1.41mi |
| 7443 Longing Trl San Antonio, TX | 3.0 | 2.0 | 1487 | $1,495 | $1.01 | 12d | 1 | 1.42mi |
| 7114 Elm Trail Dr San Antonio, TX | 3.0 | 2.0 | 1332 | $1,600 | $1.20 | 44d | 1 | 1.42mi |
Listing history 10 events
-
2026-06-18days on market $79,000 Active 15 DOM
-
2026-06-17days on market $79,000 Active 14 DOM
-
2026-06-16days on market $79,000 Active 13 DOM
-
2026-06-15days on market $79,000 Active 12 DOM
-
2026-06-13days on market $79,000 Active 10 DOM
-
2026-06-09days on market $79,000 Active 6 DOM
-
2026-06-08days on market $79,000 Active 5 DOM
-
2026-06-07days on market $79,000 Active 4 DOM
-
2026-06-04remarks 160-char remark
-
2026-06-04$79,000 Active 1 DOM
ⓘ Source: listings_history table (triggers on properties + properties_extension) + one-shot
backfill from property_details.listing_events for pre-trigger history.
Tax reassessment forecast TX · Resets to sale price
- Current annual tax
- $1,489 · $124/mo
- Projected year-2 tax
- $1,489 · $124/mo
- Expected delta
- $0/yr ($0/mo · -0.0%)
ⓘ Screening estimate from a state-policy table — verify with the county assessor before closing.
Climate risk First Street
- Flood 1/10 Low FEMA zone X (unshaded) · 0% chance over 30 yrs
- Wildfire 5/10 Major
- Heat 8/10 Severe 7 d/yr ≥108°F today · 22 d/yr by 30 yrs out
- Wind 8/10 Severe 80% chance of damaging wind over 30 yrs
- Air quality 1/10 Low 0 unhealthy d/yr today · 0 by 30 yrs out
Nearby sold comps map
Loading sold comps map…
Walkable amenities ~0.75 mi
Loading nearby amenities…
Taxation est. · year 1
- Rental income
- $19,381
- − Mortgage interest
- −$4,425
- − Property taxes
- −$1,489
- − Insurance
- −$395
- − Repairs & maintenance
- −$1,550
- − Management
- −$1,550
- − Depreciation
- −$2,298
- Taxable income
- $7,673
- Est. tax owed @ 24.0%
- −$1,842
- After-tax cash flow
- $6,615/yr
For passive investors: Depreciation is non-cash, so a rental often shows a tax loss while cash-flowing — sheltering income. Rental losses are passive: they offset passive income freely, and up to $25,000/yr can offset ordinary (W-2) income if you actively participate and your MAGI is under $100k (phasing out to $0 by $150k); unused losses carry forward. On sale, claimed depreciation is recaptured at up to 25%, and gains may owe capital-gains tax (a 1031 exchange can defer both). Figures are a year-1 estimate at your 24.0% rate — not tax advice; consult a CPA.
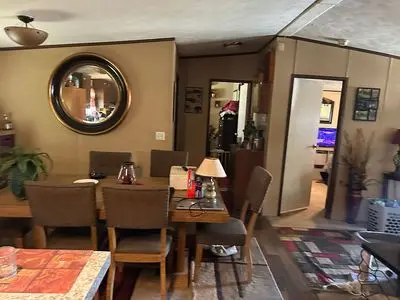
Condition & rehab AI · 1 photo
This manufactured home requires moderate renovations, focusing on updating the kitchen, bathrooms, flooring, and paint to improve its resale and rental value.
Repairs flagged
- Major kitchen cabinets — No photos of kitchen
- Major bathroom fixtures — No photos of bathrooms
- Major flooring — Worn carpet
- Major paint — Worn paint
Value-add opportunities
- Both New flooring — Improves appearance and comfort
- Both Paint interior walls — Enhances curb appeal and interior aesthetics
- Both New kitchen cabinets and fixtures — Modernizes the space and adds value
Renovation cost estimate screening
| Repair item | Severity | Est. cost |
|---|---|---|
| kitchen cabinets · No photos of kitchen | Major | $15,000–50,000 |
| bathroom fixtures · No photos of bathrooms | Major | $15,000–50,000 |
| flooring · Worn carpet | Major | $15,000–50,000 |
| paint · Worn paint | Major | $15,000–50,000 |
| Total estimated repair cost · 4 items | $60,000–200,000 |
Value-add ROI direction
- Both New flooring — Improves appearance and comfort ↑
- Both Paint interior walls — Enhances curb appeal and interior aesthetics ↑
- Both New kitchen cabinets and fixtures — Modernizes the space and adds value ↑
ⓘ Cost ranges are severity-bucket heuristics (US national rule-of-thumb). Get contractor quotes + a written scope before underwriting a rehab budget.
Schools (NCES district)
- District
- Judson ISD
- NCES district ID
- 4824990
- Math proficiency
- 21% ▼ -21.00%
- Reading proficiency
- 33% ▼ -7.00%
- Median HH income
- $57,542
- Composite
- 24.39/100
- National rank
- #7689
- State rank
- #660 of 826 in TX
Livability — Converse
- Score
- 66/100
- State rank
- #649
- US rank
- #12250
Category grades
Schools grade is shown separately in the Schools card above.
Census & demographics
- Census place
- Converse, TX
- County
- Bexar County · 1,990,555 people
- City population
- 1,806,925
- Metro
- San Antonio-New Braunfels, TX
- Population (ZIP)
- 63,067
- Household income
- $91,320
- Rent vs Own
- Severe rent burden
- 1732.0
Population outlook (Bexar County) Hauer SSP2
- Today (2025)
- 2,336,851 people
- By 2030
- 2,560,728 · +9.6%
- By 2040
- 3,020,569 · +29.3%
- By 2050
- 3,493,522 · +49.5%
- By 2075
- 4,668,459 · +99.8%
- By 2100
- 5,533,242 · +136.8%
Race, ethnicity, and origin ACS 2023
- Neighborhood character
- Diverse neighborhood (Simpson 0.69)
- Race & ethnicity
- Hispanic / Latino 44% White 27% Two or more races 21% Black 21% Asian 3%
- Hispanic origin (detail)
- Mexican 29% Puerto Rican 4%
- Common ancestry
- Lithuanian 1% Romanian 1% Italian 1%
- Foreign-born
- 11% · Canada, Vietnam, South Korea
- Languages at home
- 71% English-only · Spanish 23% Tagalog/Filipino 1% Other Asian/Pacific 1%
Political lean MEDSL · Bexar
- 2024 margin
- Lean D (+9.8) · D 54.3% · R 44.6% · Other 1.1%
- 2008→2024 swing
- +4.2pp toward D · 2008: 5.6pp · 2024: 9.8pp
- All cycles
- 2024: D+9.8 2020: D+18.2 2016: D+13.5 2012: D+4.6 2008: D+5.6
Not yet ingested
- Civics
- —
Market trends
- HPI YoY
- ▼ -51.02%
- Current HPI
- 236.4923
- Rent YoY
- ▼ -1.08%
- Metro
- San Antonio-New Braunfels, TX
- State GDP YoY
- ▲ 3.95%
- F500 in state
- 110
Industry mix (Fortune 500 HQ in TX)
| Industry | F500 HQs | Revenue |
|---|---|---|
| Energy | 16 | $1,198B |
|
||
| Technology | 5 | $198B |
|
||
| Engineering / Construction | 4 | $72B |
|
||
| Energy Services | 3 | $60B |
|
||
| Utilities | 3 | $41B |
|
||
| Healthcare | 2 | $330B |
|
||
Price history
+88.1% since first listed3 events — show timeline
- 2026-06-04 Listed $79,000 FSBO.com
- 2003-09-17 Listing Removed — LERA
- 2003-06-19 Listed $42,000 LERA
Cash-flow waterfall
monthlySold comps — $/sqft
last 12 mo · ≤1 miLoading sold comps…