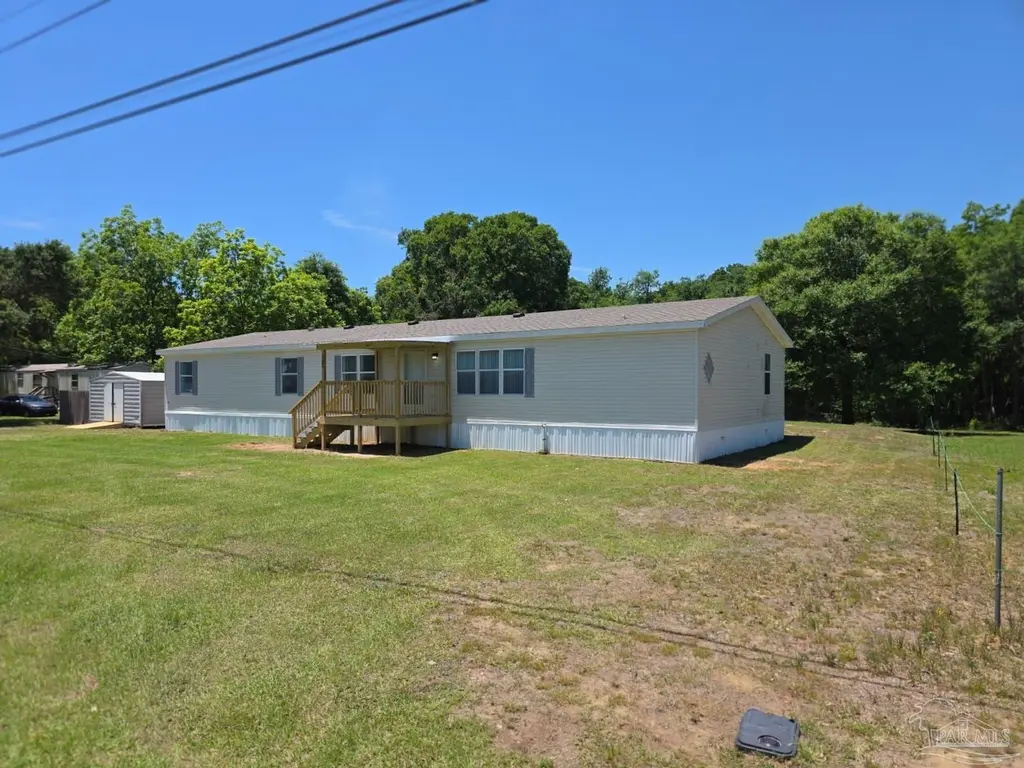
5135 Bent Tree Rd · East Milton, FL
Flood risk 1/10 · Minimal
- FEMA flood zone
- X (unshaded)
- Chance of flooding over 30 yrs
- 0.0%
- Est. flood insurance / yr
- $507 – $1,088
Fire risk 5/10 · Moderate
- Est. fire insurance / yr
- $947 – $1,759
Heat risk 9/10 · Severe
- Hot days now (above 105°F)
- 7 days/yr
- Hot days in 30 yrs
- 21 days/yr
Wind risk 9/10 · Severe
- Chance of severe wind over 30 yrs
- 99.0%
Air-quality risk 2/10 · Minimal
- Unhealthy air days now
- 0 days/yr
- Unhealthy air days in 30 yrs
- 1 days/yr
Risk factors via First Street. Map © Google.
Why this score? — see what drove the B+ grade
The composite is a weighted blend of 9 inputs, each scored 0–100. Each bar is that input's sub-score; the figure is the points it added to the 100-point composite (weight × sub-score).
- Cash flow +30.0/30.0
- ARV discount +15.0/15.0
- DSCR +10.0/10.0
- 1% rule +9.0/10.0
- Schools +5.3/10.0
- Livability +3.9/5.0
- Rent growth +3.6/5.0
- Condition / age +2.5/5.0
- Appreciation +0.0/10.0
$179,900
🖨 Deal sheet 📄 Offer letter ✓ Due diligence
Listing remarks
Update
Key facts
- 1.04 acre lot
- Built 2000
- Listed 33 days
Property features AI
Finance
- HOA & community: No homeowners association
Exterior
- Parking: Driveway; Open parking available
- Utilities: Public water; Septic tank sewer; Circuit breakers and copper wiring for electric
- Home design: One-story frame home; Slab foundation; Shingle roof; Resale property; Public-maintained county road access
- Construction: Frame construction; Built as a single-level home
- Exterior features: Partial fencing; Located on a cul-de-sac
Interior
- Kitchen: Updated kitchen with granite counters
- Bedrooms: Primary bedroom on the first floor (approximately 16 x 17)
- Flooring: Carpet; Laminate
- Bathrooms: 2 full bathrooms; Bathrooms updated within the last year
- Heating & cooling: Central heating; Central air conditioning; Geothermal heat pump (horizontal closed loop)
- Interior features: Living/dining combo; Updated bathrooms; Granite counters
- Laundry & utility: Electric water heater
Neighborhood map
What this means for you Summary
Snapshot
- This is a 4-bed/2.0-bath manufactured listed at $180k.
Deal economics
- At list price, monthly cash flow is $842 ($10k/yr) — positive.
- The deal already cash-flows at list — no discount required.
- Meets the 1% rule at list price ($3k rent vs $180k).
- Recommended offer: $175k (3.0% below list) — sets the bar for market timing.
- Cap rate 11.9% vs local median 4.6% in East Milton — top-decile yield for the area; either an underpriced asset or a hidden risk that comps aren't pricing in. Stress-test before assuming the spread holds.
Location & tenants
- Location reads 77/100 on livability (#199 in FL, #3,139 nationally) — a middle-class / working-renter tenant base. Strengths: cost of living A+, housing A+, health & safety A+; Watch: crime C-, amenities C-, commute F.
- Santa Rosa (suburban): math 63% / reading 60% proficiency, ranked #8 of 73 in FL (top 11%) — acceptable for families but not a draw, mixed tenant base, ~2y average lease.
- Market conditions: Rents rising fast (+4.5%/yr); 806 active listings in the ZIP; 10 comparable units currently listed for rent nearby; rentals at typical pace (median 23d on market — plan ~3-4 weeks tenant-placement turnaround); solid renter incomes; 1,983 units permitted in Santa Rosa County in 2024 (128 in 5+ unit buildings).
- This rent runs 35% of the median local income ($85k/yr) — at the standard rent-burdened threshold; future hikes will face affordability resistance.
Forward outlook
- Local home prices are declining (-3.0%/yr); year-one equity from $1k of loan paydown is wiped out by about $5k of value loss. Plan a longer hold.
- Santa Rosa County population projected at +31% by 2050 — long-run rental-demand tailwind backs the buy-and-hold thesis.
- At projected returns (-3.0% appreciation + 4.5% rent growth), your $50k cash investment doubles in ~6 years — after that, you're playing with house money.
Negotiation context
- It's been on market 33 days — a 3% lower offer ($175k) is reasonable based on typical stale-listing flexibility.
- Current owner paid $85k; list at $180k implies a 111% gain — meaningful room to come down on a strong offer.
Risks & watch-outs
- Climate carrying-cost: severe wind risk, 99% chance of damaging wind over 30y; moderate wildfire risk; extreme-heat days projected 7→21/yr by 2055 (HVAC capex compounding) — expect insurance premiums to compound above CPI over the hold.
Questions for the listing agent
- It's been on market 33 days. Have you received any prior offers? Is the seller open to a 3% concession, seller financing, or rate buy-down credit?
- Is there a deadline driving the sale (1031 exchange, divorce, estate, relocation)? That informs how much negotiation room exists.
- Schools are B-rated — typically a magnet for longer-tenancy family renters. What's the average tenant stay here, and is there a school-zone premium baked into asking?
- What's the average days-on-market for RENTAL listings here right now (not sales)? A rising rental-DOM trend means longer vacancies and softer asking-rent achievability than the comps imply.
- What's the recent tenant-quality profile in this submarket — average credit score on applications, eviction rate, late-payment / NSF rate, and stable-employment percentage? A property-management company in the area should have these aggregated.
- How much new for-sale + rental construction is in the pipeline within 1–3 miles? Heavy new supply typically softens prices + rents 12–24 months out; constrained supply supports both.
Investment metrics
- 1% rule
- 1.40% ✓
- Cap rate
- 11.91%
- Cash-on-cash
- 20.05%
- DSCR
- 1.89
- GRM
- 6.0
CMA / ARV
- ARV (on-the-fly)
- $257,640
- Comps found
- 2
Show comp detail 2 sales within ~0.75 mi
| Address | Dist | Beds/Ba | Sqft | Sold | Price | $/sf | Match |
|---|---|---|---|---|---|---|---|
| 8762 Bailly Rd | 0.64mi | 3/2.0 (-1) | 1,950 (-14%) | 21mo | $220,000 | $113 | 24 |
| 8762 Bailly Rd | 0.75mi | 3/2.0 (-1) | 1,950 (-14%) | 21mo | $220,000 | $113 | 19 |
Match score weights: distance 35% · size 25% · config 20% · recency 20%. Top-matched comps best support the ARV.
Projected returns pro-forma
-3.0% appreciation · 4.53% rent growth · sell at horizon
- IRR
- 13.8%
- Equity multiple
- 1.56×
- Total profit
- $28,361
- Equity at exit
- $26,824
- IRR
- 23.7%
- Equity multiple
- 3.19×
- Total profit
- $110,247
- Equity at exit
- $15,554
Cash invested: $50,372 (down + closing). Projections, not guarantees.
Landlord ↔ Tenant lean methodology
- Overall (STATE)
- 87 Strongly Landlord-Friendly
- State Florida
- 87 Strongly Landlord-Friendly · R+3
- County
- — inherits STATE
- City
- — inherits STATE
ZIP-level market 32583
- Home prices YoY
- -11.3%
- Rents YoY
- 4.5%
- Active inventory
- 806
- Price-to-rent
- 6.0×
Monthly cashflow live
- Estimated rent
- $2,511 high interval (Pro) →
- Mortgage (P&I)
- −$943
- Tax from tax record
- −$124 /mo · $1,483/yr
- Insurance
- −$75
- HOA
- −$0
- Vacancy / Maint / Mgmt
- −$527
- Net cashflow
- $842
Break-even live
UW: 25.0% down · 7.5% · 30yr · 1.5% tax · 5.0% vac · 8.0% maint · 8.0% mgmt
Financing live
Cash to close
- Down payment
- $44,975
- Closing costs
- $5,397
- Reserves months
- —
- Total cash needed
- —
Loan-product check · same deal, 3 products live
Conventional
25% down · 7.5% · 30yr
- Down + closing
- —
- Monthly P&I
- —
- Monthly cashflow
- —
- DSCR
- —
- Eligible?
- —
Personal DTI + credit; lowest rate.
DSCR
20% down · 8.5% · 30yr
- Down + closing
- —
- Monthly P&I
- —
- Monthly cashflow
- —
- DSCR
- —
- Eligible?
- —
No personal income docs; deal must DSCR.
Hard money
10% down · 12.0% · 12mo
- Down + closing
- —
- Monthly P&I
- —
- Monthly cashflow
- —
- DSCR
- —
- Eligible?
- —
Short-term bridge; refi at stabilization.
Rent comps 10 comps
| Address | Beds | Baths | Sqft | Rent | $/sqft | DOM | Units | Dist |
|---|---|---|---|---|---|---|---|---|
| 8617 Tarsus Dr Milton, FL | 4.0 | 2.0 | 1830 | $2,200 | $1.20 | 23d | 1 | 0.90mi |
| 8616 Tarsus Dr Milton, FL | 5.0 | 3.0 | 2554 | $2,995 | $1.17 | 23d | 1 | 0.93mi |
| 8699 Riverstone Rd Milton, FL | 4.0 | 2.0 | 2500 | $2,200 | $0.88 | 23d | 1 | 1.03mi |
| 8795 Florida 87 Fl -87 Milton, FL | 3.0 | 2.0 | 1911 | $5,000 | $2.62 | 23d | 1 | 1.04mi |
| 8057 Fir Tree Dr Milton, FL | 5.0 | 3.0 | 2107 | $2,400 | $1.14 | 23d | 1 | 1.05mi |
| 9330 Tara Cir Milton, FL | 4.0 | 2.0 | 1786 | $2,000 | $1.12 | 13d | 1 | 1.08mi |
| 5533 Silverbell Dr Milton, FL | 5.0 | 3.0 | 2143 | $2,450 | $1.14 | 23d | 1 | 1.15mi |
| 4661 Carl Booker Rd Milton, FL | 4.0 | 2.0 | 1870 | $2,400 | $1.28 | 23d | 1 | 1.18mi |
| 5199 Gaineswood Dr Milton, FL | 3.0 | 2.0 | 2029 | $2,200 | $1.08 | 23d | 1 | 1.21mi |
| 8839 Longmont Way Milton, FL | 4.0 | 3.0 | 2302 | $2,375 | $1.03 | 23d | 1 | 1.34mi |
Listing history 19 events
-
2026-06-18days on market $179,900 Active 33 DOM
-
2026-06-17days on market $179,900 Active 32 DOM
-
2026-06-16days on market $179,900 Active 31 DOM
-
2026-06-15days on market $179,900 Active 30 DOM
-
2026-06-14pricedays on market $179,900 Active 28 DOM
-
2026-06-10days on market $189,900 Active 25 DOM
-
2026-06-09days on market $189,900 Active 24 DOM
-
2026-06-08days on market $189,900 Active 23 DOM
-
2026-06-07pricedays on market $189,900 Active 22 DOM
-
2026-06-05days on market $199,900 Active 19 DOM
-
2026-06-03days on market $199,900 Active 18 DOM
-
2026-06-02days on market $199,900 Active 17 DOM
-
2026-06-01days on market $199,900 Active 16 DOM
-
2026-05-31days on market $199,900 Active 15 DOM
-
2026-05-31days on market $199,900 Active 14 DOM
-
2026-05-19price $199,900
-
2026-05-18price $219,900
-
2026-05-16$229,900 Active
-
2021-05-18soldstatus $85,200
ⓘ Source: listings_history table (triggers on properties + properties_extension) + one-shot
backfill from property_details.listing_events for pre-trigger history.
Tax reassessment forecast FL · Resets to sale price
- Current annual tax
- $1,483 · $124/mo
- Projected year-2 tax
- $1,493 · $124/mo
- Expected delta
- +$10/yr (+$1/mo · 0.7%)
ⓘ Screening estimate from a state-policy table — verify with the county assessor before closing.
Climate risk First Street
- Flood 1/10 Low FEMA zone X (unshaded) · 0% chance over 30 yrs
- Wildfire 5/10 Major
- Heat 9/10 Extreme 7 d/yr ≥105°F today · 21 d/yr by 30 yrs out
- Wind 9/10 Extreme 99% chance of damaging wind over 30 yrs
- Air quality 2/10 Low 0 unhealthy d/yr today · 1 by 30 yrs out
Nearby sold comps map
Loading sold comps map…
Walkable amenities ~0.75 mi
Loading nearby amenities…
Taxation est. · year 1
- Rental income
- $30,132
- − Mortgage interest
- −$10,077
- − Property taxes
- −$1,483
- − Insurance
- −$900
- − Repairs & maintenance
- −$2,411
- − Management
- −$2,411
- − Depreciation
- −$5,233
- Taxable income
- $7,618
- Est. tax owed @ 24.0%
- −$1,828
- After-tax cash flow
- $8,273/yr
For passive investors: Depreciation is non-cash, so a rental often shows a tax loss while cash-flowing — sheltering income. Rental losses are passive: they offset passive income freely, and up to $25,000/yr can offset ordinary (W-2) income if you actively participate and your MAGI is under $100k (phasing out to $0 by $150k); unused losses carry forward. On sale, claimed depreciation is recaptured at up to 25%, and gains may owe capital-gains tax (a 1031 exchange can defer both). Figures are a year-1 estimate at your 24.0% rate — not tax advice; consult a CPA.
Schools (NCES district)
- District
- Santa Rosa
- NCES district ID
- 1201650
- Math proficiency
- 63% ▼ -6.00%
- Reading proficiency
- 60% ▼ -5.00%
- Median HH income
- $58,161
- Composite
- 53.12/100
- National rank
- #1511
- State rank
- #8 of 73 in FL
Livability — East Milton
- Score
- 77/100
- State rank
- #199
- US rank
- #3139
Category grades
Schools grade is shown separately in the Schools card above.
Census & demographics
- Census place
- East Milton, FL
- County
- Santa Rosa County · 194,764 people
- City population
- 31,415
- Metro
- Pensacola-Ferry Pass-Brent, FL
- Population (ZIP)
- 31,828
- Household income
- $85,440
- Rent vs Own
- Severe rent burden
- 122.0
Population outlook (Santa Rosa County) Hauer SSP2
- Today (2025)
- 195,978 people
- By 2030
- 209,782 · +7.0%
- By 2040
- 235,293 · +20.1%
- By 2050
- 256,408 · +30.8%
- By 2075
- 298,074 · +52.1%
- By 2100
- 303,216 · +54.7%
Race, ethnicity, and origin ACS 2023
- Neighborhood character
- Predominantly White (74%)
- Race & ethnicity
- White 74% Black 11% Two or more races 10% Hispanic / Latino 6% Asian 1%
- Hispanic origin (detail)
- Mexican 3% Puerto Rican 2% Cuban 1%
- Common ancestry
- Italian 3% Slovak 2% Serbian 2%
- Foreign-born
- 3% · Canada
- Languages at home
- 94% English-only · Spanish 3%
Political lean MEDSL · Santa Rosa
- 2024 margin
- Solid R (+51.0) · D 24.1% · R 75.0%
- 2008→2024 swing
- -3.0pp toward R · 2008: -47.9pp · 2024: -51.0pp
- All cycles
- 2024: R+51.0 2020: R+46.5 2016: R+53.5 2012: R+52.6 2008: R+47.9
Not yet ingested
- Civics
- —
Market trends
- HPI YoY
- ▼ -38.35%
- Current HPI
- 301.8819
- Rent YoY
- ▲ 4.53%
- Metro
- Pensacola-Ferry Pass-Brent, FL
- State GDP YoY
- ▲ 3.28%
- F500 in state
- 36
Industry mix (Fortune 500 HQ in FL)
| Industry | F500 HQs | Revenue |
|---|---|---|
| Industrial Technology | 2 | $29B |
|
||
| Insurance | 2 | $17B |
|
||
| Retail | 1 | $60B |
|
||
| Technology Distribution | 1 | $58B |
|
||
| Homebuilding | 1 | $35B |
|
||
| Technology Manufacturing | 1 | $35B |
|
||
Price history
+134.6% since first listed4 events — show timeline
- 2026-05-19 Price Changed $199,900 PARMLS
- 2026-05-18 Price Changed $219,900 PARMLS
- 2026-05-16 Listed $229,900 PARMLS
- 2021-05-18 Sold (Public Records) $85,200 Public Records
Property tax history
+46.4%/yrLatest (2025): $1,483 · +10.1% YoY. Source: county tax records.
Cash-flow waterfall
monthlySold comps — $/sqft
last 12 mo · ≤1 miLoading sold comps…