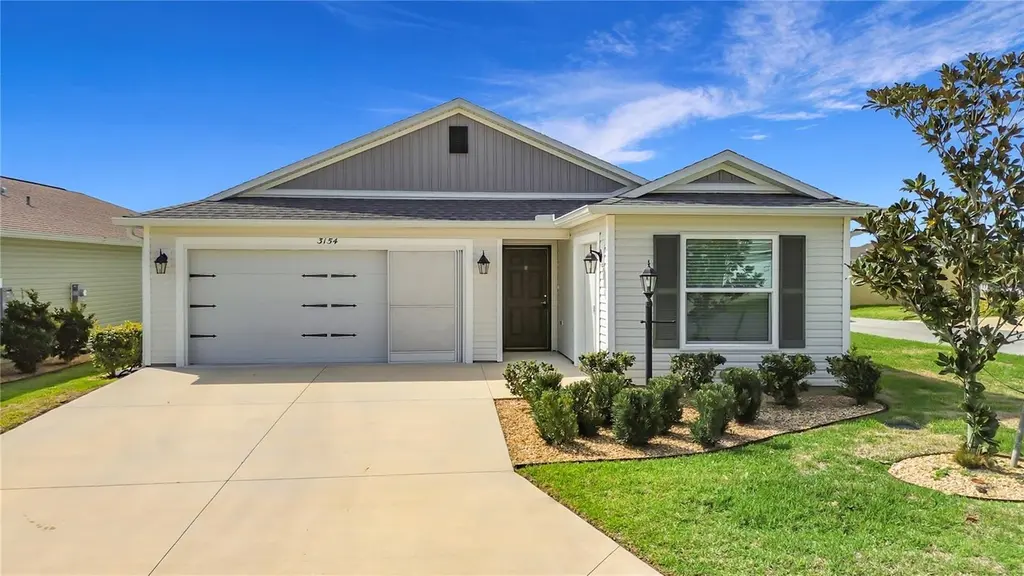
3154 Mack St · Wildwood, FL
Flood risk 3/10 · Minor
- FEMA flood zone
- X (unshaded)
- Chance of flooding over 30 yrs
- 0.2%
- Est. flood insurance / yr
- $507 – $1,088
Fire risk 5/10 · Moderate
- Est. fire insurance / yr
- $947 – $1,759
Heat risk 8/10 · Major
- Hot days now (above 108°F)
- 7 days/yr
- Hot days in 30 yrs
- 20 days/yr
Wind risk 9/10 · Severe
- Chance of severe wind over 30 yrs
- 99.0%
Air-quality risk 2/10 · Minimal
- Unhealthy air days now
- 1 days/yr
- Unhealthy air days in 30 yrs
- 2 days/yr
Risk factors via First Street. Map © Google.
Why this score? — see what drove the D+ grade
The composite is a weighted blend of 9 inputs, each scored 0–100. Each bar is that input's sub-score; the figure is the points it added to the 100-point composite (weight × sub-score).
- Cash flow +10.8/30.0
- Appreciation +10.0/10.0
- ARV discount +6.7/15.0
- Schools +5.2/10.0
- Livability +3.5/5.0
- DSCR +3.1/10.0
- 1% rule +2.6/10.0
- Rent growth +2.5/5.0
- Condition / age +2.5/5.0
$350,000
🖨 Deal sheet 📄 Offer letter ✓ Due diligence
Listing remarks
Welcome to this magnificent corner property in the Village of DeLuna. This beautiful 3-bedroom, 2-bath Emerald IV villa, complete with a golf cart garage, is only 4 years old and offers both style and easy living. The rear privacy wall adds a wonderful sense of seclusion, while the stone landscaping beds provide attractive, low-maintenance outdoor appeal. Step inside to an open, bright, and cheerful living space featuring vaulted ceilings and luxury vinyl flooring throughout. The kitchen is designed to impress with stainless steel appliances, white shaker cabinets, and a large island that is perfect for entertaining, meal prep, or casual dining. The spacious primary bedroom includes a walk-
Key facts
- Golf cart garage
- Rear privacy wall
- Vaulted ceilings
Tags
Property features AI
Finance
- Other: Unfurnished; No lease restrictions indicated
- HOA & community: CDD present; Senior community
Exterior
- Parking: Attached garage; 2-car garage
- Utilities: Public sewer; Water connected; Cable connected; Electricity connected; Natural gas connected; Underground utilities
- Home design: Single family residence; Residential property; One story; Faces east
- Construction: Vinyl siding with frame construction; Shingle roof; Slab foundation; Built on lot of approximately 0.11 acres
- Exterior features: Sliding doors; Paved road access; Irrigation equipment; Street lights in community
Interior
- Kitchen: Dishwasher; Disposal; Microwave; Range; Refrigerator; Gas water heater
- Bedrooms: 3 bedrooms
- Bathrooms: 2 full bathrooms
- Heating & cooling: Electric heating; Natural gas heating; Central air conditioning
- Interior features: Ceiling fans; High ceilings; Open floorplan; Living room/dining room combo; Solid surface counters; Walk-in closet(s)
- Laundry & utility: Washer; Dryer; Gas dryer hookup; Laundry located in garage
Neighborhood map
What this means for you Summary
Snapshot
- This is a 3-bed/2.0-bath single-family listed at $350k.
Deal economics
- At list price, monthly cash flow is $-158 ($-2k/yr) — negative.
- To cash-flow at today's rent, offer at most $322k (8.0% below list).
- To meet the 1% rule (rent ≥ 1% of price), the offer needs to be $267k (23.7% below list).
- Recommended offer: $267k (23.7% below list) — sets the bar for 1% rule.
- Cap rate 5.8% vs local median 3.9% in Wildwood — top-decile yield for the area; either an underpriced asset or a hidden risk that comps aren't pricing in. Stress-test before assuming the spread holds.
Location & tenants
- Location reads 69/100 on livability (#471 in FL) — a middle-class / working-renter tenant base. Strengths: health & safety A+, cost of living A, crime A-; Watch: schools C-, amenities F, commute F.
- Sumter (rural): math 61% / reading 61% proficiency, ranked #11 of 73 in FL (top 15%) — acceptable for families but not a draw, mixed tenant base, ~2y average lease.
- Market conditions: 265 active listings in the ZIP; 6 comparable units currently listed for rent nearby; rentals at typical pace (median 21d on market — plan ~3-4 weeks tenant-placement turnaround); solid renter incomes; 3,961 units permitted in Sumter County in 2024 (248 in 5+ unit buildings).
- This rent runs 33% of the median local income ($97k/yr) — at the standard rent-burdened threshold; future hikes will face affordability resistance.
Forward outlook
- In year one you build about $37k of equity ($2k loan paydown + $35k appreciation (10.0% local appreciation)).
- Sumter County population projected at +45% by 2050 — long-run rental-demand tailwind backs the buy-and-hold thesis.
- By year 2, paydown + projected appreciation supports a ~$60k cash-out refi (75% LTV) — recoverable capital for the next deal without selling this one.
Negotiation context
- It's been on market 75 days — a 6% lower offer ($329k) is reasonable based on typical stale-listing flexibility.
Risks & watch-outs
- Climate carrying-cost: severe wind risk, 99% chance of damaging wind over 30y; moderate wildfire risk; extreme-heat days projected 7→20/yr by 2055 (HVAC capex compounding) — expect insurance premiums to compound above CPI over the hold.
Questions for the listing agent
- What do current leases actually rent for vs. the listed asking? Can we see a recent rent roll and the last 12 months of T-12 income?
- It's been on market 75 days. Have you received any prior offers? Is the seller open to a 24% concession, seller financing, or rate buy-down credit?
- Why hasn't it sold? Are there any deal-killer items the seller is aware of (foundation, flood, title, zoning, code violations)?
- Is there a deadline driving the sale (1031 exchange, divorce, estate, relocation)? That informs how much negotiation room exists.
- The area grade is low — what's the realistic commute time and amenity access for the typical tenant pool here? Any planned neighborhood developments (good or bad) we should know about?
- What's the average days-on-market for RENTAL listings here right now (not sales)? A rising rental-DOM trend means longer vacancies and softer asking-rent achievability than the comps imply.
- What's the recent tenant-quality profile in this submarket — average credit score on applications, eviction rate, late-payment / NSF rate, and stable-employment percentage? A property-management company in the area should have these aggregated.
- How much new for-sale + rental construction is in the pipeline within 1–3 miles? Heavy new supply typically softens prices + rents 12–24 months out; constrained supply supports both.
Investment metrics
- 1% rule
- 0.76% ✗
- Cap rate
- 5.75%
- Cash-on-cash
- -1.93%
- DSCR
- 0.91
- GRM
- 10.9
CMA / ARV
- ARV (on-the-fly)
- $344,160
- Comps found
- 12
Show comp detail 12 sales within ~0.75 mi
| Address | Dist | Beds/Ba | Sqft | Sold | Price | $/sf | Match |
|---|---|---|---|---|---|---|---|
| 4280 Gale Ln | 0.04mi | 3/2.0 | 1,440 (0%) | 1mo | $322,000 | $224 | 98 |
| 4280 Canova Draney Loop | 0.07mi | 3/2.0 | 1,519 (+6%) | 2mo | $340,000 | $224 | 86 |
| 4416 Homan Loop | 0.42mi | 3/2.0 | 1,419 (-2%) | 3mo | $330,000 | $233 | 76 |
| 4371 Shannon Loop | 0.23mi | 3/2.0 | 1,557 (+8%) | 7mo | $390,000 | $250 | 70 |
| 3449 Keith Ln | 0.57mi | 3/2.0 | 1,492 (+4%) | 2mo | $440,000 | $295 | 66 |
| 3359 Brianna Ln | 0.35mi | 3/2.0 | 1,584 (+10%) | 8mo | $400,000 | $253 | 60 |
| 3422 Randi Rd | 0.56mi | 3/2.0 | 1,492 (+4%) | 10mo | $364,500 | $244 | 59 |
| 4429 Homan Loop | 0.42mi | 3/2.0 | 1,569 (+9%) | 16mo | $375,000 | $239 | 52 |
| 4654 Ramsell Rd | 0.70mi | 3/2.0 | 1,472 (+2%) | 15mo | $335,000 | $228 | 51 |
| 4414 Cameo Cir | 0.64mi | 3/2.0 | 1,547 (+7%) | 12mo | $339,000 | $219 | 48 |
| 4451 Elijah Loop | 0.47mi | 2/2.0 (-1) | 1,299 (-10%) | 12mo | $355,000 | $273 | 47 |
| 4694 Monica St | 0.73mi | 3/2.0 | 1,631 (+13%) | 12mo | $345,000 | $212 | 33 |
Match score weights: distance 35% · size 25% · config 20% · recency 20%. Top-matched comps best support the ARV.
Projected returns pro-forma
10.0% appreciation · 3.0% rent growth · sell at horizon
- IRR
- 22.9%
- Equity multiple
- 2.84×
- Total profit
- $180,503
- Equity at exit
- $315,308
- IRR
- 20.4%
- Equity multiple
- 6.50×
- Total profit
- $539,361
- Equity at exit
- $679,973
Cash invested: $98,000 (down + closing). Projections, not guarantees.
Landlord ↔ Tenant lean methodology
- Overall (STATE)
- 87 Strongly Landlord-Friendly
- State Florida
- 87 Strongly Landlord-Friendly · R+3
- County
- — inherits STATE
- City
- — inherits STATE
ZIP-level market 32163
- Home prices YoY
- 9.8%
- Active inventory
- 265
- Price-to-rent
- 10.9×
Monthly cashflow live
- Estimated rent
- $2,670 high interval (Pro) →
- Mortgage (P&I)
- −$1,835
- Tax from tax record
- −$286 /mo · $3,436/yr
- Insurance
- −$146
- HOA
- −$0
- Vacancy / Maint / Mgmt
- −$561
- Net cashflow
- $-158
Break-even live
UW: 25.0% down · 7.5% · 30yr · 1.5% tax · 5.0% vac · 8.0% maint · 8.0% mgmt
Financing live
Cash to close
- Down payment
- $87,500
- Closing costs
- $10,500
- Reserves months
- —
- Total cash needed
- —
Loan-product check · same deal, 3 products live
Conventional
25% down · 7.5% · 30yr
- Down + closing
- —
- Monthly P&I
- —
- Monthly cashflow
- —
- DSCR
- —
- Eligible?
- —
Personal DTI + credit; lowest rate.
DSCR
20% down · 8.5% · 30yr
- Down + closing
- —
- Monthly P&I
- —
- Monthly cashflow
- —
- DSCR
- —
- Eligible?
- —
No personal income docs; deal must DSCR.
Hard money
10% down · 12.0% · 12mo
- Down + closing
- —
- Monthly P&I
- —
- Monthly cashflow
- —
- DSCR
- —
- Eligible?
- —
Short-term bridge; refi at stabilization.
Rent comps 6 comps
| Address | Beds | Baths | Sqft | Rent | $/sqft | DOM | Units | Dist |
|---|---|---|---|---|---|---|---|---|
| 3359 Brianna Ln The Villages, FL | 3.0 | 2.0 | 1584 | $3,100 | $1.96 | 21d | 1 | 0.37mi |
| 3412 Melissa Ln The Villages, FL | 2.0 | 2.0 | 1148 | $2,200 | $1.92 | 21d | 1 | 0.54mi |
| 2910 Monument Way The Villages, FL | 2.0 | 2.0 | 1494 | $2,600 | $1.74 | 21d | 1 | 0.55mi |
| 1016 Century Dr Wildwood, FL | 2.0 | 2.0 | 1022 | $1,399 | $1.37 | 21d | 1 | 1.14mi |
| 605 Sunnyside Dr Wildwood, FL | 2.0 | 2.0 | 900 | $1,275 | $1.42 | 21d | 1 | 1.21mi |
| 3480 Kewadin Ave The Villages, FL | 2.0 | 2.0 | 1758 | $2,500 | $1.42 | 21d | 1 | 1.36mi |
Listing history 9 events
-
2026-06-10days on market $350,000 Active 75 DOM
-
2026-06-09days on market $350,000 Active 74 DOM
-
2026-06-08days on market $350,000 Active 73 DOM
-
2026-06-07days on market $350,000 Active 72 DOM
-
2026-06-02days on market $350,000 Active 67 DOM
-
2026-06-01days on market $350,000 Active 66 DOM
-
2026-05-31days on market $350,000 Active 65 DOM
-
2026-05-30days on market $350,000 Active 64 DOM
-
2026-03-27$350,000 Active
ⓘ Source: listings_history table (triggers on properties + properties_extension) + one-shot
backfill from property_details.listing_events for pre-trigger history.
Tax reassessment forecast FL · Resets to sale price
- Current annual tax
- $3,436 · $286/mo
- Projected year-2 tax
- $3,436 · $286/mo
- Expected delta
- $0/yr ($0/mo · -0.0%)
ⓘ Screening estimate from a state-policy table — verify with the county assessor before closing.
Climate risk First Street
- Flood 3/10 Moderate FEMA zone X (unshaded) · 20% chance over 30 yrs
- Wildfire 5/10 Major
- Heat 8/10 Severe 7 d/yr ≥108°F today · 20 d/yr by 30 yrs out
- Wind 9/10 Extreme 99% chance of damaging wind over 30 yrs
- Air quality 2/10 Low 1 unhealthy d/yr today · 2 by 30 yrs out
Nearby sold comps map
Loading sold comps map…
Walkable amenities ~0.75 mi
Loading nearby amenities…
Taxation est. · year 1
- Rental income
- $32,044
- − Mortgage interest
- −$19,605
- − Property taxes
- −$3,436
- − Insurance
- −$1,750
- − Repairs & maintenance
- −$2,564
- − Management
- −$2,564
- − Depreciation
- −$10,182
- Taxable loss
- −$8,056
- Est. tax savings @ 24.0%
- +$1,933
- After-tax cash flow
- $37/yr
For passive investors: Depreciation is non-cash, so a rental often shows a tax loss while cash-flowing — sheltering income. Rental losses are passive: they offset passive income freely, and up to $25,000/yr can offset ordinary (W-2) income if you actively participate and your MAGI is under $100k (phasing out to $0 by $150k); unused losses carry forward. On sale, claimed depreciation is recaptured at up to 25%, and gains may owe capital-gains tax (a 1031 exchange can defer both). Figures are a year-1 estimate at your 24.0% rate — not tax advice; consult a CPA.
Schools (NCES district)
- District
- Sumter
- NCES district ID
- 1201800
- Math proficiency
- 61% ▼ -4.00%
- Reading proficiency
- 61% ▼ -2.00%
- Median HH income
- $48,240
- Composite
- 51.74/100
- National rank
- #1682
- State rank
- #11 of 73 in FL
Livability — Wildwood
- Score
- 69/100
- State rank
- #471
- US rank
- #8500
Category grades
Schools grade is shown separately in the Schools card above.
Census & demographics
- Census place
- Wildwood, FL
- County
- Sumter County · 110,591 people
- City population
- 12,196
- Metro
- The Villages, FL
- Population (ZIP)
- 28,549
- Household income
- $96,775
- Rent vs Own
- Severe rent burden
- 307.0
Population outlook (Sumter County) Hauer SSP2
- Today (2025)
- 161,172 people
- By 2030
- 180,083 · +11.7%
- By 2040
- 209,892 · +30.2%
- By 2050
- 234,186 · +45.3%
- By 2075
- 284,602 · +76.6%
- By 2100
- 317,039 · +96.7%
Race, ethnicity, and origin ACS 2023
- Neighborhood character
- Predominantly White (95%)
- Race & ethnicity
- White 95% Two or more races 2% Hispanic / Latino 2% Asian 1%
- Common ancestry
- Romanian 6% Lithuanian 3% Iranian 3%
- Foreign-born
- 6% · Canada, Vietnam
- Languages at home
- 96% English-only · Spanish 2% Vietnamese 1% Other Indo-European 0%
Political lean MEDSL · Sumter
- 2024 margin
- Solid R (+37.6) · D 30.9% · R 68.6%
- 2008→2024 swing
- -10.6pp toward R · 2008: -27.0pp · 2024: -37.6pp
- All cycles
- 2024: R+37.6 2020: R+36.1 2016: R+39.2 2012: R+34.9 2008: R+27.0
Not yet ingested
- Civics
- —
Market trends
- HPI YoY
- ▲ 20.47%
- Current HPI
- 229.0075
- Rent YoY
- —
- Metro
- The Villages, FL
- State GDP YoY
- ▲ 3.28%
- F500 in state
- 36
Industry mix (Fortune 500 HQ in FL)
| Industry | F500 HQs | Revenue |
|---|---|---|
| Industrial Technology | 2 | $29B |
|
||
| Insurance | 2 | $17B |
|
||
| Retail | 1 | $60B |
|
||
| Technology Distribution | 1 | $58B |
|
||
| Homebuilding | 1 | $35B |
|
||
| Technology Manufacturing | 1 | $35B |
|
||
Price history
1 event — show timeline
- 2026-03-27 Listed $350,000 Stellar MLS as Distributed by MLS Grid
Property tax history
+120.3%/yrLatest (2025): $3,436 · +1.7% YoY. Source: county tax records.
Cash-flow waterfall
monthlySold comps — $/sqft
last 12 mo · ≤1 miLoading sold comps…