 Multi-family
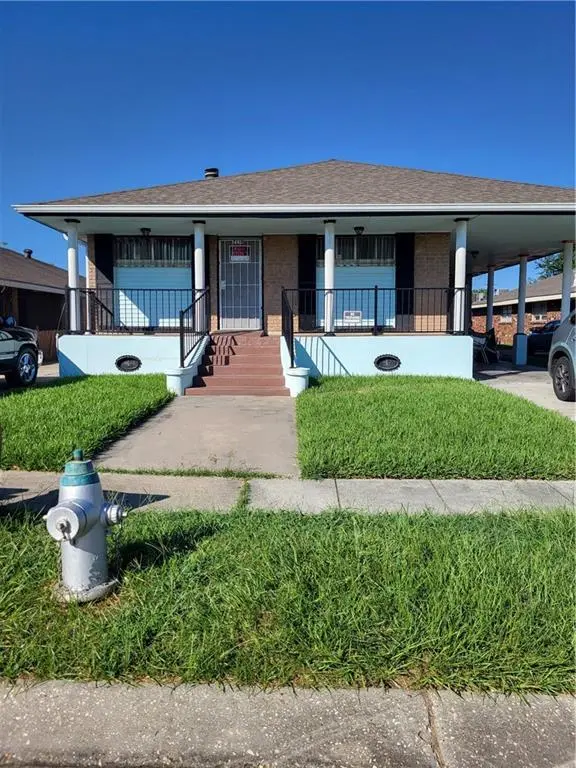
7110 Bunker Hill Rd · New Orleans, LA
Flood risk 8/10 · Major
- FEMA flood zone
- X (shaded)
- Chance of flooding over 30 yrs
- 0.6%
- Est. flood insurance / yr
- $507 – $1,088
Fire risk 1/10 · Minimal
- Est. fire insurance / yr
- $1,269 – $2,357
Heat risk 10/10 · Severe
- Hot days now (above 107°F)
- 7 days/yr
- Hot days in 30 yrs
- 21 days/yr
Wind risk 10/10 · Severe
- Chance of severe wind over 30 yrs
- 99.0%
Air-quality risk 3/10 · Minor
- Unhealthy air days now
- 3 days/yr
- Unhealthy air days in 30 yrs
- 3 days/yr
Risk factors via First Street. Map © Google.
Why this score? — see what drove the C+ grade
The composite is a weighted blend of 9 inputs, each scored 0–100. Each bar is that input's sub-score; the figure is the points it added to the 100-point composite (weight × sub-score).
- Cash flow +30.0/30.0
- DSCR +10.0/10.0
- 1% rule +7.8/10.0
- ARV discount +4.4/15.0
- Livability +4.0/5.0
- Rent growth +2.5/5.0
- Condition / age +2.5/5.0
- Schools +1.6/10.0
- Appreciation +0.0/10.0
$225,000
🖨 Deal sheet 📄 Offer letter ✓ Due diligence
Multi-family units
County records classify this as Multi-Family (2-4 Unit). Listing-text estimate: 1 unit. estimate disagrees with records
Listing remarks MLS
Spacious income producing double in the heart of New Orleans featuring 5 bedrooms and 3 bedrooms across approximately 2775 living square ft. This well maintained property offers generous living space, functional layouts and strong investment potential. Great for owner-occupants or investors seeking rental income opportunities. Property is in good condition with ample space for multi-generational living or long term tenants.
Key facts
- 7,156 sq ft lot
- 2 parking spots
- Built 1986
Property features AI
Exterior
- Parking: Carport with two spaces
- Utilities: Public water; Public sewer
- Home design: Single-story; Entry on main level
- Construction: Brick and vinyl siding exterior; Shingle roof; Slab foundation; Built in recent decades (year not provided)
- Exterior features: City lot; Rectangular lot
Interior
- Bathrooms: 3 full bathrooms
- Heating & cooling: Central heating; Central air conditioning
- Interior features: Two-unit property; Very good condition
Neighborhood map
What this means for you Summary
Snapshot
- This is a 6-bed/2.0-bath multifamily listed at $225k.
Deal economics
- At list price, monthly cash flow is $891 ($11k/yr) — positive.
- The deal already cash-flows at list — no discount required.
- Meets the 1% rule at list price ($3k rent vs $225k).
- Recommended offer: $218k (3.0% below list) — sets the bar for market timing.
- Cap rate 11.4% vs local median 4.4% in New Orleans — top-decile yield for the area; either an underpriced asset or a hidden risk that comps aren't pricing in. Stress-test before assuming the spread holds.
Location & tenants
- Location reads 81/100 on livability (#3 in LA, #1,383 nationally) — a professional / high-income tenant draw. Strengths: amenities A+, commute A+, health & safety A+; Watch: crime C-, employment D.
- Orleans Parish (urban): math 11% / reading 27% proficiency, ranked #69 of 98 in LA (top 70%) — low school quality limits family demand, transient renter base, plan for 1-2y turnover; 68% free/reduced lunch — lower-income household profile, screen leases tightly.
- Market conditions: 128 active listings in the ZIP; lower-income renter base — watch delinquency; 710 units permitted in Orleans Parish in 2024 (244 in 5+ unit buildings).
- At $2,875/mo this rent would consume 85% of the median local household income ($41k/yr) (locally 2030% of renters already pay >50% of income on rent) — very limited rent-growth headroom before tenants either downsize or default.
Forward outlook
- Local home prices are declining (-3.0%/yr); year-one equity from $2k of loan paydown is wiped out by about $7k of value loss. Plan a longer hold.
- Orleans County population projected at +61% by 2050 — long-run rental-demand tailwind backs the buy-and-hold thesis.
- At projected returns (-3.0% appreciation + 3.0% rent growth), your $63k cash investment doubles in ~8 years — after that, you're playing with house money.
Negotiation context
- It's been on market 36 days — a 3% lower offer ($218k) is reasonable based on typical stale-listing flexibility.
- 4 sale attempts since 28y ago with the ask held roughly flat each time — persistent listings suggest the price (not the market) is what's stuck; bring a comps-based counter.
- Current owner paid $70k; list at $225k implies a 224% gain — meaningful room to come down on a strong offer.
Risks & watch-outs
- Watch-outs: flood insurance adds $66/mo.
- Climate carrying-cost: severe flood risk; severe wind risk, 99% chance of damaging wind over 30y; extreme-heat days projected 7→21/yr by 2055 (HVAC capex compounding) — expect insurance premiums to compound above CPI over the hold.
Questions for the listing agent
- It's been on market 36 days. Have you received any prior offers? Is the seller open to a 3% concession, seller financing, or rate buy-down credit?
- What's the actual annual flood-insurance premium (NFIP or private), and is the property in a SFHA with mandatory coverage?
- Is there a deadline driving the sale (1031 exchange, divorce, estate, relocation)? That informs how much negotiation room exists.
- What's the average days-on-market for RENTAL listings here right now (not sales)? A rising rental-DOM trend means longer vacancies and softer asking-rent achievability than the comps imply.
- What's the recent tenant-quality profile in this submarket — average credit score on applications, eviction rate, late-payment / NSF rate, and stable-employment percentage? A property-management company in the area should have these aggregated.
- How much new apartment / multifamily construction is in the pipeline within 1–3 miles? Heavy new supply (>2% of stock underway) typically softens rents 12–24 months out; light construction supports rent growth.
Investment metrics
- 1% rule
- 1.28% ✓
- Cap rate
- 11.40%
- Cash-on-cash
- 18.23%
- DSCR
- 1.81
- GRM
- 6.5
CMA / ARV
- ARV (median comp)
- $210,588
- List price
- $225,000
- Delta
- 6.84%
- Verdict
- FAIR
- Comps
- 20 within 1.0 mi
Show comp detail 11 sales within ~0.75 mi
| Address | Dist | Beds/Ba | Sqft | Sold | Price | $/sf | Match |
|---|---|---|---|---|---|---|---|
| 7001-7003 Yorktown Dr | 0.12mi | 6/3.0 | 2,706 (-2%) | 1mo | $183,500 | $68 | 86 |
| 7160 Bunker Hill Rd | 0.05mi | 5/3.0 (-1) | 2,718 (-2%) | 7mo | $190,000 | $70 | 79 |
| 7131 Yorktown Dr | 0.10mi | 5/3.0 (-1) | 2,814 (+1%) | 7mo | $179,000 | $64 | 78 |
| 7120 22 Bunker Hill Rd | 0.01mi | 5/3.0 (-1) | 2,450 (-12%) | 6mo | $212,500 | $87 | 66 |
| 7140 42 Boston Dr | 0.12mi | 5/3.0 (-1) | 2,648 (-5%) | 14mo | $225,000 | $85 | 66 |
| 9040 42 Bunker Hill Rd | 0.25mi | 6/3.0 | 2,790 (+0%) | 23mo | $179,250 | $64 | 64 |
| 7100 02 Bunker Hill Rd | 0.01mi | 5/3.0 (-1) | 2,450 (-12%) | 8mo | $225,000 | $92 | 64 |
| 7143 Boston Dr | 0.15mi | 5/3.0 (-1) | 2,648 (-5%) | 20mo | $208,000 | $79 | 59 |
| 9110 Morrison Rd | 0.28mi | 6/4.0 | 2,528 (-9%) | 13mo | $230,000 | $91 | 53 |
| 8007 Brevard St | 0.72mi | 6/4.0 | 3,000 (+8%) | 10mo | $232,000 | $77 | 37 |
| 8921 23 Gervais St | 0.51mi | 5/3.0 (-1) | 2,373 (-14%) | 14mo | $194,000 | $82 | 31 |
Match score weights: distance 35% · size 25% · config 20% · recency 20%. Top-matched comps best support the ARV.
Projected returns pro-forma
-3.0% appreciation · 3.0% rent growth · sell at horizon
- IRR
- 8.2%
- Equity multiple
- 1.32×
- Total profit
- $20,196
- Equity at exit
- $33,548
- IRR
- 17.4%
- Equity multiple
- 2.43×
- Total profit
- $90,364
- Equity at exit
- $19,454
Cash invested: $63,000 (down + closing). Projections, not guarantees.
Landlord ↔ Tenant lean methodology
- Overall (STATE)
- 90 Strongly Landlord-Friendly
- State Louisiana
- 90 Strongly Landlord-Friendly · R+12
- County
- — inherits STATE
- City
- — inherits STATE
ZIP-level market 70127
- Home prices YoY
- -29.2%
- Active inventory
- 128
- Price-to-rent
- 13.6×
Monthly cashflow live
- Estimated rent
- $2,875 high interval (Pro) →
- Mortgage (P&I)
- −$1,180
- Tax from tax record
- −$41 /mo · $487/yr
- Insurance
- −$94
- Flood insurance flood zone
- −$66 /mo · $798/yr
- HOA
- −$0
- Vacancy / Maint / Mgmt
- −$604
- Net cashflow
- $891
Break-even live
2-unit breakdown (identical units grouped — click to expand)
| Units | Beds | Baths | Est. rent |
|---|---|---|---|
| 1× unit | 2 | 1 | $1,376 |
| 1× unit | 3 | 2 | $1,498 |
| Total (2 units) | $2,875 | ||
UW: 25.0% down · 7.5% · 30yr · 1.5% tax · 5.0% vac · 8.0% maint · 8.0% mgmt
Financing live
Cash to close
- Down payment
- $56,250
- Closing costs
- $6,750
- Reserves months
- —
- Total cash needed
- —
Loan-product check · same deal, 3 products live
Conventional
25% down · 7.5% · 30yr
- Down + closing
- —
- Monthly P&I
- —
- Monthly cashflow
- —
- DSCR
- —
- Eligible?
- —
Personal DTI + credit; lowest rate.
DSCR
20% down · 8.5% · 30yr
- Down + closing
- —
- Monthly P&I
- —
- Monthly cashflow
- —
- DSCR
- —
- Eligible?
- —
No personal income docs; deal must DSCR.
Hard money
10% down · 12.0% · 12mo
- Down + closing
- —
- Monthly P&I
- —
- Monthly cashflow
- —
- DSCR
- —
- Eligible?
- —
Short-term bridge; refi at stabilization.
Listing history 22 events
-
2026-06-18days on market $225,000 Active 36 DOM
-
2026-06-17days on market $225,000 Active 35 DOM
-
2026-06-16days on market $225,000 Active 34 DOM
-
2026-06-15days on market $225,000 Active 33 DOM
-
2026-06-13days on market $225,000 Active 31 DOM
-
2026-06-10days on market $225,000 Active 28 DOM
-
2026-06-09days on market $225,000 Active 27 DOM
-
2026-06-08days on market $225,000 Active 26 DOM
-
2026-06-07days on market $225,000 Active 25 DOM
-
2026-06-05days on market $225,000 Active 22 DOM
-
2026-06-03days on market $225,000 Active 21 DOM
-
2026-06-02days on market $225,000 Active 20 DOM
-
2026-06-01days on market $225,000 Active 19 DOM
-
2026-05-31days on market $225,000 Active 18 DOM
-
2026-05-13historical $1,350
-
2026-05-12$225,000 Active 427-char remark
Show marketing remark (427 chars)
Spacious income producing double in the heart of New Orleans featuring 5 bedrooms and 3 bedrooms across approximately 2775 living square ft. This well maintained property offers generous living space, functional layouts and strong investment potential. Great for owner-occupants or investors seeking rental income opportunities. Property is in good condition with ample space for multi-generational living or long term tenants.
-
2025-09-09$1,350
-
1998-06-26soldstatus $69,500
-
1998-06-26soldstatus $69,500
-
1998-02-23$69,500
-
1994-10-04soldstatus $70,000
ⓘ Source: listings_history table (triggers on properties + properties_extension) + one-shot
backfill from property_details.listing_events for pre-trigger history.
Tax reassessment forecast LA · Resets to sale price
- Current annual tax
- $487 · $41/mo
- Projected year-2 tax
- $1,238 · $103/mo
- Expected delta
- +$751/yr (+$63/mo · 154.2%)
ⓘ Screening estimate from a state-policy table — verify with the county assessor before closing.
Climate risk First Street
- Flood 8/10 Severe FEMA zone X (shaded) · 60% chance over 30 yrs
- Wildfire 1/10 Low
- Heat 10/10 Extreme 7 d/yr ≥107°F today · 21 d/yr by 30 yrs out
- Wind 10/10 Extreme 99% chance of damaging wind over 30 yrs
- Air quality 3/10 Moderate 3 unhealthy d/yr today · 3 by 30 yrs out
Nearby sold comps map
Loading sold comps map…
Walkable amenities ~0.75 mi
Loading nearby amenities…
Taxation est. · year 1
- Rental income
- $34,500
- − Mortgage interest
- −$12,603
- − Property taxes
- −$487
- − Insurance
- −$1,922
- − Repairs & maintenance
- −$2,760
- − Management
- −$2,760
- − Depreciation
- −$6,545
- Taxable income
- $7,422
- Est. tax owed @ 24.0%
- −$1,781
- After-tax cash flow
- $8,905/yr
For passive investors: Depreciation is non-cash, so a rental often shows a tax loss while cash-flowing — sheltering income. Rental losses are passive: they offset passive income freely, and up to $25,000/yr can offset ordinary (W-2) income if you actively participate and your MAGI is under $100k (phasing out to $0 by $150k); unused losses carry forward. On sale, claimed depreciation is recaptured at up to 25%, and gains may owe capital-gains tax (a 1031 exchange can defer both). Figures are a year-1 estimate at your 24.0% rate — not tax advice; consult a CPA.
Schools (NCES district)
- District
- Orleans Parish
- NCES district ID
- 2201170
- Math proficiency
- 11% ▼ -52.00%
- Reading proficiency
- 27% ▼ -46.00%
- Median HH income
- $37,011
- Composite
- 15.78/100
- National rank
- #9271
- State rank
- #69 of 98 in LA
Livability — New Orleans
- Score
- 81/100
- State rank
- #3
- US rank
- #1383
Category grades
Schools grade is shown separately in the Schools card above.
Census & demographics
- Census place
- New Orleans, LA
- County
- Orleans Parish · 338,817 people
- City population
- 338,817
- Metro
- New Orleans-Metairie, LA
- Population (ZIP)
- 23,107
- Household income
- $40,765
- Rent vs Own
- Severe rent burden
- 2030.0
Population outlook (Orleans County) Hauer SSP2
- Today (2025)
- 513,025 people
- By 2030
- 575,781 · +12.2%
- By 2040
- 700,174 · +36.5%
- By 2050
- 826,541 · +61.1%
- By 2075
- 1,123,374 · +119.0%
- By 2100
- 1,355,609 · +164.2%
Race, ethnicity, and origin ACS 2023
- Neighborhood character
- Predominantly Black (91%)
- Race & ethnicity
- Black 91% Hispanic / Latino 4% Two or more races 4% White 2%
- Common ancestry
- Lithuanian 1% Hispanic 1%
- Foreign-born
- 3% · Canada, Vietnam
- Languages at home
- 96% English-only · Spanish 2%
Political lean MEDSL · Orleans
- 2024 margin
- Solid D (+67.0) · D 82.2% · R 15.2% · Other 2.7%
- 2008→2024 swing
- +6.7pp toward D · 2008: 60.3pp · 2024: 67.0pp
- All cycles
- 2024: D+67.0 2020: D+68.2 2016: D+66.2 2012: D+62.5 2008: D+60.3
Not yet ingested
- Civics
- —
Market trends
- HPI YoY
- ▼ -72.43%
- Current HPI
- 175.4465
- Rent YoY
- —
- Metro
- New Orleans-Metairie, LA
- State GDP YoY
- ▲ 3.29%
- F500 in state
- 10
Industry mix (Fortune 500 HQ in LA)
| Industry | F500 HQs | Revenue |
|---|---|---|
| Telecommunications | 2 | $23B |
|
||
| Utilities | 1 | $12B |
|
||
| Wholesale / Distribution | 1 | $5B |
|
||
| Advertising | 1 | $2B |
|
||
Price history
-98.1% since first listed8 events — show timeline
- 2026-05-13 Rental Removed $1,350 GSREIN
- 2026-05-12 Listed $225,000 AcadianaMLS
- 2026-05-12 Listed $225,000 GSREIN
- 2025-09-09 Listed for Rent $1,350 GSREIN
- 1998-06-26 Sold (Public Records) $69,500 Public Records
- 1998-06-26 Sold (MLS) $69,500 GSREIN
- 1998-02-23 Listed $69,500 GSREIN
- 1994-10-04 Sold (Public Records) $70,000 Public Records
Property tax history
-0.6%/yrLatest (2026): $487 · +2.0% YoY. Source: county tax records.
Cash-flow waterfall
monthlySold comps — $/sqft
last 12 mo · ≤1 miLoading sold comps…