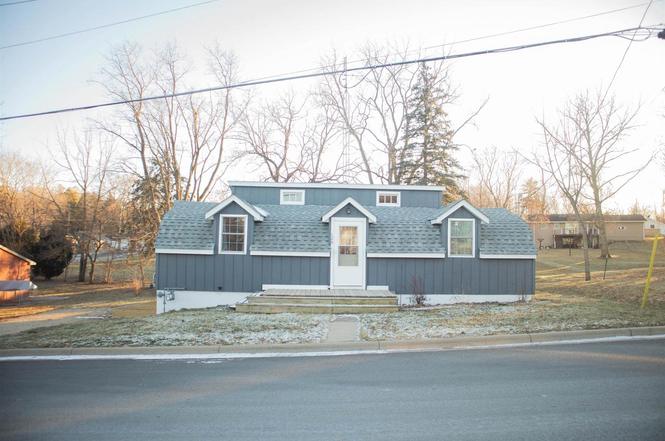
128 W Estey St · Shullsburg, WI
Flood risk 1/10 · Minimal
- FEMA flood zone
- X (unshaded)
- Chance of flooding over 30 yrs
- 0.0%
- Est. flood insurance / yr
- $473 – $860
Fire risk 1/10 · Minimal
- Est. fire insurance / yr
- $636 – $1,182
Heat risk 2/10 · Minimal
- Hot days now (above 99°F)
- 7 days/yr
- Hot days in 30 yrs
- 15 days/yr
Wind risk 2/10 · Minimal
- Chance of severe wind over 30 yrs
- —
Air-quality risk 2/10 · Minimal
- Unhealthy air days now
- 1 days/yr
- Unhealthy air days in 30 yrs
- 2 days/yr
Risk factors via First Street. Map © Google.
Why this score? — see what drove the C grade
The composite is a weighted blend of 9 inputs, each scored 0–100. Each bar is that input's sub-score; the figure is the points it added to the 100-point composite (weight × sub-score).
- Cash flow +17.6/30.0
- Appreciation +10.0/10.0
- ARV discount +7.5/15.0
- DSCR +5.5/10.0
- 1% rule +4.3/10.0
- Livability +3.8/5.0
- Schools +3.7/10.0
- Rent growth +2.5/5.0
- Condition / age +2.5/5.0
$130,000
🖨 Deal sheet 📄 Offer letter ✓ Due diligence
Listing remarks
Charming and remodeled, this 2-bedroom, 1-bath home in Shullsburg, WI offers the perfect blend of character and modern updates. A distinctive exterior sets it apart, while the thoughtfully updated interior provides comfortable, stylish living. Nestled in a quaint neighborhood, this home is beautifully refreshed and move-in ready for its next owner.
Key facts
- Move-in ready
- Distinctive exterior
- 6,098 sq ft lot
Tags
Neighborhood map
What this means for you Summary
Snapshot
- This is a 2-bed/1.0-bath other listed at $130k.
Deal economics
- At list price, monthly cash flow is $102 ($1k/yr) — positive.
- The deal already cash-flows at list — no discount required.
- To meet the 1% rule (rent ≥ 1% of price), the offer needs to be $120k (7.4% below list).
- Recommended offer: $120k (7.4% below list) — sets the bar for 1% rule.
Location & tenants
- Location reads 76/100 on livability (#138 in WI, #3,666 nationally) — a middle-class / working-renter tenant base. Strengths: crime A+, cost of living A+, housing A+; Watch: employment C-, amenities D, commute F.
- Shullsburg School District (rural): math 40% / reading 40% proficiency, ranked #253 of 426 in WI (top 59%) — families likely to look elsewhere, expect single-tenant / working-renter base with shorter leases.
- Zoned schools: Shullsburg Elementary (math 47% / reading 32%, grade F, #490 of 1,041 statewide, top 53%, 133 students, 53% FRL); Shullsburg High (math 30% / reading 50%, grade F, #95 of 483 statewide, top 20%, 103 students, 43% FRL).
- Market conditions: 9 active listings in the ZIP; 67 units permitted in Lafayette County in 2024 (0 in 5+ unit buildings).
Forward outlook
- In year one you build about $14k of equity ($899 loan paydown + $13k appreciation (10.0% local appreciation)).
- Lafayette County population projected at -16% by 2050 — secular population decline; favor cash flow + early exit over multi-decade hold.
- At projected returns (10.0% appreciation + 3.0% rent growth), your $36k cash investment doubles in ~3 years — after that, you're playing with house money.
- By year 3, paydown + projected appreciation supports a ~$35k cash-out refi (75% LTV) — recoverable capital for the next deal without selling this one.
Negotiation context
- Only 2 days on market — expect competitive offers; lowballing is unlikely to land.
Risks & watch-outs
- Watch-outs: built in 1941 — expect roof / HVAC / electrical / plumbing capex.
Questions for the listing agent
- Built in 1941 — when were the roof, HVAC, electrical panel, plumbing, and water heater last replaced?
- Is there a deadline driving the sale (1031 exchange, divorce, estate, relocation)? That informs how much negotiation room exists.
- What's the average days-on-market for RENTAL listings here right now (not sales)? A rising rental-DOM trend means longer vacancies and softer asking-rent achievability than the comps imply.
- What's the recent tenant-quality profile in this submarket — average credit score on applications, eviction rate, late-payment / NSF rate, and stable-employment percentage? A property-management company in the area should have these aggregated.
- How much new for-sale + rental construction is in the pipeline within 1–3 miles? Heavy new supply typically softens prices + rents 12–24 months out; constrained supply supports both.
Investment metrics
- 1% rule
- 0.93% ✗
- Cap rate
- 7.24%
- Cash-on-cash
- 3.37%
- DSCR
- 1.15
- GRM
- 9.0
CMA / ARV
No comps found within radius.
Projected returns pro-forma
10.0% appreciation · 3.0% rent growth · sell at horizon
- IRR
- 26.7%
- Equity multiple
- 3.12×
- Total profit
- $77,303
- Equity at exit
- $117,114
- IRR
- 23.4%
- Equity multiple
- 7.11×
- Total profit
- $222,497
- Equity at exit
- $252,561
Cash invested: $36,400 (down + closing). Projections, not guarantees.
Landlord ↔ Tenant lean methodology
- Overall (STATE)
- 73 Landlord-Friendly
- State Wisconsin
- 73 Landlord-Friendly · R+2
- County
- — inherits STATE
- City
- — inherits STATE
ZIP-level market 53586
- Home prices YoY
- 9.3%
- Active inventory
- 9
- Price-to-rent
- 9.0×
Monthly cashflow live
- Estimated rent
- $1,204 medium interval (Pro) →
- Mortgage (P&I)
- −$682
- Tax from tax record
- −$113 /mo · $1,351/yr
- Insurance
- −$54
- HOA
- −$0
- Vacancy / Maint / Mgmt
- −$253
- Net cashflow
- $102
Break-even live
UW: 25.0% down · 7.5% · 30yr · 1.5% tax · 5.0% vac · 8.0% maint · 8.0% mgmt
Financing live
Cash to close
- Down payment
- $32,500
- Closing costs
- $3,900
- Reserves months
- —
- Total cash needed
- —
Loan-product check · same deal, 3 products live
Conventional
25% down · 7.5% · 30yr
- Down + closing
- —
- Monthly P&I
- —
- Monthly cashflow
- —
- DSCR
- —
- Eligible?
- —
Personal DTI + credit; lowest rate.
DSCR
20% down · 8.5% · 30yr
- Down + closing
- —
- Monthly P&I
- —
- Monthly cashflow
- —
- DSCR
- —
- Eligible?
- —
No personal income docs; deal must DSCR.
Hard money
10% down · 12.0% · 12mo
- Down + closing
- —
- Monthly P&I
- —
- Monthly cashflow
- —
- DSCR
- —
- Eligible?
- —
Short-term bridge; refi at stabilization.
Listing history 5 events
-
2026-02-25soldstatus $121,000
-
2026-01-30status Pending
-
2026-01-28$130,000 Active
-
2024-10-29soldstatus $107,000
-
2001-10-04soldstatus $18,000
ⓘ Source: listings_history table (triggers on properties + properties_extension) + one-shot
backfill from property_details.listing_events for pre-trigger history.
Tax reassessment forecast WI · Partial reset (capped growth)
- Current annual tax
- $1,351 · $113/mo
- Projected year-2 tax
- $1,878 · $157/mo
- Expected delta
- +$527/yr (+$44/mo · 39.0%)
ⓘ Screening estimate from a state-policy table — verify with the county assessor before closing.
Climate risk First Street
- Flood 1/10 Low FEMA zone X (unshaded) · 0% chance over 30 yrs
- Wildfire 1/10 Low
- Heat 2/10 Low 7 d/yr ≥99°F today · 15 d/yr by 30 yrs out
- Wind 2/10 Low
- Air quality 2/10 Low 1 unhealthy d/yr today · 2 by 30 yrs out
Nearby sold comps map
Loading sold comps map…
Walkable amenities ~0.75 mi
Loading nearby amenities…
Taxation est. · year 1
- Rental income
- $14,442
- − Mortgage interest
- −$7,282
- − Property taxes
- −$1,351
- − Insurance
- −$650
- − Repairs & maintenance
- −$1,155
- − Management
- −$1,155
- − Depreciation
- −$3,782
- Taxable loss
- −$934
- Est. tax savings @ 24.0%
- +$224
- After-tax cash flow
- $1,451/yr
For passive investors: Depreciation is non-cash, so a rental often shows a tax loss while cash-flowing — sheltering income. Rental losses are passive: they offset passive income freely, and up to $25,000/yr can offset ordinary (W-2) income if you actively participate and your MAGI is under $100k (phasing out to $0 by $150k); unused losses carry forward. On sale, claimed depreciation is recaptured at up to 25%, and gains may owe capital-gains tax (a 1031 exchange can defer both). Figures are a year-1 estimate at your 24.0% rate — not tax advice; consult a CPA.
Schools (NCES district)
- District
- Shullsburg School District
- NCES district ID
- 5513830
- Math proficiency
- 40% ▲ 10.00%
- Reading proficiency
- 40% ▬ 0.00%
- Median HH income
- $47,583
- Composite
- 36.69/100
- National rank
- #9225
- State rank
- #253 of 426 in WI
Livability — Shullsburg
- Score
- 76/100
- State rank
- #138
- US rank
- #3666
Category grades
Schools grade is shown separately in the Schools card above.
Census & demographics
- Census place
- Shullsburg, WI
- City population
- 2,336
- Population (ZIP)
- 2,336
Population outlook (Lafayette County) Hauer SSP2
- Today (2025)
- 16,236 people
- By 2030
- 15,817 · -2.6%
- By 2040
- 14,834 · -8.6%
- By 2050
- 13,692 · -15.7%
- By 2075
- 11,220 · -30.9%
- By 2100
- 8,477 · -47.8%
Race, ethnicity, and origin ACS 2023
- Neighborhood character
- Predominantly White (87%)
- Race & ethnicity
- White 87% Hispanic / Latino 11% Two or more races 7%
- Hispanic origin (detail)
- Mexican 11%
- Common ancestry
- Portuguese 3% Lithuanian 3% Italian 1%
- Foreign-born
- 5% · Canada
- Languages at home
- 87% English-only · Spanish 8% German/W. Germanic 3% Other Indo-European 1%
Political lean MEDSL · Lafayette
- 2024 margin
- Strong R (+20.2) · D 39.3% · R 59.5% · Other 1.2%
- 2008→2024 swing
- -42.6pp toward R · 2008: 22.3pp · 2024: -20.2pp
- All cycles
- 2024: R+20.2 2020: R+13.7 2016: R+9.1 2012: D+15.4 2008: D+22.3
Not yet ingested
- Civics
- —
Market trends
- HPI YoY
- ▲ 19.18%
- Current HPI
- 225.0823
- Rent YoY
- —
- Metro
- —
- State GDP YoY
- ▲ 2.10%
- F500 in state
- 20
Industry mix (Fortune 500 HQ in WI)
| Industry | F500 HQs | Revenue |
|---|---|---|
| Industrial Machinery | 4 | $23B |
|
||
| Industrial Technology | 2 | $36B |
|
||
| Insurance | 1 | $36B |
|
||
| Professional Services | 1 | $19B |
|
||
| Utilities | 1 | $9B |
|
||
| Consumer Goods | 1 | $3B |
|
||
Price history
+572.2% since first listed5 events — show timeline
- 2026-02-25 Sold (Public Records) $121,000 Public Records
- 2026-01-30 Pending — SCWMLS
- 2026-01-28 Listed $130,000 SCWMLS
- 2024-10-29 Sold (Public Records) $107,000 Public Records
- 2001-10-04 Sold (Public Records) $18,000 Public Records
Property tax history
+3.5%/yrLatest (2025): $1,351 · +174.2% YoY. Source: county tax records.
Cash-flow waterfall
monthlySold comps — $/sqft
last 12 mo · ≤1 miLoading sold comps…