450 Gladycon Rd #32 · Colfax, CA
Flood risk 1/10 · Minimal
- FEMA flood zone
- X (unshaded)
- Chance of flooding over 30 yrs
- 0.0%
- Est. flood insurance / yr
- $507 – $1,088
Fire risk 8/10 · Major
- Est. fire insurance / yr
- $659 – $1,223
Heat risk 5/10 · Moderate
- Hot days now (above 98°F)
- 7 days/yr
- Hot days in 30 yrs
- 15 days/yr
Wind risk 1/10 · Minimal
- Chance of severe wind over 30 yrs
- —
Air-quality risk 10/10 · Severe
- Unhealthy air days now
- 37 days/yr
- Unhealthy air days in 30 yrs
- 39 days/yr
Risk factors via First Street. Map © Google.
Why this score? — see what drove the D+ grade
The composite is a weighted blend of 9 inputs, each scored 0–100. Each bar is that input's sub-score; the figure is the points it added to the 100-point composite (weight × sub-score).
- Cash flow +24.2/30.0
- DSCR +7.8/10.0
- 1% rule +6.3/10.0
- Livability +3.6/5.0
- Schools +2.6/10.0
- Rent growth +2.5/5.0
- Condition / age +2.5/5.0
- ARV discount +0.0/15.0
- Appreciation +0.0/10.0
$140,000
🖨 Deal sheet 📄 Offer letter ✓ Due diligence
Listing remarks
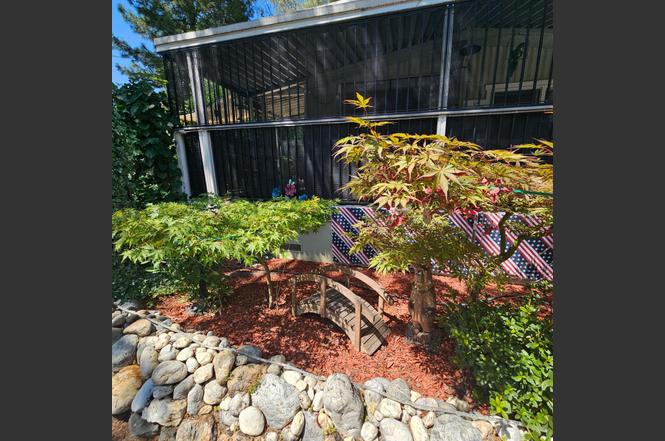
Gardner's Delight! * Nice Corner Lot Bursting with Fruit Trees! * Move in Ready! * 2 bedrooms, 2 baths * Galley Kitchen with Large Garden Window * French Doors lead to Spacious Living Room * Master Suite looks out to the Garden of Eden * Enjoy some Lemonade on the Screened in Porch/Catio! * Twinkle Lights Outside at Night too! * 5,000 kw Back-up Generator Hardwired into Electrical Panel * Wheelchair Access Master Suite and Hallways * Located in the Community of Shady Glen Estates Featuring a Sparkling Pool and Newly Remodeled Clubhouse Complete with Exercise Room * 5 minutes from Rollins Lake and Less than an Hour to Tahoe with all the Recreation they Provide! * This one is a MUST SEE! *
Key facts
- Galley kitchen
- French doors
- Garden window
Tags
Property features AI
Finance
- Other: Located at 450 Gladycon Rd #32, Colfax, CA 95713; Directions: I-80 to Colfax/174 Exit, right on 174 to park entrance on left
- Financial info: Land lease: No (listed land lease amount present but property indicates 'No')
- HOA & community: No homeowners association; Senior community
Exterior
- Parking: Two parking spaces total; Guest parking available; No garage
- Utilities: Private water; Public sewer; Propane available; Individual electric meter; Individual gas meter; Cable available; 220 volts in laundry
- Home design: Manufactured in park (double wide); Updated / remodeled; Built in 1980
- Construction: Metal roof; Wood skirting; Made by Skyline
- Exterior features: Carport awning; Fenced yard; Corner lot landscaping with front, back and garden landscaping; Shed(s)
Interior
- Kitchen: Laminate countertops; Free-standing gas range and oven; Free-standing refrigerator; Dishwasher; Disposal; Hood over range
- Bedrooms: Two bedrooms
- Flooring: Laminate; Linoleum; Vinyl
- Bathrooms: Two full bathrooms; Tubs with shower over
- Heating & cooling: Central heating; Propane heating; Evaporative cooler
- Interior features: Accessible doors and an accessible full bathroom; Covered and screened-in patio; Dual-pane full windows; Dining and living room combined; Screened room
- Laundry & utility: Washer/dryer stacked included; Gas hookup in laundry; Laundry hookups only; Laundry located in garage and in kitchen
Neighborhood map
What this means for you Summary
Snapshot
- This is a 2-bed/2.0-bath manufactured listed at $140k.
Deal economics
- At list price, monthly cash flow is $280 ($3k/yr) — positive.
- The deal already cash-flows at list — no discount required.
- Meets the 1% rule at list price ($2k rent vs $140k).
- Recommended offer: $123k (12.0% below list) — sets the bar for market timing.
- Cap rate 8.7% vs local median 2.5% in Colfax — top-decile yield for the area; either an underpriced asset or a hidden risk that comps aren't pricing in. Stress-test before assuming the spread holds.
Location & tenants
- Location reads 71/100 on livability (#216 in CA) — a middle-class / working-renter tenant base. Strengths: housing A+, health & safety A+, crime B+; Watch: amenities F, commute F, cost of living F.
- Colfax Elementary (rural): math 24% / reading 33% proficiency, ranked #348 of 517 in CA (top 67%) — low school quality limits family demand, transient renter base, plan for 1-2y turnover.
- Market conditions: 105 active listings in the ZIP; 1 comparable units currently listed for rent nearby; solid renter incomes; 3,535 units permitted in Placer County in 2024 (689 in 5+ unit buildings).
Forward outlook
- Local home prices are declining (-3.0%/yr); year-one equity from $968 of loan paydown is wiped out by about $4k of value loss. Plan a longer hold.
- Placer County population projected at +20% by 2050 — long-run rental-demand tailwind backs the buy-and-hold thesis.
Negotiation context
- It's been on market 225 days — a 12% lower offer ($123k) is reasonable based on typical stale-listing flexibility.
Risks & watch-outs
- Climate carrying-cost: severe wildfire risk; extreme-heat days projected 7→15/yr by 2055 (HVAC capex compounding) — expect insurance premiums to compound above CPI over the hold.
Questions for the listing agent
- It's been on market 225 days. Have you received any prior offers? Is the seller open to a 12% concession, seller financing, or rate buy-down credit?
- Why hasn't it sold? Are there any deal-killer items the seller is aware of (foundation, flood, title, zoning, code violations)?
- Is there a deadline driving the sale (1031 exchange, divorce, estate, relocation)? That informs how much negotiation room exists.
- The area grade is low — what's the realistic commute time and amenity access for the typical tenant pool here? Any planned neighborhood developments (good or bad) we should know about?
- What's the average days-on-market for RENTAL listings here right now (not sales)? A rising rental-DOM trend means longer vacancies and softer asking-rent achievability than the comps imply.
- What's the recent tenant-quality profile in this submarket — average credit score on applications, eviction rate, late-payment / NSF rate, and stable-employment percentage? A property-management company in the area should have these aggregated.
- How much new for-sale + rental construction is in the pipeline within 1–3 miles? Heavy new supply typically softens prices + rents 12–24 months out; constrained supply supports both.
Investment metrics
- 1% rule
- 1.13% ✓
- Cap rate
- 8.69%
- Cash-on-cash
- 8.58%
- DSCR
- 1.38
- GRM
- 7.4
CMA / ARV
- ARV (on-the-fly)
- $96,800
- Comps found
- 4
Show comp detail 4 sales within ~0.75 mi
| Address | Dist | Beds/Ba | Sqft | Sold | Price | $/sf | Match |
|---|---|---|---|---|---|---|---|
| 450 Gladycon Rd #17 | 0.02mi | 2/1.0 | 812 (+2%) | 7mo | $114,000 | $140 | 87 |
| 450 Gladycon Rd #20 | 0.02mi | 2/1.0 | 837 (+5%) | 12mo | $49,000 | $59 | 78 |
| 450 Gladycon Rd #21 | 0.02mi | 2/1.0 | 850 (+6%) | 14mo | $52,500 | $62 | 73 |
| 450 Gladycon Rd #14 | 0.02mi | 1/1.0 (-1) | 725 (-9%) | 19mo | $88,000 | $121 | 58 |
Match score weights: distance 35% · size 25% · config 20% · recency 20%. Top-matched comps best support the ARV.
Projected returns pro-forma
-3.0% appreciation · 3.0% rent growth · sell at horizon
- IRR
- -3.3%
- Equity multiple
- 0.88×
- Total profit
- $-4,819
- Equity at exit
- $20,874
- IRR
- 6.4%
- Equity multiple
- 1.48×
- Total profit
- $18,876
- Equity at exit
- $12,105
Cash invested: $39,200 (down + closing). Projections, not guarantees.
Landlord ↔ Tenant lean methodology
- Overall (STATE)
- 18 Strongly Tenant-Friendly
- State California
- 18 Strongly Tenant-Friendly · D+13
- County
- — inherits STATE
- City
- — inherits STATE
ZIP-level market 95713
- Active inventory
- 105
- Price-to-rent
- 7.4×
Monthly cashflow live
- Estimated rent
- $1,579 medium interval (Pro) →
- Mortgage (P&I)
- −$734
- Tax est. 1.5%
- −$175 /mo · $2,100/yr
- Insurance
- −$58
- HOA
- −$0
- Vacancy / Maint / Mgmt
- −$332
- Net cashflow
- $280
Break-even live
UW: 25.0% down · 7.5% · 30yr · 1.5% tax · 5.0% vac · 8.0% maint · 8.0% mgmt
Financing live
Cash to close
- Down payment
- $35,000
- Closing costs
- $4,200
- Reserves months
- —
- Total cash needed
- —
Loan-product check · same deal, 3 products live
Conventional
25% down · 7.5% · 30yr
- Down + closing
- —
- Monthly P&I
- —
- Monthly cashflow
- —
- DSCR
- —
- Eligible?
- —
Personal DTI + credit; lowest rate.
DSCR
20% down · 8.5% · 30yr
- Down + closing
- —
- Monthly P&I
- —
- Monthly cashflow
- —
- DSCR
- —
- Eligible?
- —
No personal income docs; deal must DSCR.
Hard money
10% down · 12.0% · 12mo
- Down + closing
- —
- Monthly P&I
- —
- Monthly cashflow
- —
- DSCR
- —
- Eligible?
- —
Short-term bridge; refi at stabilization.
Rent comps 1 comps
| Address | Beds | Baths | Sqft | Rent | $/sqft | DOM | Units | Dist |
|---|---|---|---|---|---|---|---|---|
| 216 W Oak St Unit 2 Colfax, CA | 1.0 | 1.0 | 715 | $1,425 | $1.99 | 1d | 1 | 1.43mi |
Listing history 16 events
-
2026-06-19days on market $140,000 Active 225 DOM
-
2026-06-18days on market $140,000 Active 224 DOM
-
2026-06-17days on market $140,000 Active 223 DOM
-
2026-06-16days on market $140,000 Active 222 DOM
-
2026-06-15days on market $140,000 Active 221 DOM
-
2026-06-13days on market $140,000 Active 219 DOM
-
2026-06-13pricedays on market $140,000 Active 218 DOM
-
2026-06-10days on market $150,000 Active 216 DOM
-
2026-06-09days on market $150,000 Active 215 DOM
-
2026-06-08days on market $150,000 Active 214 DOM
-
2026-06-07days on market $150,000 Active 213 DOM
-
2026-06-05days on market $150,000 Active 210 DOM
-
2026-06-03days on market $150,000 Active 209 DOM
-
2026-06-02days on market $150,000 Active 208 DOM
-
2026-06-01days on market $150,000 Active 207 DOM
-
2026-05-31days on market $150,000 Active 206 DOM
ⓘ Source: listings_history table (triggers on properties + properties_extension) + one-shot
backfill from property_details.listing_events for pre-trigger history.
Climate risk First Street
- Flood 1/10 Low FEMA zone X (unshaded) · 0% chance over 30 yrs
- Wildfire 8/10 Severe
- Heat 5/10 Major 7 d/yr ≥98°F today · 15 d/yr by 30 yrs out
- Wind 1/10 Low
- Air quality 10/10 Extreme 37 unhealthy d/yr today · 39 by 30 yrs out
Nearby sold comps map
Loading sold comps map…
Walkable amenities ~0.75 mi
Loading nearby amenities…
Taxation est. · year 1
- Rental income
- $18,952
- − Mortgage interest
- −$7,842
- − Property taxes
- −$2,100
- − Insurance
- −$700
- − Repairs & maintenance
- −$1,516
- − Management
- −$1,516
- − Depreciation
- −$4,073
- Taxable income
- $1,205
- Est. tax owed @ 24.0%
- −$289
- After-tax cash flow
- $3,073/yr
For passive investors: Depreciation is non-cash, so a rental often shows a tax loss while cash-flowing — sheltering income. Rental losses are passive: they offset passive income freely, and up to $25,000/yr can offset ordinary (W-2) income if you actively participate and your MAGI is under $100k (phasing out to $0 by $150k); unused losses carry forward. On sale, claimed depreciation is recaptured at up to 25%, and gains may owe capital-gains tax (a 1031 exchange can defer both). Figures are a year-1 estimate at your 24.0% rate — not tax advice; consult a CPA.
Schools (NCES district)
- District
- Colfax Elementary
- NCES district ID
- 0609300
- Math proficiency
- 24% ▼ -18.00%
- Reading proficiency
- 33% ▼ -12.00%
- Median HH income
- $59,844
- Composite
- 25.87/100
- National rank
- #7345
- State rank
- #348 of 517 in CA
Livability — Colfax
- Score
- 71/100
- State rank
- #216
- US rank
- #6827
Category grades
Schools grade is shown separately in the Schools card above.
Census & demographics
- County
- Placer County · 390,510 people
- City population
- 9,448
- Metro
- Sacramento-Roseville-Folsom, CA
- Population (ZIP)
- 9,448
- Household income
- $87,839
- Rent vs Own
- Severe rent burden
- 209.0
Population outlook (Placer County) Hauer SSP2
- Today (2025)
- 422,709 people
- By 2030
- 444,249 · +5.1%
- By 2040
- 480,192 · +13.6%
- By 2050
- 506,390 · +19.8%
- By 2075
- 550,219 · +30.2%
- By 2100
- 547,760 · +29.6%
Race, ethnicity, and origin ACS 2023
- Neighborhood character
- Predominantly White (79%)
- Race & ethnicity
- White 79% Hispanic / Latino 12% Two or more races 9% Asian 2%
- Hispanic origin (detail)
- Mexican 7%
- Common ancestry
- Italian 5% Slovak 3% Portuguese 3%
- Foreign-born
- 7% · Canada, China
- Languages at home
- 93% English-only · Spanish 4% Other Indo-European 3%
Political lean MEDSL · Placer
- 2024 margin
- Lean R (+8.5) · D 44.3% · R 52.8% · Other 2.9%
- 2008→2024 swing
- +2.8pp toward D · 2008: -11.3pp · 2024: -8.5pp
- All cycles
- 2024: R+8.5 2020: R+6.7 2016: R+11.3 2012: R+20.1 2008: R+11.3
Not yet ingested
- Civics
- —
Market trends
- HPI YoY
- ▼ -142.00%
- Current HPI
- 238.8248
- Rent YoY
- —
- Metro
- Sacramento-Roseville-Folsom, CA
- State GDP YoY
- ▲ 3.21%
- F500 in state
- 116
Industry mix (Fortune 500 HQ in CA)
| Industry | F500 HQs | Revenue |
|---|---|---|
| Technology | 27 | $1,492B |
|
||
| Financial Services | 3 | $174B |
|
||
| Retail | 3 | $44B |
|
||
| Insurance | 3 | $26B |
|
||
| Media / Entertainment | 2 | $115B |
|
||
| Pharmaceuticals / Biotech | 2 | $62B |
|
||
Cash-flow waterfall
monthlySold comps — $/sqft
last 12 mo · ≤1 miLoading sold comps…