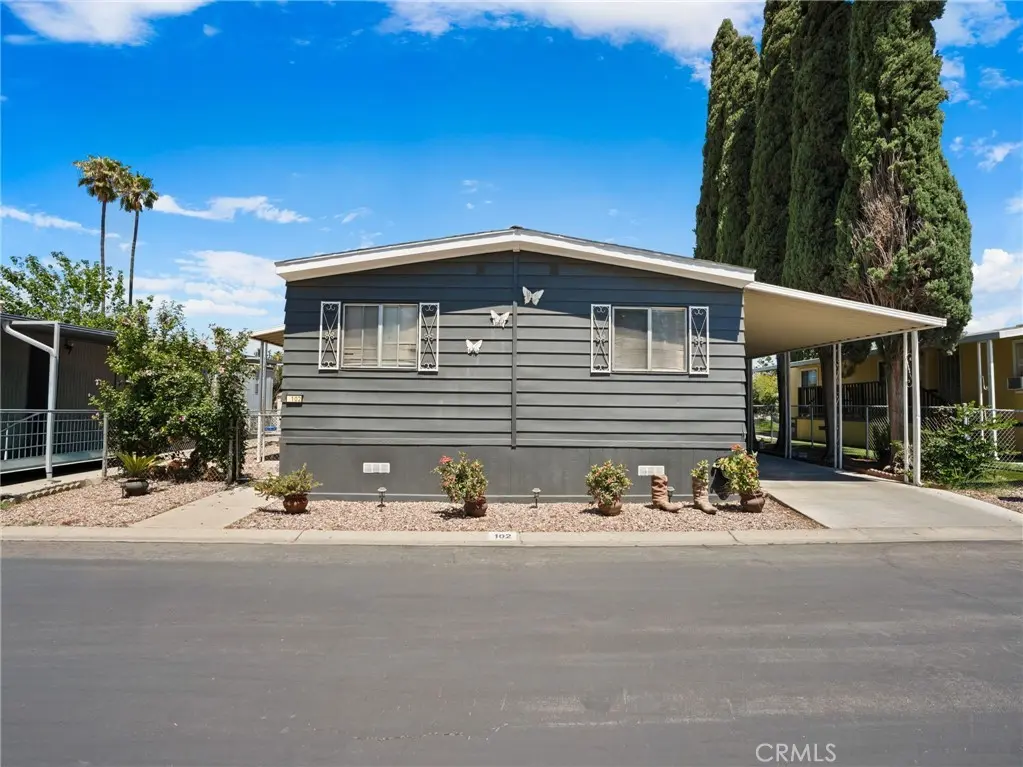
777 S Temescal St #102 · Corona, CA
Flood risk 1/10 · Minimal
- FEMA flood zone
- X (shaded)
- Chance of flooding over 30 yrs
- 0.0%
- Est. flood insurance / yr
- $507 – $1,088
Fire risk 8/10 · Major
- Est. fire insurance / yr
- $659 – $1,223
Heat risk 7/10 · Major
- Hot days now (above 101°F)
- 7 days/yr
- Hot days in 30 yrs
- 20 days/yr
Wind risk 1/10 · Minimal
- Chance of severe wind over 30 yrs
- —
Air-quality risk 9/10 · Severe
- Unhealthy air days now
- 19 days/yr
- Unhealthy air days in 30 yrs
- 23 days/yr
Risk factors via First Street. Map © Google.
Why this score? — see what drove the B grade
The composite is a weighted blend of 9 inputs, each scored 0–100. Each bar is that input's sub-score; the figure is the points it added to the 100-point composite (weight × sub-score).
- Cash flow +30.0/30.0
- 1% rule +10.0/10.0
- DSCR +10.0/10.0
- ARV discount +7.6/15.0
- Schools +5.1/10.0
- Rent growth +3.2/5.0
- Livability +3.2/5.0
- Condition / age +2.5/5.0
- Appreciation +0.0/10.0
$130,000
🖨 Deal sheet 📄 Offer letter ✓ Due diligence
Listing remarks MLS
SPACIOUS 3 BEDROOM 2 BATH MOBILE HOME LOCATED IN DESIRABLE CORONA LA LINDA MOBILE HOME PARK COMMUNITY. OPEN FLOOR PLAN, SPACIOUS ROOMS. SEPARATE DINING AREA, LARGE LIVING ROOM. PRIVATE FENCE YARD FOR KIDS AND PETS. WELL MAINTAINED AND READY FOR IT'S NEW OWNERS TO MAKE IT THEIR OWN. GREAT LOCATION NEAR 15 FWY. AND 91 FWY.
Key facts
- Covered parking
- Community clubhouse
- Storage shed
Tags
Property features AI
Finance
- Other: Living area source: Assessor's data; Parcel number available; Directions: MAGNOILIA AVE./TEMESCAL ST.
- HOA & community: Land lease in place ($1,470 monthly); Park: CORONA LA LINDA; Manager approval required
Exterior
- Parking: Carport with space for 3 vehicles; Access via city streets
- Utilities: Public sewer; District/public water
- Home design: Manufactured/mobile home (12' x 56') — mobile home remains; Single-story; Shingle roof
- Construction: Year built reported by builder
- Exterior features: Porch; Patio; Community pool; Shed; Paved lot/driveway; Sidewalks
Interior
- Flooring: Wood flooring; Laminate flooring
- Bathrooms: 2 full bathrooms
- Heating & cooling: Central heating (furnace); Central air conditioning
- Interior features: One-level layout; Turnkey condition; Kitchen; Living Room
- Laundry & utility: Laundry inside the unit
Neighborhood map
What this means for you Summary
Snapshot
- This is a 2-bed/2.0-bath manufactured listed at $130k.
Deal economics
- At list price, monthly cash flow is $1k ($15k/yr) — positive.
- The deal already cash-flows at list — no discount required.
- Meets the 1% rule at list price ($3k rent vs $130k).
- Recommended offer: $128k (1.5% below list) — sets the bar for market timing.
- Cap rate 18.1% vs local median 2.9% in Corona — top-decile yield for the area; either an underpriced asset or a hidden risk that comps aren't pricing in. Stress-test before assuming the spread holds.
Location & tenants
- Location reads 63/100 on livability (#461 in CA) — a middle-class / working-renter tenant base. Strengths: employment A+, housing A-; Watch: commute C-, health & safety D, amenities F.
- Corona-Norco Unified (suburban): math 46% / reading 61% proficiency, ranked #312 of 1,400 in CA (top 22%) — acceptable for families but not a draw, mixed tenant base, ~2y average lease.
- Market conditions: Rents rising (+2.8%/yr); 85 active listings in the ZIP; 14 comparable units currently listed for rent nearby; rentals leasing fast (median 5d on market — plan ~1-2 weeks tenant-placement turnaround); solid renter incomes; 9,195 units permitted in Riverside County in 2024 (1,512 in 5+ unit buildings).
- This rent runs 36% of the median local income ($92k/yr) — at the standard rent-burdened threshold; future hikes will face affordability resistance.
Forward outlook
- Local home prices are declining (-3.0%/yr); year-one equity from $899 of loan paydown is wiped out by about $4k of value loss. Plan a longer hold.
- Riverside County population projected at +22% by 2050 — long-run rental-demand tailwind backs the buy-and-hold thesis.
- At projected returns (-3.0% appreciation + 2.8% rent growth), your $36k cash investment doubles in ~3 years — after that, you're playing with house money.
Negotiation context
- It's been on market 28 days — a 2% lower offer ($128k) is reasonable based on typical stale-listing flexibility.
- 8 sale attempts since 16y ago with the ask held roughly flat each time — persistent listings suggest the price (not the market) is what's stuck; bring a comps-based counter.
- Current owner paid $43k; list at $130k implies a 202% gain — meaningful room to come down on a strong offer.
Risks & watch-outs
- Climate carrying-cost: severe wildfire risk; extreme-heat days projected 7→20/yr by 2055 (HVAC capex compounding) — expect insurance premiums to compound above CPI over the hold.
Questions for the listing agent
- Built in 1975 — when were the roof, HVAC, electrical panel, plumbing, and water heater last replaced?
- Is there a deadline driving the sale (1031 exchange, divorce, estate, relocation)? That informs how much negotiation room exists.
- Schools are B-rated — typically a magnet for longer-tenancy family renters. What's the average tenant stay here, and is there a school-zone premium baked into asking?
- What's the average days-on-market for RENTAL listings here right now (not sales)? A rising rental-DOM trend means longer vacancies and softer asking-rent achievability than the comps imply.
- What's the recent tenant-quality profile in this submarket — average credit score on applications, eviction rate, late-payment / NSF rate, and stable-employment percentage? A property-management company in the area should have these aggregated.
- How much new for-sale + rental construction is in the pipeline within 1–3 miles? Heavy new supply typically softens prices + rents 12–24 months out; constrained supply supports both.
Investment metrics
- 1% rule
- 2.12% ✓
- Cap rate
- 18.14%
- Cash-on-cash
- 42.31%
- DSCR
- 2.88
- GRM
- 3.9
CMA / ARV
- ARV (on-the-fly)
- $130,368
- Comps found
- 12
Show comp detail 12 sales within ~0.75 mi
| Address | Dist | Beds/Ba | Sqft | Sold | Price | $/sf | Match |
|---|---|---|---|---|---|---|---|
| 777 S Temescal St #8 | 0.07mi | 3/2.0 (+1) | 1,440 (+7%) | 1mo | $64,500 | $45 | 79 |
| 777 S Temescal #11 | 0.07mi | 3/2.0 (+1) | 1,440 (+7%) | 4mo | $140,000 | $97 | 76 |
| 777 S Temescal St #78 | 0.07mi | 3/2.0 (+1) | 1,248 (-7%) | 17mo | $175,000 | $140 | 66 |
| 13381 Magnolia Ave #172 | 0.69mi | 2/2.0 | 1,344 (0%) | 8mo | $130,000 | $97 | 61 |
| 13381 Magnolia Ave #121 | 0.69mi | 3/2.0 (+1) | 1,344 (0%) | 9mo | $138,000 | $103 | 55 |
| 13381 Magnolia #35 | 0.69mi | 2/2.0 | 1,440 (+7%) | 3mo | $131,000 | $91 | 53 |
| 13381 Magnolia Ave #127 | 0.69mi | 3/2.0 (+1) | 1,344 (0%) | 12mo | $105,000 | $78 | 53 |
| 13381 Magnolia Ave #140 | 0.69mi | 2/2.0 | 1,440 (+7%) | 14mo | $150,000 | $104 | 44 |
| 13381 Magnolia Ave #41 | 0.69mi | 2/2.0 | 1,440 (+7%) | 17mo | $120,000 | $83 | 42 |
| 13381 Magnolia Ave #72 | 0.69mi | 3/2.0 (+1) | 1,440 (+7%) | 12mo | $119,000 | $83 | 41 |
| 13381 Magnolia Ave #58 | 0.69mi | 2/2.0 | 1,536 (+14%) | 15mo | $152,000 | $99 | 31 |
| 13381 Magnolia Ave #153 | 0.69mi | 2/2.0 | 1,152 (-14%) | 18mo | $140,000 | $122 | 29 |
Match score weights: distance 35% · size 25% · config 20% · recency 20%. Top-matched comps best support the ARV.
Projected returns pro-forma
-3.0% appreciation · 2.77% rent growth · sell at horizon
- IRR
- 38.8%
- Equity multiple
- 2.65×
- Total profit
- $60,088
- Equity at exit
- $19,383
- IRR
- 45.1%
- Equity multiple
- 5.26×
- Total profit
- $155,153
- Equity at exit
- $11,240
Cash invested: $36,400 (down + closing). Projections, not guarantees.
Landlord ↔ Tenant lean methodology
- Overall (STATE)
- 18 Strongly Tenant-Friendly
- State California
- 18 Strongly Tenant-Friendly · D+13
- County
- — inherits STATE
- City
- — inherits STATE
ZIP-level market 92879
- Rents YoY
- 2.8%
- Active inventory
- 85
- Price-to-rent
- 3.9×
Monthly cashflow live
- Estimated rent
- $2,762 high interval (Pro) →
- Mortgage (P&I)
- −$682
- Tax est. 1.5%
- −$162 /mo · $1,950/yr
- Insurance
- −$54
- HOA
- −$0
- Vacancy / Maint / Mgmt
- −$580
- Net cashflow
- $1,284
Break-even live
UW: 25.0% down · 7.5% · 30yr · 1.5% tax · 5.0% vac · 8.0% maint · 8.0% mgmt
Financing live
Cash to close
- Down payment
- $32,500
- Closing costs
- $3,900
- Reserves months
- —
- Total cash needed
- —
Loan-product check · same deal, 3 products live
Conventional
25% down · 7.5% · 30yr
- Down + closing
- —
- Monthly P&I
- —
- Monthly cashflow
- —
- DSCR
- —
- Eligible?
- —
Personal DTI + credit; lowest rate.
DSCR
20% down · 8.5% · 30yr
- Down + closing
- —
- Monthly P&I
- —
- Monthly cashflow
- —
- DSCR
- —
- Eligible?
- —
No personal income docs; deal must DSCR.
Hard money
10% down · 12.0% · 12mo
- Down + closing
- —
- Monthly P&I
- —
- Monthly cashflow
- —
- DSCR
- —
- Eligible?
- —
Short-term bridge; refi at stabilization.
Rent comps 14 comps
| Address | Beds | Baths | Sqft | Rent | $/sqft | DOM | Units | Dist |
|---|---|---|---|---|---|---|---|---|
| 3721 N Byron St Unit 3731 Corona, CA | 2.0 | 1.0 | 925 | $2,150 | $2.32 | 5d | 1 | 0.28mi |
| 3827 Grant St #54 Corona, CA | 3.0 | 2.5 | 1354 | $3,250 | $2.40 | 4d | 1 | 0.54mi |
| 13370 Magnolia Ave Corona, CA | 3.0 | 2.0 | 900 | $2,450 | $2.72 | 43d | 1 | 0.64mi |
| 400 Yellowstone Cir Corona, CA | 3.0 | 2.5 | 1594 | $3,400 | $2.13 | 24d | 1 | 1.00mi |
| 451 Wellesley Dr Corona, CA | 1.0–3.0 | 1.0–3.0 | 1038 | $3,024 | $2.91 | 1d | 15 | 1.05mi |
| 3713 Calle Curacso Riverside, CA | 3.0 | 2.5 | 1300 | $3,090 | $2.38 | 43d | 1 | 1.11mi |
| 3713 Calle Curacso Riverside, CA | 3.0 | 2.0 | 1300 | $3,090 | $2.38 | 16d | 1 | 1.11mi |
| 2225 Collett Ave Corona, CA | 1.0–3.0 | 1.0–2.0 | 1117 | $2,997 | $2.68 | 1d | 33 | 1.12mi |
| 501 Roosevelt St Corona, CA | 3.0 | 2.0 | 1272 | $3,350 | $2.63 | 11d | 1 | 1.13mi |
| 2178 Stoneridge Dr Corona, CA | 1.0–3.0 | 1.0–2.0 | 946 | $2,576 | $2.72 | 1d | 10 | 1.39mi |
| 2365 Promenade Ave Corona, CA | 1.0–2.0 | 1.0–2.0 | 892 | $2,557 | $2.87 | 1d | 18 | 1.43mi |
| 1171 Baywood Dr Corona, CA | 1.0–2.0 | 1.0–2.0 | 756 | $2,716 | $3.59 | 2d | 18 | 1.46mi |
| 2235 Treehouse Ln Corona, CA | 1.0–2.0 | 1.0–2.0 | 886 | $2,770 | $3.12 | 1d | 17 | 1.48mi |
| 2215 Lakeside Pl Corona, CA | 2.0–3.0 | 1.0–2.0 | 1043 | $2,244 | $2.15 | 2d | 26 | 1.48mi |
Listing history 38 events
-
2026-06-18days on market $130,000 Active 28 DOM
-
2026-06-17days on market $130,000 Active 27 DOM
-
2026-06-16days on market $130,000 Active 26 DOM
-
2026-06-15days on market $130,000 Active 25 DOM
-
2026-06-13days on market $130,000 Active 23 DOM
-
2026-06-13days on market $130,000 Active 22 DOM
-
2026-06-09days on market $130,000 Active 19 DOM
-
2026-06-08days on market $130,000 Active 18 DOM
-
2026-06-07days on market $130,000 Active 17 DOM
-
2026-06-04days on market $130,000 Active 14 DOM
-
2026-06-03days on market $130,000 Active 13 DOM
-
2026-06-02days on market $130,000 Active 12 DOM
-
2026-06-01days on market $130,000 Active 11 DOM
-
2026-05-31days on market $130,000 Active 10 DOM
-
2026-05-21$130,000 Active
-
2024-01-24historical
-
2024-01-03status Active
-
2024-01-03price $140,000
-
2023-12-05price $150,000
-
2023-10-30status Active
-
2023-10-25status Pending Sale
-
2023-10-12price $163,999
-
2023-09-01price $174,999
-
2023-07-19$185,000 Active
-
2018-02-14soldstatus $43,000 Closed Sale 322-char remark
Show marketing remark (322 chars)
SPACIOUS 3 BEDROOM 2 BATH MOBILE HOME LOCATED IN DESIRABLE CORONA LA LINDA MOBILE HOME PARK COMMUNITY. OPEN FLOOR PLAN, SPACIOUS ROOMS. SEPARATE DINING AREA, LARGE LIVING ROOM. PRIVATE FENCE YARD FOR KIDS AND PETS. WELL MAINTAINED AND READY FOR IT'S NEW OWNERS TO MAKE IT THEIR OWN. GREAT LOCATION NEAR 15 FWY. AND 91 FWY.
-
2018-01-23status Pending Sale 322-char remark
Show marketing remark (322 chars)
SPACIOUS 3 BEDROOM 2 BATH MOBILE HOME LOCATED IN DESIRABLE CORONA LA LINDA MOBILE HOME PARK COMMUNITY. OPEN FLOOR PLAN, SPACIOUS ROOMS. SEPARATE DINING AREA, LARGE LIVING ROOM. PRIVATE FENCE YARD FOR KIDS AND PETS. WELL MAINTAINED AND READY FOR IT'S NEW OWNERS TO MAKE IT THEIR OWN. GREAT LOCATION NEAR 15 FWY. AND 91 FWY.
-
2018-01-04historical Active Under Contract 322-char remark
Show marketing remark (322 chars)
SPACIOUS 3 BEDROOM 2 BATH MOBILE HOME LOCATED IN DESIRABLE CORONA LA LINDA MOBILE HOME PARK COMMUNITY. OPEN FLOOR PLAN, SPACIOUS ROOMS. SEPARATE DINING AREA, LARGE LIVING ROOM. PRIVATE FENCE YARD FOR KIDS AND PETS. WELL MAINTAINED AND READY FOR IT'S NEW OWNERS TO MAKE IT THEIR OWN. GREAT LOCATION NEAR 15 FWY. AND 91 FWY.
-
2017-11-18$45,000 Active 322-char remark
Show marketing remark (322 chars)
SPACIOUS 3 BEDROOM 2 BATH MOBILE HOME LOCATED IN DESIRABLE CORONA LA LINDA MOBILE HOME PARK COMMUNITY. OPEN FLOOR PLAN, SPACIOUS ROOMS. SEPARATE DINING AREA, LARGE LIVING ROOM. PRIVATE FENCE YARD FOR KIDS AND PETS. WELL MAINTAINED AND READY FOR IT'S NEW OWNERS TO MAKE IT THEIR OWN. GREAT LOCATION NEAR 15 FWY. AND 91 FWY.
-
2011-08-28historical
-
2011-06-13price $25,000
-
2011-03-15price $29,000
-
2011-02-28$32,000 Active
-
2011-02-25historical
-
2011-02-16price $32,000 Active
-
2011-02-16status Active
-
2011-01-27historical
-
2010-10-21price $38,000
-
2010-07-28$40,000 Active
ⓘ Source: listings_history table (triggers on properties + properties_extension) + one-shot
backfill from property_details.listing_events for pre-trigger history.
Climate risk First Street
- Flood 1/10 Low FEMA zone X (shaded) · 0% chance over 30 yrs
- Wildfire 8/10 Severe
- Heat 7/10 Severe 7 d/yr ≥101°F today · 20 d/yr by 30 yrs out
- Wind 1/10 Low
- Air quality 9/10 Extreme 19 unhealthy d/yr today · 23 by 30 yrs out
Nearby sold comps map
Loading sold comps map…
Walkable amenities ~0.75 mi
Loading nearby amenities…
Taxation est. · year 1
- Rental income
- $33,143
- − Mortgage interest
- −$7,282
- − Property taxes
- −$1,950
- − Insurance
- −$650
- − Repairs & maintenance
- −$2,651
- − Management
- −$2,651
- − Depreciation
- −$3,782
- Taxable income
- $14,177
- Est. tax owed @ 24.0%
- −$3,402
- After-tax cash flow
- $12,000/yr
For passive investors: Depreciation is non-cash, so a rental often shows a tax loss while cash-flowing — sheltering income. Rental losses are passive: they offset passive income freely, and up to $25,000/yr can offset ordinary (W-2) income if you actively participate and your MAGI is under $100k (phasing out to $0 by $150k); unused losses carry forward. On sale, claimed depreciation is recaptured at up to 25%, and gains may owe capital-gains tax (a 1031 exchange can defer both). Figures are a year-1 estimate at your 24.0% rate — not tax advice; consult a CPA.
Schools (NCES district)
- District
- Corona-Norco Unified
- NCES district ID
- 0609850
- Math proficiency
- 46% ▲ 1.00%
- Reading proficiency
- 61% ▬ 0.00%
- Median HH income
- $83,380
- Composite
- 50.72/100
- National rank
- #3920
- State rank
- #312 of 1400 in CA
Livability — Corona
- Score
- 63/100
- State rank
- #461
- US rank
- #15787
Category grades
Schools grade is shown separately in the Schools card above.
Census & demographics
- Census place
- Corona, CA
- County
- Riverside County · 2,287,001 people
- City population
- 188,369
- Metro
- Riverside-San Bernardino-Ontario, CA
- Population (ZIP)
- 49,317
- Household income
- $92,229
- Rent vs Own
- Severe rent burden
- 2058.0
Population outlook (Riverside County) Hauer SSP2
- Today (2025)
- 2,664,475 people
- By 2030
- 2,802,692 · +5.2%
- By 2040
- 3,050,904 · +14.5%
- By 2050
- 3,256,783 · +22.2%
- By 2075
- 3,655,058 · +37.2%
- By 2100
- 3,766,594 · +41.4%
Race, ethnicity, and origin ACS 2023
- Neighborhood character
- Diverse neighborhood (Simpson 0.58)
- Race & ethnicity
- Hispanic / Latino 59% White 21% Two or more races 13% Asian 13% Black 5% Native American 2%
- Hispanic origin (detail)
- Mexican 50%
- Common ancestry
- Italian 2% Romanian 1% Armenian 1%
- Foreign-born
- 30% · Canada, Vietnam, China
- Languages at home
- 43% English-only · Spanish 44% Tagalog/Filipino 2% Other Indo-European 2%
Political lean MEDSL · Riverside
- 2024 margin
- Toss-up / Even · D 48.0% · R 49.3% · Other 2.6%
- 2008→2024 swing
- -3.6pp toward R · 2008: 2.3pp · 2024: -1.3pp
- All cycles
- 2024: R+1.3 2020: D+8.0 2016: D+4.3 2012: R+0.4 2008: D+2.3
Not yet ingested
- Civics
- —
Market trends
- HPI YoY
- ▼ -395.32%
- Current HPI
- 380.3129
- Rent YoY
- ▲ 2.77%
- Metro
- Riverside-San Bernardino-Ontario, CA
- State GDP YoY
- ▲ 3.21%
- F500 in state
- 116
Industry mix (Fortune 500 HQ in CA)
| Industry | F500 HQs | Revenue |
|---|---|---|
| Technology | 27 | $1,492B |
|
||
| Financial Services | 3 | $174B |
|
||
| Retail | 3 | $44B |
|
||
| Insurance | 3 | $26B |
|
||
| Media / Entertainment | 2 | $115B |
|
||
| Pharmaceuticals / Biotech | 2 | $62B |
|
||
Price history
+225.0% since first listed24 events — show timeline
- 2026-05-21 Listed $130,000 CRMLS
- 2024-01-24 Listing Removed — CRMLS
- 2024-01-03 Relisted — CRMLS
- 2024-01-03 Price Changed $140,000 CRMLS
- 2023-12-05 Price Changed $150,000 CRMLS
- 2023-10-30 Relisted — CRMLS
- 2023-10-25 Pending — CRMLS
- 2023-10-12 Price Changed $163,999 CRMLS
- 2023-09-01 Price Changed $174,999 CRMLS
- 2023-07-19 Listed $185,000 CRMLS
- 2018-02-14 Sold (MLS) $43,000 CRMLS
- 2018-01-23 Pending — CRMLS
- 2018-01-04 Contingent — CRMLS
- 2017-11-18 Listed $45,000 CRMLS
- 2011-08-28 Listing Removed — CRMLS
- 2011-06-13 Price Changed $25,000 CRMLS
- 2011-03-15 Price Changed $29,000 CRMLS
- 2011-02-28 Listed $32,000 CRMLS
- 2011-02-25 Listing Removed — CRMLS
- 2011-02-16 Relisted — CRMLS
- 2011-02-16 Price Changed $32,000 CRMLS
- 2011-01-27 Listing Removed — CRMLS
- 2010-10-21 Price Changed $38,000 CRMLS
- 2010-07-28 Listed $40,000 CRMLS
Property tax history
-3.2%/yrLatest (2025): $149 · +4.5% YoY. Source: county tax records.
Cash-flow waterfall
monthlySold comps — $/sqft
last 12 mo · ≤1 miLoading sold comps…