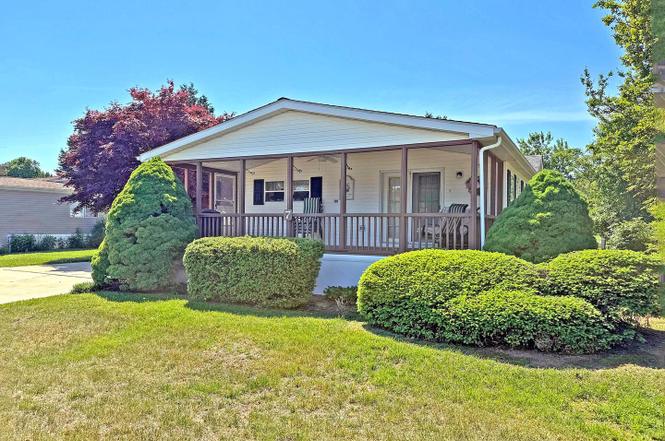
7 Devon Ln Unit E-5 · Lewes, DE
Flood risk 1/10 · Minimal
- FEMA flood zone
- X (unshaded)
- Chance of flooding over 30 yrs
- 0.0%
- Est. flood insurance / yr
- $473 – $860
Fire risk 1/10 · Minimal
- Est. fire insurance / yr
- $476 – $884
Heat risk 8/10 · Major
- Hot days now (above 101°F)
- 7 days/yr
- Hot days in 30 yrs
- 19 days/yr
Wind risk 8/10 · Major
- Chance of severe wind over 30 yrs
- 80.0%
Air-quality risk 2/10 · Minimal
- Unhealthy air days now
- 1 days/yr
- Unhealthy air days in 30 yrs
- 1 days/yr
Risk factors via First Street. Map © Google.
Why this score? — see what drove the B+ grade
The composite is a weighted blend of 9 inputs, each scored 0–100. Each bar is that input's sub-score; the figure is the points it added to the 100-point composite (weight × sub-score).
- Cash flow +30.0/30.0
- ARV discount +15.0/15.0
- 1% rule +10.0/10.0
- DSCR +10.0/10.0
- Schools +4.2/10.0
- Condition / age +3.8/5.0
- Livability +3.4/5.0
- Rent growth +2.7/5.0
- Appreciation +0.0/10.0
$160,000
🖨 Deal sheet 📄 Offer letter ✓ Due diligence
Listing remarks
Sussex East/West is a leased-land, 55-plus * community ( * up to 20% of owners may be younger than 55-years-old). Sussex East is located approximately 5.5 miles from the Lewes public beach, with the Cape Henlopen State Park beaches. .. and the famous Rehoboth Beach boardwalk not much farther away. This community has a unique location with direct access to the State Park’s hiking/biking trail through common groundsshed. This 3 bedroom 2 full bath manufactured home was built in 1994 and offers a newer vinyl plank floor in the kitchen and primary bath. The kitchen has an island and is open to the family room with access to a covered deck. Central Ac and newer furnace in 2024. New insula
Key facts
- Fenced dog park
- Covered deck
- Unique location
Tags
Property features AI
Finance
- Other: Accessibility: 2+ access exits; Park name: RHP; Location: outside city limits, between Rt 1 & 113
- Financial info: Land lease applies (ground rent exists) with monthly land lease payment; Ground rent paid annually; Land lease amount listed as $629 monthly; ground rent listed as annual in income/expense notes
- HOA & community: Association amenities include dog park and indoor swimming pool; HOA fee covers common area maintenance and road maintenance; Private road (blacktop) within the community; Community indoor heated saltwater pool
Exterior
- Parking: Concrete driveway; Driveway parking with 3 spaces (plus total of 3 garage/parking spaces counted)
- Utilities: Public water; Public sewer; 100 amp service with 220 volts; Electric hot water; Internet via cable or satellite
- Home design: Manufactured double-wide home (Skyline); Single-story entry (main living on one level); Facing direction not specified; Senior community (55+)
- Construction: Vinyl siding; Architectural shingle, pitched roof; Crawl space foundation with pillar/post/pier; Built date source: Assessor; Building not winterized
- Exterior features: Porch(es), screened; Satellite dish; Awnings; Landscaped lot; Shed
Interior
- Kitchen: Dishwasher; Gas oven/range; Range hood; Refrigerator; Icemaker
- Bedrooms: Three main-level bedrooms
- Flooring: Carpet; Luxury vinyl plank
- Bathrooms: Two full bathrooms (both on the main level)
- Heating & cooling: Forced air heating (natural gas); Central air conditioning; Ceiling fans
- Interior features: Carpeted areas; Ceiling fans; Family room open to the kitchen; Kitchen island; Window treatments; Dining area; Soaking tub; Stall shower; Tub/shower combination; Traditional floor plan; Pantry; Master bath; Walk-in closets; Storm doors; Sliding glass door; Insulated doors; Partially furnished
- Laundry & utility: Washer/dryer hookups on main floor; Electric water heater
Neighborhood map
What this means for you Summary
Snapshot
- This is a 3-bed/2.0-bath single-family listed at $160k. Condition is rated good.
Deal economics
- At list price, monthly cash flow is $933 ($11k/yr) — positive.
- The deal already cash-flows at list — no discount required.
- Meets the 1% rule at list price ($3k rent vs $160k).
- Cap rate 13.3% vs local median 1.7% in Lewes — top-decile yield for the area; either an underpriced asset or a hidden risk that comps aren't pricing in. Stress-test before assuming the spread holds.
Location & tenants
- Location reads 67/100 on livability (#40 in DE) — a middle-class / working-renter tenant base. Strengths: crime A+, employment A+, health & safety A+; Watch: commute F, cost of living F.
- Cape Henlopen School District (town): math 42% / reading 55% proficiency, ranked #5 of 26 in DE (top 19%) — families likely to look elsewhere, expect single-tenant / working-renter base with shorter leases.
- Market conditions: Rents flat; 818 active listings in the ZIP; 7 comparable units currently listed for rent nearby; rentals lingering (median 44d on market — plan ~5-8 weeks vacancy on turnover, expect pricing pressure); 57% of comp listings sitting > 30 days — soft ceiling on asking rent; solid renter incomes; 4,354 units permitted in Sussex County in 2024 (344 in 5+ unit buildings).
- This rent runs 32% of the median local income ($97k/yr) — at the standard rent-burdened threshold; future hikes will face affordability resistance.
Forward outlook
- Local home prices are declining (-3.0%/yr); year-one equity from $1k of loan paydown is wiped out by about $5k of value loss. Plan a longer hold.
- Sussex County population projected at +25% by 2050 — long-run rental-demand tailwind backs the buy-and-hold thesis.
- At projected returns (-3.0% appreciation + 0.8% rent growth), your $45k cash investment doubles in ~6 years — after that, you're playing with house money.
Negotiation context
- Only 2 days on market — expect competitive offers; lowballing is unlikely to land.
Risks & watch-outs
- Climate carrying-cost: severe wind risk, 80% chance of damaging wind over 30y; extreme-heat days projected 7→19/yr by 2055 (HVAC capex compounding) — expect insurance premiums to compound above CPI over the hold.
Questions for the listing agent
- Is there a deadline driving the sale (1031 exchange, divorce, estate, relocation)? That informs how much negotiation room exists.
- Schools are B-rated — typically a magnet for longer-tenancy family renters. What's the average tenant stay here, and is there a school-zone premium baked into asking?
- What's the average days-on-market for RENTAL listings here right now (not sales)? A rising rental-DOM trend means longer vacancies and softer asking-rent achievability than the comps imply.
- What's the recent tenant-quality profile in this submarket — average credit score on applications, eviction rate, late-payment / NSF rate, and stable-employment percentage? A property-management company in the area should have these aggregated.
- How much new for-sale + rental construction is in the pipeline within 1–3 miles? Heavy new supply typically softens prices + rents 12–24 months out; constrained supply supports both.
Investment metrics
- 1% rule
- 1.61% ✓
- Cap rate
- 13.29%
- Cash-on-cash
- 24.99%
- DSCR
- 2.11
- GRM
- 5.2
CMA / ARV
- ARV (on-the-fly)
- $271,128
- Comps found
- 12
Show comp detail 12 sales within ~0.75 mi
| Address | Dist | Beds/Ba | Sqft | Sold | Price | $/sf | Match |
|---|---|---|---|---|---|---|---|
| 18 Buckingham Dr | 0.24mi | 3/2.0 | 1,680 (-2%) | 2mo | $266,000 | $158 | 84 |
| 5 Folkstone Ln | 0.17mi | 3/2.0 | 1,798 (+5%) | 1mo | $250,000 | $139 | 83 |
| 32 Kings Xing | 0.18mi | 3/2.0 | 1,650 (-4%) | 4mo | $208,000 | $126 | 81 |
| 11 Madelyn's Way | 0.16mi | 3/2.0 | 1,600 (-7%) | 4mo | $190,000 | $119 | 78 |
| 2 Folkstone Ln | 0.20mi | 3/2.0 | 1,600 (-7%) | 3mo | $199,000 | $124 | 77 |
| 38 Buckingham Dr | 0.18mi | 3/2.0 | 1,568 (-9%) | 2mo | $218,000 | $139 | 76 |
| 24622 Merlot Dr | 0.41mi | 3/2.0 | 1,600 (-7%) | 0mo | $490,000 | $306 | 70 |
| 120 Madison Dr | 0.25mi | 3/2.0 | 1,550 (-10%) | 5mo | $435,000 | $281 | 68 |
| 25 Kings Xing | 0.22mi | 3/2.0 | 1,488 (-13%) | 1mo | $207,444 | $139 | 67 |
| 17258 Ash Ct | 0.58mi | 3/2.0 | 1,792 (+4%) | 1mo | $425,000 | $237 | 65 |
| 31309 Coventry Dr | 0.26mi | 3/2.0 | 1,500 (-13%) | 3mo | $470,000 | $313 | 64 |
| 30830 Mills Ridge Rd | 0.66mi | 3/2.5 | 1,461 (-15%) | 5mo | $650,000 | $445 | 38 |
Match score weights: distance 35% · size 25% · config 20% · recency 20%. Top-matched comps best support the ARV.
Projected returns pro-forma
-3.0% appreciation · 0.77% rent growth · sell at horizon
- IRR
- 15.9%
- Equity multiple
- 1.62×
- Total profit
- $27,867
- Equity at exit
- $23,857
- IRR
- 22.8%
- Equity multiple
- 2.76×
- Total profit
- $78,710
- Equity at exit
- $13,834
Cash invested: $44,800 (down + closing). Projections, not guarantees.
Landlord ↔ Tenant lean methodology
- Overall (STATE)
- 70 Landlord-Friendly
- State Delaware
- 70 Landlord-Friendly · D+7
- County
- — inherits STATE
- City
- — inherits STATE
ZIP-level market 19958
- Rents YoY
- 0.8%
- Active inventory
- 818
- Price-to-rent
- 5.2×
Monthly cashflow live
- Estimated rent
- $2,581 high interval (Pro) →
- Mortgage (P&I)
- −$839
- Tax est. 1.5%
- −$200 /mo · $2,400/yr
- Insurance
- −$67
- HOA
- −$0
- Vacancy / Maint / Mgmt
- −$542
- Net cashflow
- $933
Break-even live
UW: 25.0% down · 7.5% · 30yr · 1.5% tax · 5.0% vac · 8.0% maint · 8.0% mgmt
Financing live
Cash to close
- Down payment
- $40,000
- Closing costs
- $4,800
- Reserves months
- —
- Total cash needed
- —
Loan-product check · same deal, 3 products live
Conventional
25% down · 7.5% · 30yr
- Down + closing
- —
- Monthly P&I
- —
- Monthly cashflow
- —
- DSCR
- —
- Eligible?
- —
Personal DTI + credit; lowest rate.
DSCR
20% down · 8.5% · 30yr
- Down + closing
- —
- Monthly P&I
- —
- Monthly cashflow
- —
- DSCR
- —
- Eligible?
- —
No personal income docs; deal must DSCR.
Hard money
10% down · 12.0% · 12mo
- Down + closing
- —
- Monthly P&I
- —
- Monthly cashflow
- —
- DSCR
- —
- Eligible?
- —
Short-term bridge; refi at stabilization.
Rent comps 7 comps
| Address | Beds | Baths | Sqft | Rent | $/sqft | DOM | Units | Dist |
|---|---|---|---|---|---|---|---|---|
| 20141 Riesling Ln #306 Lewes, DE | 2.0 | 2.0 | 1600 | $2,600 | $1.62 | 43d | 1 | 0.49mi |
| 24258 Zinfandel Ln Lewes, DE | 2.0 | 2.0 | 1300 | $2,300 | $1.77 | 43d | 1 | 0.53mi |
| 12001 Old Vine Blvd Lewes, DE | 1.0–2.0 | 1.0–2.0 | 987 | $3,055 | $3.10 | 13d | 17 | 0.57mi |
| 24238 Zinfandel Ln Lewes, DE | 2.0 | 2.0 | 1300 | $2,300 | $1.77 | 43d | 1 | 0.58mi |
| 17010 Minos Conaway Rd Lewes, DE | 3.0 | 2.0 | 1600 | $2,500 | $1.56 | 43d | 1 | 0.74mi |
| 17432 Slipper Shell Way #5 Lewes, DE | 3.0 | 2.0 | 1840 | $2,150 | $1.17 | 21d | 1 | 1.13mi |
| 18 Greystone Dr Lewes, DE | 3.0 | 2.5 | 2114 | $2,875 | $1.36 | 21d | 1 | 1.24mi |
Listing history 3 events
-
2026-06-18days on market $160,000 Coming Soon 2 DOM
-
2026-06-16remarks 693-char remark
-
2026-06-16$160,000 Coming Soon 1 DOM
ⓘ Source: listings_history table (triggers on properties + properties_extension) + one-shot
backfill from property_details.listing_events for pre-trigger history.
Climate risk First Street
- Flood 1/10 Low FEMA zone X (unshaded) · 0% chance over 30 yrs
- Wildfire 1/10 Low
- Heat 8/10 Severe 7 d/yr ≥101°F today · 19 d/yr by 30 yrs out
- Wind 8/10 Severe 80% chance of damaging wind over 30 yrs
- Air quality 2/10 Low 1 unhealthy d/yr today · 1 by 30 yrs out
Nearby sold comps map
Loading sold comps map…
Walkable amenities ~0.75 mi
Loading nearby amenities…
Taxation est. · year 1
- Rental income
- $30,967
- − Mortgage interest
- −$8,962
- − Property taxes
- −$2,400
- − Insurance
- −$800
- − Repairs & maintenance
- −$2,477
- − Management
- −$2,477
- − Depreciation
- −$4,655
- Taxable income
- $9,195
- Est. tax owed @ 24.0%
- −$2,207
- After-tax cash flow
- $8,988/yr
For passive investors: Depreciation is non-cash, so a rental often shows a tax loss while cash-flowing — sheltering income. Rental losses are passive: they offset passive income freely, and up to $25,000/yr can offset ordinary (W-2) income if you actively participate and your MAGI is under $100k (phasing out to $0 by $150k); unused losses carry forward. On sale, claimed depreciation is recaptured at up to 25%, and gains may owe capital-gains tax (a 1031 exchange can defer both). Figures are a year-1 estimate at your 24.0% rate — not tax advice; consult a CPA.
Condition & rehab AI · 11 photos
This 3-bedroom, 2-bath manufactured home in Sussex East/West is in good condition with newer flooring and a well-maintained exterior. It offers a good investment opportunity with potential for cosmetic upgrades to enhance its curb appeal and value.
Value-add opportunities
- Both Painting exterior and interior — Enhances curb appeal and interior aesthetics.
- Both Landscaping improvements — Enhances curb appeal and adds value to the property.
Renovation cost estimate screening
Value-add ROI direction
- Both Painting exterior and interior — Enhances curb appeal and interior aesthetics. ↑
- Both Landscaping improvements — Enhances curb appeal and adds value to the property. ↑
ⓘ Cost ranges are severity-bucket heuristics (US national rule-of-thumb). Get contractor quotes + a written scope before underwriting a rehab budget.
Schools (NCES district)
- District
- Cape Henlopen School District
- NCES district ID
- 1000170
- Math proficiency
- 42% ▼ -14.00%
- Reading proficiency
- 55% ▼ -10.00%
- Median HH income
- $60,196
- Composite
- 42.47/100
- National rank
- #3214
- State rank
- #5 of 26 in DE
Livability — Lewes
- Score
- 67/100
- State rank
- #40
- US rank
- #11077
Category grades
Schools grade is shown separately in the Schools card above.
Census & demographics
- County
- Sussex County · 82,708 people
- City population
- 31,938
- Metro
- Salisbury, MD-DE
- Population (ZIP)
- 31,938
- Household income
- $97,197
- Rent vs Own
- Severe rent burden
- 545.0
Population outlook (Sussex County) Hauer SSP2
- Today (2025)
- 248,853 people
- By 2030
- 264,464 · +6.3%
- By 2040
- 290,980 · +16.9%
- By 2050
- 311,259 · +25.1%
- By 2075
- 352,488 · +41.6%
- By 2100
- 367,406 · +47.6%
Race, ethnicity, and origin ACS 2023
- Neighborhood character
- Predominantly White (88%)
- Race & ethnicity
- White 88% Two or more races 6% Hispanic / Latino 4% Black 2% Asian 2%
- Common ancestry
- Romanian 6% Slovak 3% Italian 2%
- Foreign-born
- 6% · Canada
- Languages at home
- 93% English-only · Spanish 3% Other Indo-European 1% Russian/Polish/Slavic 1%
Political lean MEDSL · Sussex
- 2024 margin
- R (+11.0) · D 43.9% · R 54.9% · Other 1.2%
- 2008→2024 swing
- -2.4pp toward R · 2008: -8.6pp · 2024: -11.0pp
- All cycles
- 2024: R+11.0 2020: R+11.2 2016: R+22.0 2012: R+13.0 2008: R+8.6
Not yet ingested
- Civics
- —
Market trends
- HPI YoY
- ▼ -204.07%
- Current HPI
- 299.0736
- Rent YoY
- ▲ 0.77%
- Metro
- Salisbury, MD-DE
- State GDP YoY
- —
- F500 in state
- 0
Price history
1 event — show timeline
- 2026-06-16 Coming Soon $160,000 BRIGHT MLS
Cash-flow waterfall
monthlySold comps — $/sqft
last 12 mo · ≤1 miLoading sold comps…