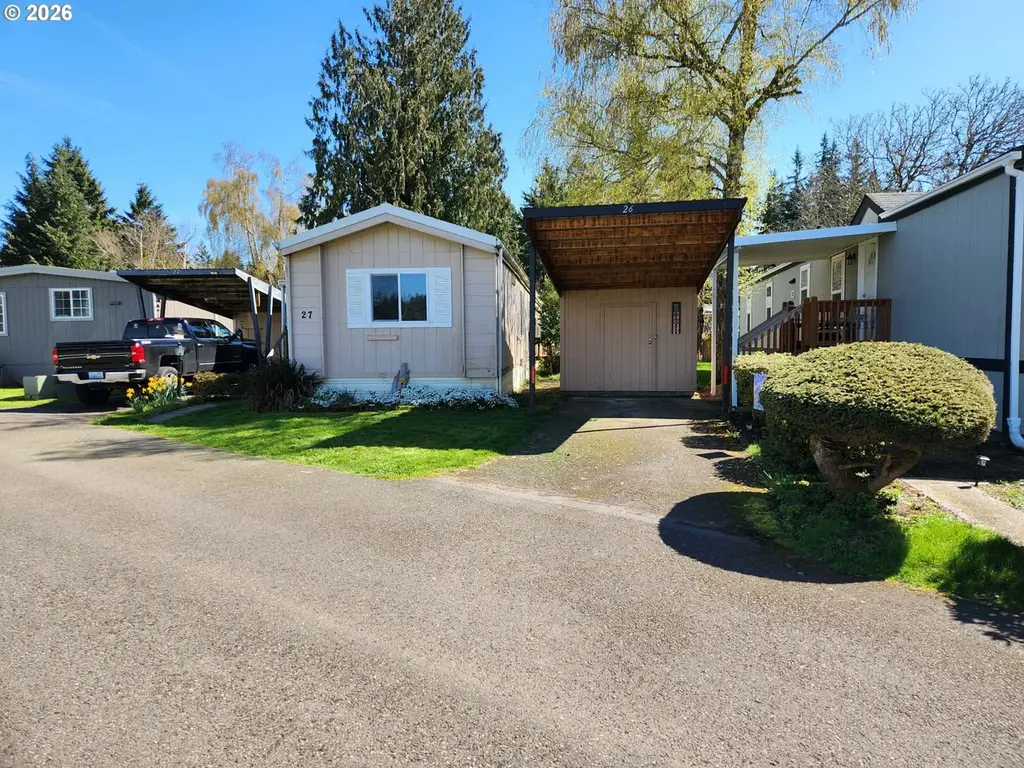
21201 NE 58th St #27 · Camas, WA
Flood risk No data
- FEMA flood zone
- —
- Chance of flooding over 30 yrs
- —
- Est. flood insurance / yr
- —
Fire risk No data
- Est. fire insurance / yr
- —
Heat risk No data
- Hot days now (above threshold)
- —
- Hot days in 30 yrs
- —
Wind risk No data
- Chance of severe wind over 30 yrs
- —
Air-quality risk No data
- Unhealthy air days now
- —
- Unhealthy air days in 30 yrs
- —
Risk factors via First Street. Map © Google.
Why this score? — see what drove the B+ grade
The composite is a weighted blend of 9 inputs, each scored 0–100. Each bar is that input's sub-score; the figure is the points it added to the 100-point composite (weight × sub-score).
- Cash flow +30.0/30.0
- ARV discount +15.0/15.0
- 1% rule +10.0/10.0
- DSCR +10.0/10.0
- Schools +4.3/10.0
- Livability +3.7/5.0
- Rent growth +2.7/5.0
- Condition / age +2.5/5.0
- Appreciation +0.0/10.0
$54,900
🖨 Deal sheet 📄 Offer letter ✓ Due diligence
Listing remarks MLS
Conveniently located just 10 minutes from I-205 and the 192nd corridor for shopping, dining, and Costco. Located in a 55+ community
Key facts
- Dining
- Costco
- Garage
Tags
Neighborhood map
What this means for you Summary
Snapshot
- This is a 3-bed/2.0-bath manufactured listed at $55k.
Deal economics
- At list price, monthly cash flow is $1k ($15k/yr) — positive.
- The deal already cash-flows at list — no discount required.
- Meets the 1% rule at list price ($2k rent vs $55k).
- Recommended offer: $52k (6.0% below list) — sets the bar for market timing.
- Cap rate 34.5% vs local median 1.7% in Camas — top-decile yield for the area; either an underpriced asset or a hidden risk that comps aren't pricing in. Stress-test before assuming the spread holds.
Location & tenants
- Location reads 74/100 on livability (#181 in WA, #4,740 nationally) — a middle-class / working-renter tenant base. Strengths: crime A+, employment A+, housing A+; Watch: amenities F, commute F, cost of living F.
- Evergreen School District (Clark) (urban): math 41% / reading 51% proficiency, ranked #164 of 291 in WA (top 56%) — families likely to look elsewhere, expect single-tenant / working-renter base with shorter leases.
- Market conditions: Rents flat; 461 active listings in the ZIP; solid renter incomes; 3,547 units permitted in Clark County in 2024 (1,361 in 5+ unit buildings).
Forward outlook
- Local home prices are declining (-3.0%/yr); year-one equity from $380 of loan paydown is wiped out by about $2k of value loss. Plan a longer hold.
- Clark County population projected at +29% by 2050 — long-run rental-demand tailwind backs the buy-and-hold thesis.
- At projected returns (-3.0% appreciation + 0.6% rent growth), your $15k cash investment doubles in ~2 years — after that, you're playing with house money.
Negotiation context
- It's been on market 72 days — a 6% lower offer ($52k) is reasonable based on typical stale-listing flexibility.
- 2 sale attempts since 27y ago; this cycle's ask has dropped $5k (8%) from the opening price — seller is motivated, your offer sets the floor, not the list.
- Current owner paid $25k; list at $55k implies a 120% gain — meaningful room to come down on a strong offer.
Questions for the listing agent
- It's been on market 72 days. Have you received any prior offers? Is the seller open to a 6% concession, seller financing, or rate buy-down credit?
- Why hasn't it sold? Are there any deal-killer items the seller is aware of (foundation, flood, title, zoning, code violations)?
- Is there a deadline driving the sale (1031 exchange, divorce, estate, relocation)? That informs how much negotiation room exists.
- Schools are A-rated — typically a magnet for longer-tenancy family renters. What's the average tenant stay here, and is there a school-zone premium baked into asking?
- What's the average days-on-market for RENTAL listings here right now (not sales)? A rising rental-DOM trend means longer vacancies and softer asking-rent achievability than the comps imply.
- What's the recent tenant-quality profile in this submarket — average credit score on applications, eviction rate, late-payment / NSF rate, and stable-employment percentage? A property-management company in the area should have these aggregated.
- How much new for-sale + rental construction is in the pipeline within 1–3 miles? Heavy new supply typically softens prices + rents 12–24 months out; constrained supply supports both.
Investment metrics
- 1% rule
- 3.85% ✓
- Cap rate
- 34.52%
- Cash-on-cash
- 100.82%
- DSCR
- 5.49
- GRM
- 2.2
CMA / ARV
- ARV (median comp)
- $76,745
- List price
- $54,900
- Delta
- -28.46%
- Verdict
- UNDERPRICED
- Comps
- 14 within 1.0 mi
Show comp detail 4 sales within ~0.75 mi
| Address | Dist | Beds/Ba | Sqft | Sold | Price | $/sf | Match |
|---|---|---|---|---|---|---|---|
| 21201 NE 58th St #26 | 0.00mi | 2/2.0 (-1) | 938 (+2%) | 13mo | $114,500 | $122 | 82 |
| 21201 NE 58th St #34 | 0.00mi | 2/1.0 (-1) | 975 (+6%) | 1mo | $75,000 | $77 | 81 |
| 21201 NE 58th St #30 | 0.00mi | 2/1.0 (-1) | 966 (+4%) | 23mo | $105,000 | $109 | 65 |
| 21201 NE 58th St #10 | 0.00mi | 2/2.0 (-1) | 1,008 (+9%) | 19mo | $58,997 | $59 | 64 |
Match score weights: distance 35% · size 25% · config 20% · recency 20%. Top-matched comps best support the ARV.
Projected returns pro-forma
-3.0% appreciation · 0.63% rent growth · sell at horizon
- IRR
- 99.2%
- Equity multiple
- 5.45×
- Total profit
- $68,462
- Equity at exit
- $8,186
- IRR
- —
- Equity multiple
- 10.52×
- Total profit
- $146,379
- Equity at exit
- $4,747
Cash invested: $15,372 (down + closing). Projections, not guarantees.
Landlord ↔ Tenant lean methodology
- Overall (STATE)
- 28 Tenant-Leaning
- State Washington
- 28 Tenant-Leaning · D+8
- County
- — inherits STATE
- City
- — inherits STATE
ZIP-level market 98682
- Rents YoY
- 0.6%
- Active inventory
- 461
- Price-to-rent
- 2.2×
Monthly cashflow live
- Estimated rent
- $2,115 medium interval (Pro) →
- Mortgage (P&I)
- −$288
- Tax est. 1.5%
- −$69 /mo · $824/yr
- Insurance
- −$23
- HOA
- −$0
- Vacancy / Maint / Mgmt
- −$444
- Net cashflow
- $1,291
Break-even live
UW: 25.0% down · 7.5% · 30yr · 1.5% tax · 5.0% vac · 8.0% maint · 8.0% mgmt
Financing live
Cash to close
- Down payment
- $13,725
- Closing costs
- $1,647
- Reserves months
- —
- Total cash needed
- —
Loan-product check · same deal, 3 products live
Conventional
25% down · 7.5% · 30yr
- Down + closing
- —
- Monthly P&I
- —
- Monthly cashflow
- —
- DSCR
- —
- Eligible?
- —
Personal DTI + credit; lowest rate.
DSCR
20% down · 8.5% · 30yr
- Down + closing
- —
- Monthly P&I
- —
- Monthly cashflow
- —
- DSCR
- —
- Eligible?
- —
No personal income docs; deal must DSCR.
Hard money
10% down · 12.0% · 12mo
- Down + closing
- —
- Monthly P&I
- —
- Monthly cashflow
- —
- DSCR
- —
- Eligible?
- —
Short-term bridge; refi at stabilization.
Listing history 16 events
-
2026-06-18days on market $54,900 Active 72 DOM
-
2026-06-17days on market $54,900 Active 71 DOM
-
2026-06-16days on market $54,900 Active 70 DOM
-
2026-06-15pricedays on market $54,900 Active 69 DOM
-
2026-06-13days on market $58,000 Active 67 DOM
-
2026-06-13days on market $58,000 Active 66 DOM
-
2026-06-09days on market $58,000 Active 63 DOM
-
2026-06-08days on market $58,000 Active 62 DOM
-
2026-06-07pricedays on market $58,000 Active 61 DOM
-
2026-06-03days on market $60,000 Active 57 DOM
-
2026-06-02days on market $60,000 Active 56 DOM
-
2026-06-01days on market $60,000 Active 55 DOM
-
2026-05-31days on market $60,000 Active 54 DOM
-
2026-04-07$60,000 Active 131-char remark
Show marketing remark (131 chars)
Conveniently located just 10 minutes from I-205 and the 192nd corridor for shopping, dining, and Costco. Located in a 55+ community
-
1999-08-25soldstatus $24,900 185-char remark
Show marketing remark (185 chars)
SUBJECT TO PARK MANAGERS APPROVAL. 1984 FLEETWOOD 14X66. 2 BR/2 BT. NEWER CARPETS, NEWER STANDING STEEL ROOF-WELL MAINTAINED, NEAT, CLEAN, SKYLIGHT. NO DOGS OR CATS. NON SMOKER HOME.
-
1999-06-28$24,900 185-char remark
Show marketing remark (185 chars)
SUBJECT TO PARK MANAGERS APPROVAL. 1984 FLEETWOOD 14X66. 2 BR/2 BT. NEWER CARPETS, NEWER STANDING STEEL ROOF-WELL MAINTAINED, NEAT, CLEAN, SKYLIGHT. NO DOGS OR CATS. NON SMOKER HOME.
ⓘ Source: listings_history table (triggers on properties + properties_extension) + one-shot
backfill from property_details.listing_events for pre-trigger history.
Nearby sold comps map
Loading sold comps map…
Walkable amenities ~0.75 mi
Loading nearby amenities…
Taxation est. · year 1
- Rental income
- $25,380
- − Mortgage interest
- −$3,075
- − Property taxes
- −$824
- − Insurance
- −$274
- − Repairs & maintenance
- −$2,030
- − Management
- −$2,030
- − Depreciation
- −$1,597
- Taxable income
- $15,549
- Est. tax owed @ 24.0%
- −$3,732
- After-tax cash flow
- $11,766/yr
For passive investors: Depreciation is non-cash, so a rental often shows a tax loss while cash-flowing — sheltering income. Rental losses are passive: they offset passive income freely, and up to $25,000/yr can offset ordinary (W-2) income if you actively participate and your MAGI is under $100k (phasing out to $0 by $150k); unused losses carry forward. On sale, claimed depreciation is recaptured at up to 25%, and gains may owe capital-gains tax (a 1031 exchange can defer both). Figures are a year-1 estimate at your 24.0% rate — not tax advice; consult a CPA.
Schools (NCES district)
- District
- Evergreen School District (Clark)
- NCES district ID
- 5302700
- Math proficiency
- 41% ▼ -3.00%
- Reading proficiency
- 51% ▼ -3.00%
- Median HH income
- $59,418
- Composite
- 42.53/100
- National rank
- #6859
- State rank
- #164 of 291 in WA
Livability — Camas
- Score
- 74/100
- State rank
- #181
- US rank
- #4740
Category grades
Schools grade is shown separately in the Schools card above.
Census & demographics
- County
- Clark County · 513,189 people
- City population
- 35,867
- Metro
- Portland-Vancouver-Hillsboro, OR-WA
- Population (ZIP)
- 68,305
- Household income
- $99,918
- Rent vs Own
- Severe rent burden
- 1618.0
Population outlook (Clark County) Hauer SSP2
- Today (2025)
- 529,610 people
- By 2030
- 563,242 · +6.4%
- By 2040
- 625,905 · +18.2%
- By 2050
- 681,558 · +28.7%
- By 2075
- 805,967 · +52.2%
- By 2100
- 877,450 · +65.7%
Race, ethnicity, and origin ACS 2023
- Neighborhood character
- Predominantly White (69%)
- Race & ethnicity
- White 69% Hispanic / Latino 15% Two or more races 13% Asian 6% Black 2% Pacific Islander 1%
- Hispanic origin (detail)
- Mexican 12%
- Common ancestry
- Portuguese 3% Subsaharan African 3% Scotch-Irish 2%
- Foreign-born
- 13% · Canada, Vietnam, South Korea
- Languages at home
- 79% English-only · Spanish 8% Russian/Polish/Slavic 6% Other Asian/Pacific 2%
Political lean MEDSL · Clark
- 2024 margin
- Lean D (+7.0) · D 52.1% · R 45.1% · Other 2.8%
- 2008→2024 swing
- +0.9pp no change · 2008: 6.1pp · 2024: 7.0pp
- All cycles
- 2024: D+7.0 2020: D+5.1 2016: D+0.1 2012: D+0.1 2008: D+6.1
Not yet ingested
- Civics
- —
Market trends
- HPI YoY
- ▼ -303.95%
- Current HPI
- 307.0529
- Rent YoY
- ▲ 0.63%
- Metro
- Portland-Vancouver-Hillsboro, OR-WA
- State GDP YoY
- ▲ 4.65%
- F500 in state
- 22
Industry mix (Fortune 500 HQ in WA)
| Industry | F500 HQs | Revenue |
|---|---|---|
| Retail | 2 | $269B |
|
||
| Technology / Retail | 1 | $638B |
|
||
| Technology | 1 | $245B |
|
||
| Telecommunications | 1 | $38B |
|
||
| Food / Beverage | 1 | $36B |
|
||
| Automotive / Trucks | 1 | $34B |
|
||
Price history
+141.0% since first listed3 events — show timeline
- 2026-04-07 Listed $60,000 RMLS
- 1999-08-25 Sold (MLS) $24,900 RMLS
- 1999-06-28 Listed $24,900 RMLS
Property tax history
-2.3%/yrLatest (2026): $101 · +34.7% YoY. Source: county tax records.
Cash-flow waterfall
monthlySold comps — $/sqft
last 12 mo · ≤1 miLoading sold comps…