 🏗️ New Construction
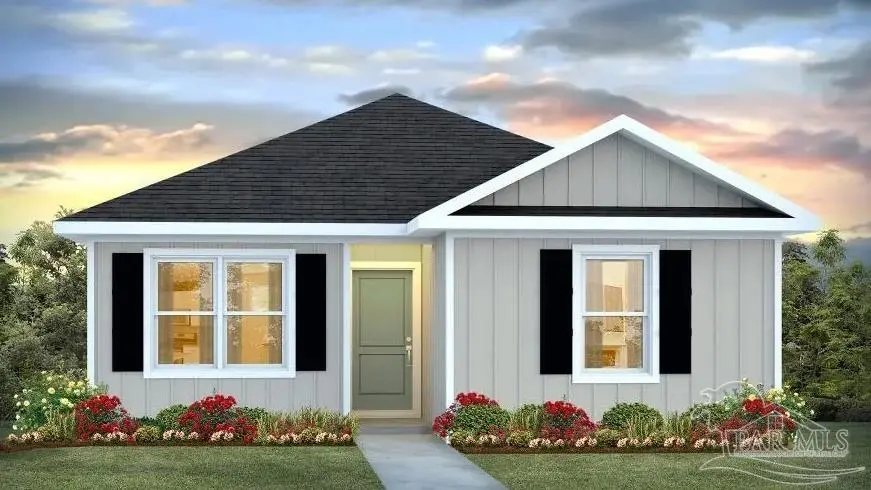
6557 Firefly Dr · Bagdad, FL
Flood risk No data
- FEMA flood zone
- —
- Chance of flooding over 30 yrs
- —
- Est. flood insurance / yr
- —
Fire risk No data
- Est. fire insurance / yr
- —
Heat risk No data
- Hot days now (above threshold)
- —
- Hot days in 30 yrs
- —
Wind risk No data
- Chance of severe wind over 30 yrs
- —
Air-quality risk No data
- Unhealthy air days now
- —
- Unhealthy air days in 30 yrs
- —
Risk factors via First Street. Map © Google.
Why this score? — see what drove the D grade
The composite is a weighted blend of 9 inputs, each scored 0–100. Each bar is that input's sub-score; the figure is the points it added to the 100-point composite (weight × sub-score).
- Cash flow +12.1/30.0
- ARV discount +7.5/15.0
- Schools +5.3/10.0
- Condition / age +4.0/5.0
- 1% rule +3.8/10.0
- DSCR +3.6/10.0
- Rent growth +3.6/5.0
- Livability +3.4/5.0
- Appreciation +0.0/10.0
$270,900
🖨 Deal sheet (PDF) 📄 Offer letter ✓ Due diligence
Listing remarks
The charming Rivers Cove community offers residents use of it's gorgeous Community Pool, Community Room and Playground. The ''Sullivan'' plan is a cozy cottage style home with no wasted space, a desirable open design for relaxed living. A stylish 4-bedroom, 2-bath home, plus a large storage room. Easy care beautiful wood look flooring, delightful kitchen with stainless appliances, quiet dishwasher, smooth top range, built in microwave and pantry. Also included is Fabric hurricane door/window protection and a Smart Home 'Connect' system with several convenient Smart Home Devices.
Key facts
- Community pool
- Smooth top range
- Stainless appliances
Tags
Property features AI
Finance
- HOA & community: Community association with an annual fee of $655; Community amenities include a pool, community room, and sidewalks
Exterior
- Parking: Driveway with open parking
- Security: Smoke detectors
- Utilities: Public water; Public sewer; Electric service with circuit breakers and copper wiring
- Home design: Single-story home; One-level entry; Not attached to another property; Under construction / New construction
- Construction: Frame construction; Shingle roof; Slab foundation; Built as new construction
- Exterior features: Porch; Interior lot; Paved road access; Private maintained road
Interior
- Kitchen: Laminate counters; Pantry; Built-in microwave; Dishwasher; Electric water heater
- Bedrooms: Primary bedroom on the first floor
- Flooring: Vinyl
- Bathrooms: 2 full bathrooms; Bathrooms are new construction/not updated
- Heating & cooling: Central heating; Central air conditioning
- Interior features: Baseboards; Double-pane windows; Storm windows; Shutters
- Laundry & utility: Laundry inside with washer/dryer hookups
Neighborhood map
What this means for you Summary
Snapshot
- This is a 4-bed/2.0-bath single-family listed at $271k. Condition is rated good.
Deal economics
- At list price, monthly cash flow is $-54 ($-652/yr) — negative.
- To cash-flow at today's rent, offer at most $244k (9.9% below list).
- To meet the 1% rule (rent ≥ 1% of price), the offer needs to be $220k (18.7% below list).
- Recommended offer: $220k (18.7% below list) — sets the bar for 1% rule.
Location & tenants
- Location reads 67/100 on livability (#571 in FL) — a middle-class / working-renter tenant base. Strengths: crime A+, cost of living A+, housing A+; Watch: schools F, amenities F, commute F.
- Santa Rosa (suburban): math 63% / reading 60% proficiency, ranked #8 of 73 in FL (top 11%) — acceptable for families but not a draw, mixed tenant base, ~2y average lease.
- Market conditions: Rents rising fast (+4.5%/yr); 806 active listings in the ZIP; 5 comparable units currently listed for rent nearby; rentals at typical pace (median 24d on market — plan ~3-4 weeks tenant-placement turnaround); solid renter incomes; 1,983 units permitted in Santa Rosa County in 2024 (128 in 5+ unit buildings).
- This rent runs 31% of the median local income ($85k/yr) — at the standard rent-burdened threshold; future hikes will face affordability resistance.
Forward outlook
- Local home prices are declining (-3.0%/yr); year-one equity from $2k of loan paydown is wiped out by about $8k of value loss. Plan a longer hold.
- Santa Rosa County population projected at +31% by 2050 — long-run rental-demand tailwind backs the buy-and-hold thesis.
Negotiation context
- It's been on market 18 days — a 2% lower offer ($267k) is reasonable based on typical stale-listing flexibility.
Questions for the listing agent
- What do current leases actually rent for vs. the listed asking? Can we see a recent rent roll and the last 12 months of T-12 income?
- What does the HOA fee cover, when was the last increase, and are there any pending special assessments or reserve-fund shortfalls?
- Is there a deadline driving the sale (1031 exchange, divorce, estate, relocation)? That informs how much negotiation room exists.
- Schools are F-rated, which usually means shorter tenancies and higher turnover. Who's the typical renter profile here, and what's been the actual vacancy rate?
- The area grade is low — what's the realistic commute time and amenity access for the typical tenant pool here? Any planned neighborhood developments (good or bad) we should know about?
- What's the average days-on-market for RENTAL listings here right now (not sales)? A rising rental-DOM trend means longer vacancies and softer asking-rent achievability than the comps imply.
- What's the recent tenant-quality profile in this submarket — average credit score on applications, eviction rate, late-payment / NSF rate, and stable-employment percentage? A property-management company in the area should have these aggregated.
- How much new for-sale + rental construction is in the pipeline within 1–3 miles? Heavy new supply typically softens prices + rents 12–24 months out; constrained supply supports both.
Investment metrics
- 1% rule
- 0.88% ✗
- Cap rate
- 6.03%
- Cash-on-cash
- -0.93%
- DSCR
- 0.96
- GRM
- 9.5
CMA / ARV
- ARV (on-the-fly)
- $251,825
- Comps found
- 12
Show comp detail 12 sales within ~0.75 mi
| Address | Dist | Beds/Ba | Sqft | Sold | Price | $/sf | Match |
|---|---|---|---|---|---|---|---|
| 6501 Firefly Dr | 0.00mi | 4/2.0 | 1,439 (0%) | 0mo | $250,000 | $174 | 100 |
| 6513 Firefly Dr | 0.00mi | 4/2.0 | 1,439 (0%) | 0mo | $259,900 | $181 | 100 |
| 6505 Firefly Dr | 0.00mi | 4/2.0 | 1,439 (0%) | 2mo | $249,900 | $174 | 98 |
| 6465 Firefly Dr | 0.01mi | 4/2.0 | 1,439 (0%) | 2mo | $249,900 | $174 | 98 |
| 6485 Firefly Dr | 0.01mi | 4/2.0 | 1,439 (0%) | 2mo | $249,900 | $174 | 98 |
| 6477 Firefly Dr | 0.01mi | 4/2.0 | 1,439 (0%) | 3mo | $249,900 | $174 | 98 |
| 6516 Firefly Dr | 0.00mi | 3/2.0 (-1) | 1,568 (+9%) | 1mo | $279,900 | $179 | 79 |
| 6496 Firefly Dr | 0.00mi | 3/2.0 (-1) | 1,568 (+9%) | 2mo | $281,900 | $180 | 79 |
| 6432 Firefly Dr | 0.01mi | 3/2.0 (-1) | 1,568 (+9%) | 2mo | $277,900 | $177 | 78 |
| 6468 Firefly Dr | 0.01mi | 3/2.0 (-1) | 1,568 (+9%) | 3mo | $274,900 | $175 | 77 |
| 6400 Firefly Dr | 0.41mi | 3/2.0 (-1) | 1,568 (+9%) | 4mo | $274,000 | $175 | 58 |
| 6604 Woodbrook Ct | 0.75mi | 3/2.0 (-1) | 1,414 (-2%) | 3mo | $275,000 | $194 | 55 |
Match score weights: distance 35% · size 25% · config 20% · recency 20%. Top-matched comps best support the ARV.
Projected returns pro-forma
-3.0% appreciation · 4.53% rent growth · sell at horizon
- IRR
- -16.0%
- Equity multiple
- 0.42×
- Total profit
- $-40,758
- Equity at exit
- $37,548
- IRR
- -5.1%
- Equity multiple
- 0.64×
- Total profit
- $-25,096
- Equity at exit
- $21,773
Cash invested: $70,511 (down + closing). Projections, not guarantees.
Landlord ↔ Tenant lean methodology
- Overall (STATE)
- 87 Strongly Landlord-Friendly
- State Florida
- 87 Strongly Landlord-Friendly · R+3
- County
- — inherits STATE
- City
- — inherits STATE
ZIP-level market 32583
- Home prices YoY
- -11.3%
- Rents YoY
- 4.5%
- Active inventory
- 806
- Price-to-rent
- 10.2×
Monthly cashflow live
- Estimated rent
- $2,204 high interval (Pro) →
- Mortgage (P&I)
- −$1,321
- Tax est. 1.5%
- −$315 /mo · $3,777/yr
- Insurance
- −$105
- HOA
- −$55
- Vacancy / Maint / Mgmt
- −$463
- Net cashflow
- $-54
Break-even live
Sensitivity live
| Price | -10% $120 | -5% $33 | +0% $-54 | +5% $-141 | +10% $-228 |
|---|---|---|---|---|---|
| Rent | -10% $-228 | -5% $-141 | +0% $-54 | +5% $33 | +10% $120 |
| Rate | -1.0pp $72 | -0.5pp $10 | base $-54 | +0.5pp $-120 | +1.0pp $-186 |
UW: 25.0% down · 7.5% · 30yr · 1.5% tax · 5.0% vac · 8.0% maint · 8.0% mgmt
Financing live
Cash to close
- Down payment
- $62,956
- Closing costs
- $7,555
- Reserves months
- —
- Total cash needed
- —
Loan-product check · same deal, 3 products live
Conventional
25% down · 7.5% · 30yr
- Down + closing
- —
- Monthly P&I
- —
- Monthly cashflow
- —
- DSCR
- —
- Eligible?
- —
Personal DTI + credit; lowest rate.
DSCR
20% down · 8.5% · 30yr
- Down + closing
- —
- Monthly P&I
- —
- Monthly cashflow
- —
- DSCR
- —
- Eligible?
- —
No personal income docs; deal must DSCR.
Hard money
10% down · 12.0% · 12mo
- Down + closing
- —
- Monthly P&I
- —
- Monthly cashflow
- —
- DSCR
- —
- Eligible?
- —
Short-term bridge; refi at stabilization.
Rent comps 5 comps
| Address | Beds | Baths | Sqft | Rent | $/sqft | DOM | Units | Dist |
|---|---|---|---|---|---|---|---|---|
| 6317 Firefly Dr Milton, FL | 4.0 | 2.0 | 1439 | $2,000 | $1.39 | 21d | 1 | 0.24mi |
| 4170 Roosevelt Way Milton, FL | 3.0 | 2.0 | 1760 | $1,850 | $1.05 | 24d | 1 | 0.58mi |
| 6478 Da Lisa Rd Milton, FL | 3.0 | 2.0 | 1120 | $1,900 | $1.70 | 24d | 1 | 0.88mi |
| 6607 Woodbury Forest Dr Milton, FL | 4.0 | 2.0 | 1680 | $1,900 | $1.13 | 24d | 1 | 0.88mi |
| 4718 Lemoyne Vista Dr Milton, FL | 3.0 | 2.0 | 1550 | $1,795 | $1.16 | 24d | 1 | 1.36mi |
HOA detail
- Monthly dues
- $55 · $660/yr
- Likely covers
- pool
Listing history 14 events
-
2026-06-18days on market $270,900 Active 18 DOM
-
2026-06-17days on market $270,900 Active 17 DOM
-
2026-06-16days on market $270,900 Active 16 DOM
-
2026-06-15days on market $270,900 Active 15 DOM
-
2026-06-14days on market $270,900 Active 13 DOM
-
2026-06-10days on market $270,900 Active 10 DOM
-
2026-06-09days on market $270,900 Active 9 DOM
-
2026-06-08days on market $270,900 Active 8 DOM
-
2026-06-07days on market $270,900 Active 7 DOM
-
2026-06-05days on market $270,900 Active 4 DOM
-
2026-06-03days on market $270,900 Active 3 DOM
-
2026-06-02days on market $270,900 Active 2 DOM
-
2026-06-01remarks 585-char remark
-
2026-06-01$270,900 Active 1 DOM
ⓘ Source: listings_history table (triggers on properties + properties_extension) + one-shot
backfill from property_details.listing_events for pre-trigger history.
Nearby sold comps map
Loading sold comps map…
Walkable amenities ~0.75 mi
Loading nearby amenities…
Taxation est. · year 1
- Rental income
- $26,445
- − Mortgage interest
- −$14,106
- − Property taxes
- −$3,777
- − Insurance
- −$1,259
- − Repairs & maintenance
- −$2,116
- − Management
- −$2,116
- − HOA
- −$660
- − Depreciation
- −$7,326
- Taxable loss
- −$4,915
- Est. tax savings @ 24.0%
- +$1,180
- After-tax cash flow
- $527/yr
For passive investors: Depreciation is non-cash, so a rental often shows a tax loss while cash-flowing — sheltering income. Rental losses are passive: they offset passive income freely, and up to $25,000/yr can offset ordinary (W-2) income if you actively participate and your MAGI is under $100k (phasing out to $0 by $150k); unused losses carry forward. On sale, claimed depreciation is recaptured at up to 25%, and gains may owe capital-gains tax (a 1031 exchange can defer both). Figures are a year-1 estimate at your 24.0% rate — not tax advice; consult a CPA.
Condition & rehab AI · 12 photos
This home is in good condition with a well-maintained exterior and interior. It has a good location with access to a community pool and other amenities.
Value-add opportunities
- Both Painting the exterior — Enhances curb appeal and can increase both resale and rental value
- Both Landscaping improvements — Improves curb appeal and can increase both resale and rental value
- Both Community pool access — Access to a community pool can increase both resale and rental value
Renovation cost estimate screening
Value-add ROI direction
- Both Painting the exterior — Enhances curb appeal and can increase both resale and rental value ↑
- Both Landscaping improvements — Improves curb appeal and can increase both resale and rental value ↑
- Both Community pool access — Access to a community pool can increase both resale and rental value ↑
ⓘ Cost ranges are severity-bucket heuristics (US national rule-of-thumb). Get contractor quotes + a written scope before underwriting a rehab budget.
Schools (NCES district)
- District
- Santa Rosa
- NCES district ID
- 1201650
- Math proficiency
- 63% ▼ -6.00%
- Reading proficiency
- 60% ▼ -5.00%
- Median HH income
- $58,161
- Composite
- 53.12/100
- National rank
- #1511
- State rank
- #8 of 73 in FL
Livability — Bagdad
- Score
- 67/100
- State rank
- #571
- US rank
- #10887
Category grades
Schools grade is shown separately in the Schools card above.
Census & demographics
- Census place
- Bagdad, FL
- County
- Santa Rosa County · 194,764 people
- Metro
- Pensacola-Ferry Pass-Brent, FL
- Population (ZIP)
- 31,828
- Household income
- $85,440
- Rent vs Own
- Severe rent burden
- 122.0
Population outlook (Santa Rosa County) Hauer SSP2
- Today (2025)
- 195,978 people
- By 2030
- 209,782 · +7.0%
- By 2040
- 235,293 · +20.1%
- By 2050
- 256,408 · +30.8%
- By 2075
- 298,074 · +52.1%
- By 2100
- 303,216 · +54.7%
Race, ethnicity, and origin ACS 2023
- Neighborhood character
- Predominantly White (74%)
- Race & ethnicity
- White 74% Black 11% Two or more races 10% Hispanic / Latino 6% Asian 1%
- Hispanic origin (detail)
- Mexican 3% Puerto Rican 2% Cuban 1%
- Common ancestry
- Italian 3% Slovak 2% Serbian 2%
- Foreign-born
- 3% · Canada
- Languages at home
- 94% English-only · Spanish 3%
Political lean MEDSL · Santa Rosa
- 2024 margin
- Solid R (+51.0) · D 24.1% · R 75.0%
- 2008→2024 swing
- -3.0pp toward R · 2008: -47.9pp · 2024: -51.0pp
- All cycles
- 2024: R+51.0 2020: R+46.5 2016: R+53.5 2012: R+52.6 2008: R+47.9
Not yet ingested
- Civics
- —
Market trends
- HPI YoY
- ▼ -38.35%
- Current HPI
- 301.8819
- Rent YoY
- ▲ 4.53%
- Metro
- Pensacola-Ferry Pass-Brent, FL
- State GDP YoY
- ▲ 3.28%
- F500 in state
- 36
Industry mix (Fortune 500 HQ in FL)
| Industry | F500 HQs | Revenue |
|---|---|---|
| Industrial Technology | 2 | $29B |
|
||
| Insurance | 2 | $17B |
|
||
| Retail | 1 | $60B |
|
||
| Technology Distribution | 1 | $58B |
|
||
| Homebuilding | 1 | $35B |
|
||
| Technology Manufacturing | 1 | $35B |
|
||
Price history
1 event — show timeline
- 2026-05-31 Listed $270,900 PARMLS
Cash-flow waterfall
monthlySold comps — $/sqft
last 12 mo · ≤1 miLoading sold comps…