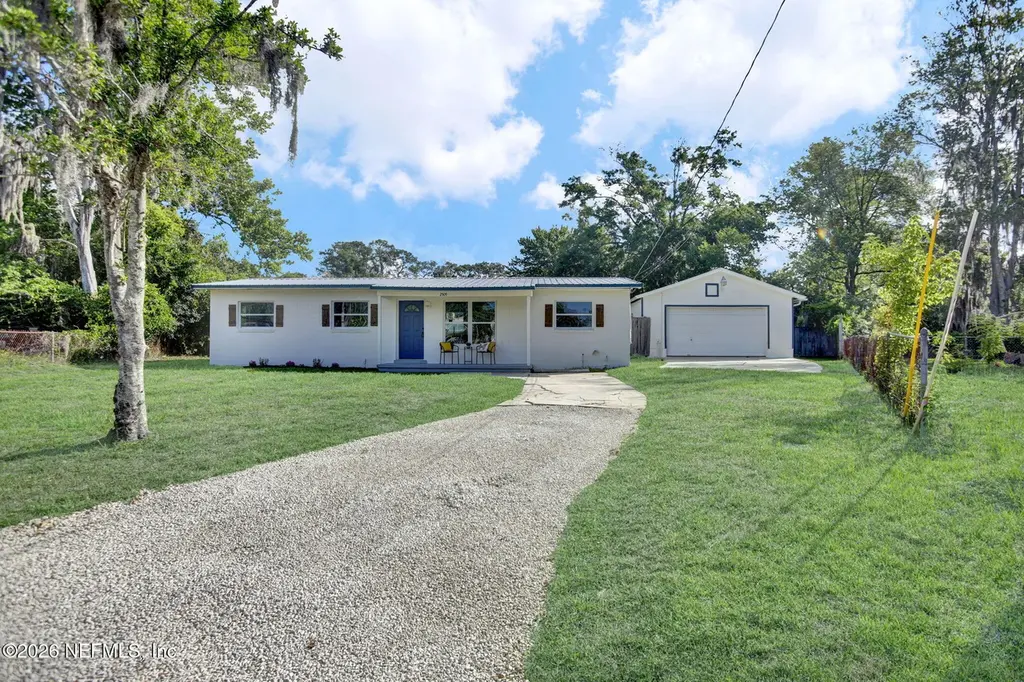
2509 Wilmont Ct · Jacksonville, FL
Flood risk 5/10 · Moderate
- FEMA flood zone
- X (unshaded)
- Chance of flooding over 30 yrs
- 0.24%
- Est. flood insurance / yr
- $507 – $1,088
Fire risk 4/10 · Minor
- Est. fire insurance / yr
- $947 – $1,759
Heat risk 9/10 · Severe
- Hot days now (above 107°F)
- 7 days/yr
- Hot days in 30 yrs
- 20 days/yr
Wind risk 9/10 · Severe
- Chance of severe wind over 30 yrs
- 99.0%
Air-quality risk 4/10 · Minor
- Unhealthy air days now
- 6 days/yr
- Unhealthy air days in 30 yrs
- 6 days/yr
Risk factors via First Street. Map © Google.
Why this score? — see what drove the D- grade
The composite is a weighted blend of 9 inputs, each scored 0–100. Each bar is that input's sub-score; the figure is the points it added to the 100-point composite (weight × sub-score).
- Cash flow +14.1/30.0
- DSCR +4.3/10.0
- Livability +4.2/5.0
- Schools +3.9/10.0
- 1% rule +2.8/10.0
- ARV discount +2.7/15.0
- Condition / age +2.5/5.0
- Rent growth +2.4/5.0
- Appreciation +0.0/10.0
$219,900
🖨 Deal sheet 📄 Offer letter ✓ Due diligence
Listing remarks
Welcome to this beautifully renovated 3 bedroom 2 bathroom home nestled on a quiet 0.3 acre lot in an amazing neighborhood. This charming home checks every box: a fully updated brand new kitchen with stainless steel appliances, open-concept living, and a spacious master suite with walk-in closet. The oversized detached 2-car garage with electric is a rare find, and the fully fenced yard gives you privacy and room to entertain your friends and family. Sip your morning coffee on the beautiful front porch or entertain guests on the spacious back patio -- this home was made for living. Natural light pours in throughout, brand new flooring recently installed and the laundry/utility room offers g
Key facts
- Master suite
- Walk-in closet
- Renovated kitchen
Tags
Property features AI
Finance
- HOA & community: Not a senior community
Exterior
- Parking: Detached garage; 2-car garage; Additional parking; RV access/parking
- Utilities: Public sewer; Electricity connected; Sewer connected; Water connected
- Home design: Single family residence; One story; Entry on level 1
- Construction: Concrete construction; Metal roof
- Exterior features: Patio; Back yard fence; Shed(s); Workshop
Interior
- Kitchen: Dishwasher; Electric cooktop; Electric oven; Refrigerator; Breakfast bar / eat-in kitchen
- Bedrooms: 3 bedrooms
- Bathrooms: 2 full bathrooms
- Interior features: Breakfast bar; Built-in features; Eat-in kitchen; Open floor plan; Walk-in closets
- Laundry & utility: Washer and dryer included; Washer hookup; Electric dryer hookup; In-unit laundry
Neighborhood map
What this means for you Summary
Snapshot
- This is a 3-bed/2.0-bath single-family listed at $220k.
Deal economics
- At list price, monthly cash flow is $34 ($404/yr) — positive.
- The deal already cash-flows at list — no discount required.
- To meet the 1% rule (rent ≥ 1% of price), the offer needs to be $171k (22.3% below list).
- Recommended offer: $171k (22.3% below list) — sets the bar for 1% rule.
- Cap rate 6.5% vs local median 4.0% in Jacksonville — top-decile yield for the area; either an underpriced asset or a hidden risk that comps aren't pricing in. Stress-test before assuming the spread holds.
Location & tenants
- Location reads 83/100 on livability (#50 in FL, #911 nationally) — a professional / high-income tenant draw. Strengths: amenities A+, commute A+, housing A+.
- Duval (urban): math 46% / reading 45% proficiency, ranked #48 of 73 in FL (top 66%) — families likely to look elsewhere, expect single-tenant / working-renter base with shorter leases.
- Zoned schools: Highlands Elementary School (math 32% / reading 27%, grade F, #1,896 of 2,144 statewide, top 90%, 475 students, 78% FRL); Highlands Middle School (math 31% / reading 21%, grade F, #506 of 571 statewide, top 89%, 697 students, 73% FRL); First Coast High School (math 18% / reading 33%, grade F, #499 of 667 statewide, top 75%, 2,117 students, 49% FRL) — zoned schools average 66% FRL vs 49% district-wide (17 pts higher); higher-poverty schools than district average — tighter screening recommended.
- Zoned-school proficiency averages 27% at this address vs 46% district-wide (-18 pts) — the specific schools serving this property underperform the Duval average; the district grade overstates school quality for this exact location.
- Market conditions: Rents soft (-0.4%/yr); 728 active listings in the ZIP; 34 comparable units currently listed for rent nearby; rentals at typical pace (median 16d on market — plan ~3-4 weeks tenant-placement turnaround); 6,503 units permitted in Duval County in 2024 (1,131 in 5+ unit buildings).
Forward outlook
- Local home prices are declining (-3.0%/yr); year-one equity from $2k of loan paydown is wiped out by about $7k of value loss. Plan a longer hold.
- Duval County population projected at +19% by 2050 — long-run rental-demand tailwind backs the buy-and-hold thesis.
Negotiation context
- It's been on market 15 days — a 2% lower offer ($217k) is reasonable based on typical stale-listing flexibility.
- Current owner paid $45k; list at $220k implies a 389% gain — meaningful room to come down on a strong offer.
Risks & watch-outs
- Watch-outs: built in 1959 — expect roof / HVAC / electrical / plumbing capex.
- Climate carrying-cost: moderate flood risk; severe wind risk, 99% chance of damaging wind over 30y; extreme-heat days projected 7→20/yr by 2055 (HVAC capex compounding) — expect insurance premiums to compound above CPI over the hold.
Questions for the listing agent
- Built in 1959 — when were the roof, HVAC, electrical panel, plumbing, and water heater last replaced?
- Is there a deadline driving the sale (1031 exchange, divorce, estate, relocation)? That informs how much negotiation room exists.
- Schools are B-rated — typically a magnet for longer-tenancy family renters. What's the average tenant stay here, and is there a school-zone premium baked into asking?
- The area grade is low — what's the realistic commute time and amenity access for the typical tenant pool here? Any planned neighborhood developments (good or bad) we should know about?
- What's the average days-on-market for RENTAL listings here right now (not sales)? A rising rental-DOM trend means longer vacancies and softer asking-rent achievability than the comps imply.
- What's the recent tenant-quality profile in this submarket — average credit score on applications, eviction rate, late-payment / NSF rate, and stable-employment percentage? A property-management company in the area should have these aggregated.
- How much new for-sale + rental construction is in the pipeline within 1–3 miles? Heavy new supply typically softens prices + rents 12–24 months out; constrained supply supports both.
Investment metrics
- 1% rule
- 0.78% ✗
- Cap rate
- 6.48%
- Cash-on-cash
- 0.66%
- DSCR
- 1.03
- GRM
- 10.7
CMA / ARV
- ARV (on-the-fly)
- $198,528
- Comps found
- 12
Show comp detail 12 sales within ~0.75 mi
| Address | Dist | Beds/Ba | Sqft | Sold | Price | $/sf | Match |
|---|---|---|---|---|---|---|---|
| 2480 Drake Ave | 0.09mi | 3/1.0 | 984 (-7%) | 7mo | $164,000 | $167 | 75 |
| 2434 Leonid Rd | 0.24mi | 3/1.0 | 1,132 (+7%) | 2mo | $179,900 | $159 | 71 |
| 10553 Tulsa Rd | 0.12mi | 3/2.0 | 975 (-8%) | 18mo | $235,000 | $241 | 66 |
| 2904 Jerry Ln | 0.60mi | 2/1.0 (-1) | 1,059 (+0%) | 2mo | $200,000 | $189 | 61 |
| 2864 Leonid Rd | 0.36mi | 3/2.0 | 1,160 (+10%) | 9mo | $170,000 | $147 | 60 |
| 10503 Rutgers Rd | 0.51mi | 3/1.0 | 1,036 (-2%) | 12mo | $195,000 | $188 | 59 |
| 2312 Leonid Rd | 0.37mi | 3/1.5 | 1,132 (+7%) | 14mo | $165,000 | $146 | 57 |
| 3040 Date St | 0.71mi | 3/2.0 | 1,040 (-2%) | 13mo | $155,000 | $149 | 54 |
| 1821 Wofford Ave | 0.61mi | 4/1.0 (+1) | 1,080 (+2%) | 10mo | $209,900 | $194 | 50 |
| 1934 Leonid Rd | 0.55mi | 3/2.0 | 1,008 (-4%) | 21mo | $210,000 | $208 | 49 |
| 2915 Tinsley Rd | 0.47mi | 3/2.0 | 1,209 (+14%) | 15mo | $252,000 | $208 | 42 |
| 1820 Leonid Rd | 0.64mi | 3/2.0 | 1,194 (+13%) | 22mo | $216,000 | $181 | 30 |
Match score weights: distance 35% · size 25% · config 20% · recency 20%. Top-matched comps best support the ARV.
Projected returns pro-forma
-3.0% appreciation · 0.0% rent growth · sell at horizon
- IRR
- -18.3%
- Equity multiple
- 0.37×
- Total profit
- $-38,593
- Equity at exit
- $32,788
- IRR
- -16.8%
- Equity multiple
- 0.18×
- Total profit
- $-50,590
- Equity at exit
- $19,013
Cash invested: $61,572 (down + closing). Projections, not guarantees.
Landlord ↔ Tenant lean methodology
- Overall (STATE)
- 87 Strongly Landlord-Friendly
- State Florida
- 87 Strongly Landlord-Friendly · R+3
- County
- — inherits STATE
- City
- — inherits STATE
ZIP-level market 32218
- Home prices YoY
- -25.7%
- Rents YoY
- -0.4%
- Active inventory
- 728
- Price-to-rent
- 10.7×
Monthly cashflow live
- Estimated rent
- $1,708 high interval (Pro) →
- Mortgage (P&I)
- −$1,153
- Tax from tax record
- −$71 /mo · $848/yr
- Insurance
- −$92
- HOA
- −$0
- Vacancy / Maint / Mgmt
- −$359
- Net cashflow
- $34
Break-even live
UW: 25.0% down · 7.5% · 30yr · 1.5% tax · 5.0% vac · 8.0% maint · 8.0% mgmt
Financing live
Cash to close
- Down payment
- $54,975
- Closing costs
- $6,597
- Reserves months
- —
- Total cash needed
- —
Loan-product check · same deal, 3 products live
Conventional
25% down · 7.5% · 30yr
- Down + closing
- —
- Monthly P&I
- —
- Monthly cashflow
- —
- DSCR
- —
- Eligible?
- —
Personal DTI + credit; lowest rate.
DSCR
20% down · 8.5% · 30yr
- Down + closing
- —
- Monthly P&I
- —
- Monthly cashflow
- —
- DSCR
- —
- Eligible?
- —
No personal income docs; deal must DSCR.
Hard money
10% down · 12.0% · 12mo
- Down + closing
- —
- Monthly P&I
- —
- Monthly cashflow
- —
- DSCR
- —
- Eligible?
- —
Short-term bridge; refi at stabilization.
Rent comps 34 comps
| Address | Beds | Baths | Sqft | Rent | $/sqft | DOM | Units | Dist |
|---|---|---|---|---|---|---|---|---|
| 2482 Quail Ave Jacksonville, FL | 3.0 | 2.0 | 1224 | $1,850 | $1.51 | 17d | 1 | 0.12mi |
| 2462 Quail Ave Jacksonville, FL | 3.0 | 1.5 | 1312 | $1,397 | $1.06 | 23d | 1 | 0.14mi |
| 2489 Quail Ave Jacksonville, FL | 3.0 | 2.0 | 1308 | $1,495 | $1.14 | 23d | 1 | 0.15mi |
| 2489 Quail Ave Jacksonville, FL | 3.0 | 2.0 | 1306 | $1,495 | $1.14 | 16d | 1 | 0.15mi |
| 10735 Merida Dr #14 Jacksonville, FL | 4.0 | 2.0 | 1303 | $1,635 | $1.25 | 7d | 1 | 0.25mi |
| 10535 Lem Turner Rd Jacksonville, FL | 1.0–4.0 | 1.0–2.0 | 1012 | $1,562 | $1.54 | 3d | 40 | 0.38mi |
| 2950 Bessent Rd Jacksonville, FL | 3.0 | 2.0 | 1446 | $1,779 | $1.23 | 21d | 1 | 0.54mi |
| 2978 Centerwood Dr Jacksonville, FL | 3.0 | 2.0 | 1437 | $1,805 | $1.26 | 23d | 1 | 0.54mi |
| 3029 Bessent Rd Jacksonville, FL | 3.0 | 2.0 | 1330 | $1,750 | $1.32 | 3d | 1 | 0.65mi |
| 11211 Margarets Landing Pl Jacksonville, FL | 3.0 | 2.0 | 1280 | $1,826 | $1.43 | 7d | 1 | 0.85mi |
| 1601 Dunn Ave Jacksonville, FL | 1.0–3.0 | 1.0–2.0 | 852 | $1,575 | $1.85 | 3d | 12 | 0.86mi |
| 11029 Traci Lynn Dr Jacksonville, FL | 3.0 | 2.0 | 1402 | $1,550 | $1.11 | 4d | 1 | 0.87mi |
| 2445 Dunn Ave Jacksonville, FL | 1.0–3.0 | 1.0–2.0 | 850 | $1,815 | $2.14 | 1d | 11 | 0.95mi |
| 9565 Carbondale Dr W Unit B Jacksonville, FL | 3.0 | 2.0 | 1400 | $2,000 | $1.43 | 23d | 1 | 1.04mi |
| 11332 Island Shore Dr W Jacksonville, FL | 3.0 | 1.5 | 1178 | $1,703 | $1.45 | 4d | 1 | 1.05mi |
| 1333 Dunn Ave Jacksonville, FL | 2.0 | 1.0 | 576 | $1,185 | $2.06 | 1d | 16 | 1.07mi |
| 11386 Margarets Landing Pl Jacksonville, FL | 3.0 | 2.0 | 1280 | $1,821 | $1.42 | 21d | 1 | 1.08mi |
| 10529 Keuka Dr Jacksonville, FL | 4.0 | 1.0 | 1101 | $600 | $0.54 | 7d | 1 | 1.08mi |
| 12802 Haverford Rd Jacksonville, FL | 1.0–3.0 | 1.0–2.0 | 1000 | $1,299 | $1.30 | 1d | 15 | 1.12mi |
| 10561 Ashby Rd Jacksonville, FL | 3.0 | 1.0 | 1034 | $1,181 | $1.14 | 23d | 1 | 1.18mi |
| 2346 Blossom Ridge Dr N Jacksonville, FL | 3.0 | 2.0 | 1334 | $1,819 | $1.36 | 10d | 1 | 1.21mi |
| 10964 Bacall Rd W Jacksonville, FL | 3.0 | 1.5 | 1138 | $1,550 | $1.36 | 23d | 1 | 1.25mi |
| 10310 Briarcliff Rd E Jacksonville, FL | 3.0 | 2.0 | 1285 | $1,399 | $1.09 | 14d | 1 | 1.25mi |
| 1123 Depaul Dr Jacksonville, FL | 3.0 | 1.5 | 1152 | $1,295 | $1.12 | 21d | 1 | 1.30mi |
| 9131 Jefferson Ave Jacksonville, FL | 3.0 | 1.0 | 910 | $1,350 | $1.48 | 4d | 1 | 1.30mi |
| 2389 Hilly Rd Jacksonville, FL | 3.0 | 1.0 | 908 | $1,650 | $1.82 | 23d | 1 | 1.31mi |
| 3216 Duane Ave Jacksonville, FL | 2.0 | 1.0 | 748 | $1,098 | $1.47 | 7d | 1 | 1.33mi |
| 9124 Adams Ave Jacksonville, FL | 3.0 | 3.0 | 1207 | $1,800 | $1.49 | 23d | 1 | 1.36mi |
| 1033 Ake Ln Jacksonville, FL | 3.0 | 1.0 | 868 | $1,200 | $1.38 | 21d | 1 | 1.38mi |
| 3025 Armstrong St Jacksonville, FL | 3.0 | 2.0 | 1120 | $1,461 | $1.30 | 20d | 1 | 1.40mi |
| 9279 6th Ave Jacksonville, FL | 3.0 | 2.0 | 1150 | $1,245 | $1.08 | 4d | 1 | 1.41mi |
| 12154 Alexandra Dr Jacksonville, FL | 3.0 | 2.0 | 1275 | $1,700 | $1.33 | 4d | 1 | 1.43mi |
| 9131 4th Ave Jacksonville, FL | 3.0 | 2.0 | 1209 | $1,496 | $1.24 | 21d | 1 | 1.47mi |
| 9346 10th Ave Jacksonville, FL | 3.0 | 1.0 | 985 | $1,825 | $1.85 | 23d | 1 | 1.49mi |
Listing history 8 events
-
2026-06-07statusdays on market $219,900 Pending 15 DOM
-
2026-06-05days on market $219,900 Active Under Contract 14 DOM
-
2026-06-03days on market $219,900 Active Under Contract 13 DOM
-
2026-06-02days on market $219,900 Active Under Contract 12 DOM
-
2026-06-01days on market $219,900 Active Under Contract 11 DOM
-
2026-05-31days on market $219,900 Active Under Contract 10 DOM
-
2026-05-21$219,900 Active
-
1989-11-01soldstatus $45,000
ⓘ Source: listings_history table (triggers on properties + properties_extension) + one-shot
backfill from property_details.listing_events for pre-trigger history.
Tax reassessment forecast FL · Resets to sale price
- Current annual tax
- $848 · $71/mo
- Projected year-2 tax
- $1,825 · $152/mo
- Expected delta
- +$978/yr (+$81/mo · 115.3%)
ⓘ Screening estimate from a state-policy table — verify with the county assessor before closing.
Climate risk First Street
- Flood 5/10 Major FEMA zone X (unshaded) · 24% chance over 30 yrs
- Wildfire 4/10 Moderate
- Heat 9/10 Extreme 7 d/yr ≥107°F today · 20 d/yr by 30 yrs out
- Wind 9/10 Extreme 99% chance of damaging wind over 30 yrs
- Air quality 4/10 Moderate 6 unhealthy d/yr today · 6 by 30 yrs out
Nearby sold comps map
Loading sold comps map…
Walkable amenities ~0.75 mi
Loading nearby amenities…
Taxation est. · year 1
- Rental income
- $20,493
- − Mortgage interest
- −$12,318
- − Property taxes
- −$848
- − Insurance
- −$1,100
- − Repairs & maintenance
- −$1,639
- − Management
- −$1,639
- − Depreciation
- −$6,397
- Taxable loss
- −$3,448
- Est. tax savings @ 24.0%
- +$828
- After-tax cash flow
- $1,232/yr
For passive investors: Depreciation is non-cash, so a rental often shows a tax loss while cash-flowing — sheltering income. Rental losses are passive: they offset passive income freely, and up to $25,000/yr can offset ordinary (W-2) income if you actively participate and your MAGI is under $100k (phasing out to $0 by $150k); unused losses carry forward. On sale, claimed depreciation is recaptured at up to 25%, and gains may owe capital-gains tax (a 1031 exchange can defer both). Figures are a year-1 estimate at your 24.0% rate — not tax advice; consult a CPA.
Schools (NCES district)
- District
- Duval
- NCES district ID
- 1200480
- Math proficiency
- 46% ▼ -11.00%
- Reading proficiency
- 45% ▼ -4.00%
- Median HH income
- $48,987
- Composite
- 38.97/100
- National rank
- #4076
- State rank
- #48 of 73 in FL
Livability — Jacksonville
- Score
- 83/100
- State rank
- #50
- US rank
- #911
Category grades
Schools grade is shown separately in the Schools card above.
Census & demographics
- Census place
- Jacksonville, FL
- County
- Duval County · 1,015,274 people
- City population
- 979,034
- Metro
- Jacksonville, FL
- Population (ZIP)
- 72,905
- Household income
- $69,638
- Rent vs Own
- Severe rent burden
- 2289.0
Population outlook (Duval County) Hauer SSP2
- Today (2025)
- 1,013,010 people
- By 2030
- 1,059,228 · +4.6%
- By 2040
- 1,141,439 · +12.7%
- By 2050
- 1,205,258 · +19.0%
- By 2075
- 1,324,282 · +30.7%
- By 2100
- 1,319,620 · +30.3%
Race, ethnicity, and origin ACS 2023
- Neighborhood character
- Diverse neighborhood (Simpson 0.64)
- Race & ethnicity
- Black 48% White 35% Hispanic / Latino 9% Two or more races 8% Asian 2%
- Hispanic origin (detail)
- Mexican 2% Puerto Rican 4%
- Common ancestry
- Slovak 1% Lithuanian 1% Italian 1%
- Foreign-born
- 6% · Canada, Jamaica, Vietnam
- Languages at home
- 89% English-only · Spanish 6% French/Haitian/Cajun 1% Tagalog/Filipino 1%
Political lean MEDSL · Duval
- 2024 margin
- Toss-up / Even · D 48.7% · R 50.1% · Other 1.2%
- 2008→2024 swing
- +0.4pp no change · 2008: -1.9pp · 2024: -1.5pp
- All cycles
- 2024: R+1.5 2020: D+3.8 2016: R+1.5 2012: R+3.6 2008: R+1.9
Not yet ingested
- Civics
- —
Market trends
- HPI YoY
- ▼ -90.73%
- Current HPI
- 262.2329
- Rent YoY
- ▼ -0.40%
- Metro
- Jacksonville, FL
- State GDP YoY
- ▲ 3.28%
- F500 in state
- 36
Industry mix (Fortune 500 HQ in FL)
| Industry | F500 HQs | Revenue |
|---|---|---|
| Industrial Technology | 2 | $29B |
|
||
| Insurance | 2 | $17B |
|
||
| Retail | 1 | $60B |
|
||
| Technology Distribution | 1 | $58B |
|
||
| Homebuilding | 1 | $35B |
|
||
| Technology Manufacturing | 1 | $35B |
|
||
Price history
+388.7% since first listed2 events — show timeline
- 2026-05-21 Listed $219,900 realMLS
- 1989-11-01 Sold (Public Records) $45,000 Public Records
Property tax history
+4.8%/yrLatest (2025): $848 · +26.7% YoY. Source: county tax records.
Cash-flow waterfall
monthlySold comps — $/sqft
last 12 mo · ≤1 miLoading sold comps…