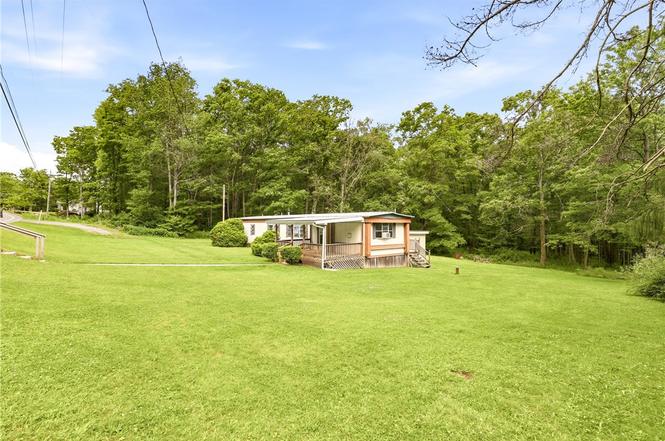
2640 Cumberland Hwy · Larimer, PA
Flood risk 1/10 · Minimal
- FEMA flood zone
- X (unshaded)
- Chance of flooding over 30 yrs
- 0.0%
- Est. flood insurance / yr
- $473 – $860
Fire risk 4/10 · Minor
- Est. fire insurance / yr
- $511 – $949
Heat risk 1/10 · Minimal
- Hot days now (above 89°F)
- 6 days/yr
- Hot days in 30 yrs
- 15 days/yr
Wind risk 2/10 · Minimal
- Chance of severe wind over 30 yrs
- —
Air-quality risk 2/10 · Minimal
- Unhealthy air days now
- 1 days/yr
- Unhealthy air days in 30 yrs
- 1 days/yr
Risk factors via First Street. Map © Google.
Why this score? — see what drove the D grade
The composite is a weighted blend of 9 inputs, each scored 0–100. Each bar is that input's sub-score; the figure is the points it added to the 100-point composite (weight × sub-score).
- Cash flow +10.5/30.0
- ARV discount +7.5/15.0
- Appreciation +7.1/10.0
- Schools +4.3/10.0
- DSCR +3.0/10.0
- Rent growth +2.5/5.0
- Livability +2.5/5.0
- Condition / age +2.5/5.0
- 1% rule +1.9/10.0
$125,000
🖨 Deal sheet (PDF) 📄 Offer letter ✓ Due diligence
Listing remarks
Welcome to 2640 Cumberland Highway! Situated on a nice chunk of land, this well-maintained manufactured home offers the perfect blend of country living and convenience. Enjoy a spacious lot with room for gardening, recreation, or simply taking in the peaceful surroundings. Inside, you'll find comfortable one level living with an open layout designed for everyday functionality. Whether you're looking for a primary residence, downsizing, or seeking an affordable home with land, this property offers plenty of potential. Conveniently located just minutes from Meyersdale, Berlin and major routes while still providing a private, rural setting. Don't miss this opportunity to own a move in ready ho
Key facts
- Acreage
- Spacious lot
- Open layout
Tags
Property features AI
Exterior
- Utilities: Well water; Septic tank
- Home design: Single-family residence; One-story
- Construction: Aluminum siding
- Exterior features: Metal roof; Lot is approximately 2.49 acres; Residential zoning
Interior
- Bathrooms: 1 full bathroom
- Heating & cooling: Forced air heating; Oil fuel
- Interior features: Forced air heating (oil)
Neighborhood map
What this means for you Summary
Snapshot
- This is a 2-bed/1.0-bath manufactured listed at $125k.
Deal economics
- At list price, monthly cash flow is $-64 ($-764/yr) — negative.
- To cash-flow at today's rent, offer at most $114k (9.0% below list).
- To meet the 1% rule (rent ≥ 1% of price), the offer needs to be $86k (31.1% below list).
- Recommended offer: $86k (31.1% below list) — sets the bar for 1% rule.
Location & tenants
- Location reads: area grade D — affects rentability + tenant quality, not the cash-flow math above.
- Meyersdale Area SD (rural): math 38% / reading 64% proficiency, ranked #177 of 539 in PA (top 33%) — acceptable for families but not a draw, mixed tenant base, ~2y average lease.
- Zoned schools: Meyersdale Area El Sch (math 42% / reading 62%, grade C-, #586 of 1,518 statewide, top 42%, 320 students, 60% FRL); Meyersdale Area Ms (math 27% / reading 62%, grade D, #194 of 512 statewide, top 39%, 186 students, 57% FRL); Meyersdale Area Hs (math 64% / reading 74%, grade B, #49 of 437 statewide, top 12%, 271 students, 36% FRL).
- Market conditions: 26 active listings in the ZIP; 78 units permitted in Somerset County in 2024 (0 in 5+ unit buildings).
Forward outlook
- In year one you build about $6k of equity ($864 loan paydown + $5k appreciation (4.1% local appreciation)).
- Somerset County population projected at -21% by 2050 — secular population decline; favor cash flow + early exit over multi-decade hold.
- At projected returns (4.1% appreciation + 3.0% rent growth), your $35k cash investment doubles in ~6 years — after that, you're playing with house money.
- By year 6, paydown + projected appreciation supports a ~$32k cash-out refi (75% LTV) — recoverable capital for the next deal without selling this one.
Negotiation context
- Only 7 days on market — expect competitive offers; lowballing is unlikely to land.
Questions for the listing agent
- What do current leases actually rent for vs. the listed asking? Can we see a recent rent roll and the last 12 months of T-12 income?
- Built in 1976 — when were the roof, HVAC, electrical panel, plumbing, and water heater last replaced?
- Is there a deadline driving the sale (1031 exchange, divorce, estate, relocation)? That informs how much negotiation room exists.
- The area grade is low — what's the realistic commute time and amenity access for the typical tenant pool here? Any planned neighborhood developments (good or bad) we should know about?
- What's the average days-on-market for RENTAL listings here right now (not sales)? A rising rental-DOM trend means longer vacancies and softer asking-rent achievability than the comps imply.
- What's the recent tenant-quality profile in this submarket — average credit score on applications, eviction rate, late-payment / NSF rate, and stable-employment percentage? A property-management company in the area should have these aggregated.
- How much new for-sale + rental construction is in the pipeline within 1–3 miles? Heavy new supply typically softens prices + rents 12–24 months out; constrained supply supports both.
Investment metrics
- 1% rule
- 0.69% ✗
- Cap rate
- 5.68%
- Cash-on-cash
- -2.18%
- DSCR
- 0.90
- GRM
- 12.1
CMA / ARV
No comps found within radius.
Projected returns pro-forma
4.11% appreciation · 3.0% rent growth · sell at horizon
- IRR
- 8.6%
- Equity multiple
- 1.53×
- Total profit
- $18,476
- Equity at exit
- $64,217
- IRR
- 10.6%
- Equity multiple
- 2.79×
- Total profit
- $62,521
- Equity at exit
- $105,707
Cash invested: $35,000 (down + closing). Projections, not guarantees.
Landlord ↔ Tenant lean methodology
- Overall (STATE)
- 62 Landlord-Friendly
- State Pennsylvania
- 62 Landlord-Friendly · EVEN
- County
- — inherits STATE
- City
- — inherits STATE
ZIP-level market 15552
- Home prices YoY
- 2.8%
- Active inventory
- 26
- Price-to-rent
- 12.1×
Monthly cashflow live
- Estimated rent
- $861 medium interval (Pro) →
- Mortgage (P&I)
- −$656
- Tax from tax record
- −$36 /mo · $433/yr
- Insurance
- −$52
- HOA
- −$0
- Vacancy / Maint / Mgmt
- −$181
- Net cashflow
- $-64
Break-even live
Sensitivity live
| Price | -10% $7 | -5% $-28 | +0% $-64 | +5% $-99 | +10% $-134 |
|---|---|---|---|---|---|
| Rent | -10% $-132 | -5% $-98 | +0% $-64 | +5% $-30 | +10% $4 |
| Rate | -1.0pp $-1 | -0.5pp $-32 | base $-64 | +0.5pp $-96 | +1.0pp $-129 |
UW: 25.0% down · 7.5% · 30yr · 1.5% tax · 5.0% vac · 8.0% maint · 8.0% mgmt
Financing live
Cash to close
- Down payment
- $31,250
- Closing costs
- $3,750
- Reserves months
- —
- Total cash needed
- —
Loan-product check · same deal, 3 products live
Conventional
25% down · 7.5% · 30yr
- Down + closing
- —
- Monthly P&I
- —
- Monthly cashflow
- —
- DSCR
- —
- Eligible?
- —
Personal DTI + credit; lowest rate.
DSCR
20% down · 8.5% · 30yr
- Down + closing
- —
- Monthly P&I
- —
- Monthly cashflow
- —
- DSCR
- —
- Eligible?
- —
No personal income docs; deal must DSCR.
Hard money
10% down · 12.0% · 12mo
- Down + closing
- —
- Monthly P&I
- —
- Monthly cashflow
- —
- DSCR
- —
- Eligible?
- —
Short-term bridge; refi at stabilization.
Listing history 8 events
-
2026-06-21days on market $125,000 Active 7 DOM
-
2026-06-21days on market $125,000 Active 6 DOM
-
2026-06-18days on market $125,000 Active 4 DOM
-
2026-06-17days on market $125,000 Active 3 DOM
-
2026-06-16days on market $125,000 Active 2 DOM
-
2026-06-15$125,000 Active 1 DOM
-
2026-06-12remarks 699-char remark
-
2026-06-12$125,000 Active 1 DOM
ⓘ Source: listings_history table (triggers on properties + properties_extension) + one-shot
backfill from property_details.listing_events for pre-trigger history.
Tax reassessment forecast PA · Partial reset (capped growth)
- Current annual tax
- $433 · $36/mo
- Projected year-2 tax
- $1,204 · $100/mo
- Expected delta
- +$771/yr (+$64/mo · 178.2%)
ⓘ Screening estimate from a state-policy table — verify with the county assessor before closing.
Climate risk First Street
- Flood 1/10 Low FEMA zone X (unshaded) · 0% chance over 30 yrs
- Wildfire 4/10 Moderate
- Heat 1/10 Low 6 d/yr ≥89°F today · 15 d/yr by 30 yrs out
- Wind 2/10 Low
- Air quality 2/10 Low 1 unhealthy d/yr today · 1 by 30 yrs out
Nearby sold comps map
Loading sold comps map…
Walkable amenities ~0.75 mi
Loading nearby amenities…
Taxation est. · year 1
- Rental income
- $10,330
- − Mortgage interest
- −$7,002
- − Property taxes
- −$433
- − Insurance
- −$625
- − Repairs & maintenance
- −$826
- − Management
- −$826
- − Depreciation
- −$3,636
- Taxable loss
- −$3,019
- Est. tax savings @ 24.0%
- +$725
- After-tax cash flow
- $-39/yr
For passive investors: Depreciation is non-cash, so a rental often shows a tax loss while cash-flowing — sheltering income. Rental losses are passive: they offset passive income freely, and up to $25,000/yr can offset ordinary (W-2) income if you actively participate and your MAGI is under $100k (phasing out to $0 by $150k); unused losses carry forward. On sale, claimed depreciation is recaptured at up to 25%, and gains may owe capital-gains tax (a 1031 exchange can defer both). Figures are a year-1 estimate at your 24.0% rate — not tax advice; consult a CPA.
Schools (NCES district)
- District
- Meyersdale Area SD
- NCES district ID
- 4215150
- Math proficiency
- 38% ▼ -12.00%
- Reading proficiency
- 64% ▼ -6.00%
- Median HH income
- $42,823
- Composite
- 42.83/100
- National rank
- #3137
- State rank
- #177 of 539 in PA
Livability — Larimer
No livability data for this city. (Only ~50 U.S. cities are tracked.)
Census & demographics
- Population (ZIP)
- 5,551
Population outlook (Somerset County) Hauer SSP2
- Today (2025)
- 71,318 people
- By 2030
- 68,555 · -3.9%
- By 2040
- 62,447 · -12.4%
- By 2050
- 56,437 · -20.9%
- By 2075
- 44,453 · -37.7%
- By 2100
- 32,408 · -54.6%
Race, ethnicity, and origin ACS 2023
- Neighborhood character
- Predominantly White (97%)
- Race & ethnicity
- White 97% Two or more races 2%
- Common ancestry
- Iranian 2% Polish 2% Lithuanian 2%
- Languages at home
- 88% English-only · German/W. Germanic 12% Spanish 1%
Political lean MEDSL · Somerset
- 2024 margin
- Solid R (+57.2) · D 21.0% · R 78.3%
- 2008→2024 swing
- -32.2pp toward R · 2008: -25.0pp · 2024: -57.2pp
- All cycles
- 2024: R+57.2 2020: R+56.3 2016: R+55.9 2012: R+42.9 2008: R+25.0
Not yet ingested
- Civics
- —
Market trends
- HPI YoY
- ▲ 4.11%
- Current HPI
- 153.4081
- Rent YoY
- —
- Metro
- —
- State GDP YoY
- ▲ 1.68%
- F500 in state
- 34
Industry mix (Fortune 500 HQ in PA)
| Industry | F500 HQs | Revenue |
|---|---|---|
| Healthcare | 2 | $309B |
|
||
| Insurance | 2 | $27B |
|
||
| Telecommunications / Media | 1 | $124B |
|
||
| Industrial Distribution | 1 | $22B |
|
||
| Financial Services | 1 | $20B |
|
||
| Chemicals / Materials | 1 | $18B |
|
||
Price history
1 event — show timeline
- 2026-06-12 Listed $125,000 CSMLS
Property tax history
+2.0%/yrLatest (2026): $433 · +2.7% YoY. Source: county tax records.
Cash-flow waterfall
monthlySold comps — $/sqft
last 12 mo · ≤1 miLoading sold comps…