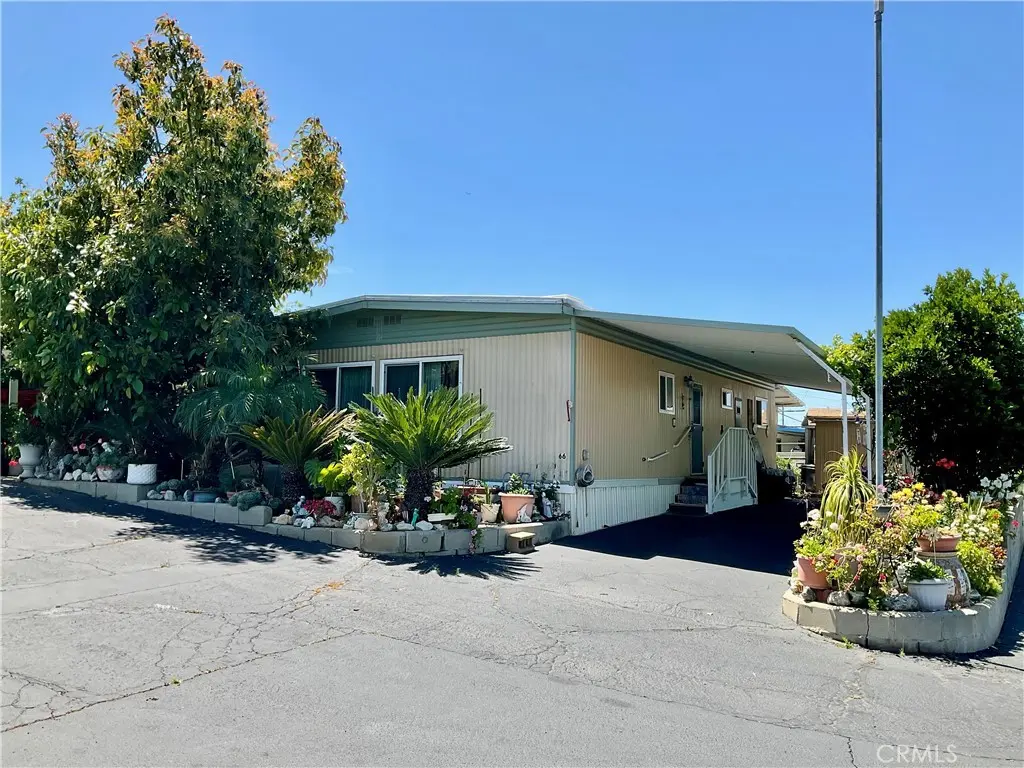
12995 6th #66 · Yucaipa, CA
Flood risk 1/10 · Minimal
- FEMA flood zone
- X (unshaded)
- Chance of flooding over 30 yrs
- 0.0%
- Est. flood insurance / yr
- $507 – $1,088
Fire risk 9/10 · Severe
- Est. fire insurance / yr
- $659 – $1,223
Heat risk 6/10 · Moderate
- Hot days now (above 100°F)
- 7 days/yr
- Hot days in 30 yrs
- 20 days/yr
Wind risk 1/10 · Minimal
- Chance of severe wind over 30 yrs
- —
Air-quality risk 10/10 · Severe
- Unhealthy air days now
- 30 days/yr
- Unhealthy air days in 30 yrs
- 37 days/yr
Risk factors via First Street. Map © Google.
Why this score? — see what drove the C grade
The composite is a weighted blend of 9 inputs, each scored 0–100. Each bar is that input's sub-score; the figure is the points it added to the 100-point composite (weight × sub-score).
- Cash flow +29.0/30.0
- DSCR +10.0/10.0
- 1% rule +8.1/10.0
- Schools +3.8/10.0
- Livability +3.3/5.0
- Condition / age +2.5/5.0
- Rent growth +2.2/5.0
- ARV discount +0.0/15.0
- Appreciation +0.0/10.0
$133,000
🖨 Deal sheet 📄 Offer letter ✓ Due diligence
Listing remarks
Remodeled and upgraded double-wide 2-bed/2-bath home located in Valley View Mobile Home Park, a Senior community (55+) in Yucaipa. Home is well-maintained and includes an open floor plan, newer laminate flooring throughout, double pane window, ceiling fans & remodeled kitchen with a beautiful built-in island. The kitchen opens directly into the living room and includes a 6-burner gas range, custom quartz countertops & backsplash, a huge center island with breakfast bar, lots of cabinet space and stainless steel appliances. Nice Master bedroom size with mirrored closet doors and ceiling fan & remodeled master bathroom. The guest bath has been upgraded and features a shower
Key facts
- Remodeled kitchen
- Built-in island
- Huge center island
Tags
Property features AI
Finance
- Other: Manager approval required for multi-unit/pets — contact park for pet policy
- Financial info: Land lease amount applies
- HOA & community: Located in Valley View Mobile Home Park; Senior community; Community features: sidewalks, suburban setting; Land lease applies
Exterior
- Parking: Paved parking; Carport (attached); 2 parking spaces (including 2 garage spaces)
- Security: Smoke and carbon monoxide detectors
- Utilities: Electricity on property (standard, 220V for spa); Natural gas connected; Water connected (district/public); Public sewer; Cable connected
- Home design: Mobile home (24' x 40') — mobile home remains; Double body type; One story; Northeast facing; Updated / remodeled with additions/alterations; Zero lot line on a corner, irregular-shaped lot; Manual sprinklers; Has a view; Two or more access exits
- Construction: Roof: foam, fiberglass, flat, elastomeric, fire-retardant; Construction: drywall walls, blown insulation; Foundation skirt: aluminum
- Exterior features: Covered, enclosed slab patio; Awning; Rain gutters; In-ground community pool; Storage building / shed; Aluminum skirting
Interior
- Kitchen: Kitchen open to family room; Remodeled kitchen with quartz counters; Kitchen island; High-efficiency water heater; Energy Star appliances; Built-in range; Free-standing range / 6-burner stove; Gas oven and gas cooktop
- Bedrooms: Primary bedroom; All bedrooms on one level
- Flooring: Tile floors; Laminate floors
- Bathrooms: One full bath; One 3/4 bath; Soaking tub; Shower in tub (bathtub and shower)
- Heating & cooling: Forced air heating; Central furnace; Heat pump; Ductless cooling; Electric cooling
- Interior features: Wired for data and sound; Quartz counters; Copper partial plumbing; Ceiling fan; Open floor plan; Coffered ceilings; Sliding glass doors; Insulated doors; Mirrored closet doors; Panel doors; Double-pane windows; Window coverings (drapes/curtains, blinds); Carbon monoxide and smoke detectors; Private above-ground spa
- Laundry & utility: Washer/dryer hookups (gas and electric dryer hookup); Laundry located outside
Neighborhood map
What this means for you Summary
Snapshot
- This is a 2-bed/2.0-bath manufactured listed at $133k.
Deal economics
- At list price, monthly cash flow is $454 ($5k/yr) — positive.
- The deal already cash-flows at list — no discount required.
- Meets the 1% rule at list price ($2k rent vs $133k).
- Recommended offer: $129k (3.0% below list) — sets the bar for market timing.
- Cap rate 10.4% vs local median 2.7% in Yucaipa — top-decile yield for the area; either an underpriced asset or a hidden risk that comps aren't pricing in. Stress-test before assuming the spread holds.
Location & tenants
- Location reads 66/100 on livability (#334 in CA) — a middle-class / working-renter tenant base. Strengths: housing A+, employment B+; Watch: schools D, health & safety D, amenities F.
- Yucaipa-Calimesa Joint Unified (suburban): math 32% / reading 55% proficiency, ranked #195 of 517 in CA (top 38%) — families likely to look elsewhere, expect single-tenant / working-renter base with shorter leases.
- Market conditions: Rents soft (-1.3%/yr); 205 active listings in the ZIP; 25 comparable units currently listed for rent nearby; rentals lingering (median 44d on market — plan ~5-8 weeks vacancy on turnover, expect pricing pressure); 56% of comp listings sitting > 30 days — soft ceiling on asking rent; solid renter incomes; 5,458 units permitted in San Bernardino County in 2024 (1,500 in 5+ unit buildings).
Forward outlook
- Local home prices are declining (-3.0%/yr); year-one equity from $920 of loan paydown is wiped out by about $4k of value loss. Plan a longer hold.
- San Bernardino County population projected at +15% by 2050 — modest demand growth; plan on rents tracking national, not racing it.
Negotiation context
- It's been on market 56 days — a 3% lower offer ($129k) is reasonable based on typical stale-listing flexibility.
- 12 sale attempts since 21y ago with the ask held roughly flat each time — persistent listings suggest the price (not the market) is what's stuck; bring a comps-based counter.
- Current owner paid $35k; list at $133k implies a 280% gain — meaningful room to come down on a strong offer.
Risks & watch-outs
- Climate carrying-cost: severe wildfire risk; extreme-heat days projected 7→20/yr by 2055 (HVAC capex compounding) — expect insurance premiums to compound above CPI over the hold.
Questions for the listing agent
- It's been on market 56 days. Have you received any prior offers? Is the seller open to a 3% concession, seller financing, or rate buy-down credit?
- Built in 1968 — when were the roof, HVAC, electrical panel, plumbing, and water heater last replaced?
- Is there a deadline driving the sale (1031 exchange, divorce, estate, relocation)? That informs how much negotiation room exists.
- Schools are D-rated, which usually means shorter tenancies and higher turnover. Who's the typical renter profile here, and what's been the actual vacancy rate?
- What's the average days-on-market for RENTAL listings here right now (not sales)? A rising rental-DOM trend means longer vacancies and softer asking-rent achievability than the comps imply.
- What's the recent tenant-quality profile in this submarket — average credit score on applications, eviction rate, late-payment / NSF rate, and stable-employment percentage? A property-management company in the area should have these aggregated.
- How much new for-sale + rental construction is in the pipeline within 1–3 miles? Heavy new supply typically softens prices + rents 12–24 months out; constrained supply supports both.
Investment metrics
- 1% rule
- 1.31% ✓
- Cap rate
- 10.39%
- Cash-on-cash
- 14.62%
- DSCR
- 1.65
- GRM
- 6.4
CMA / ARV
- ARV (median comp)
- $95,442
- List price
- $133,000
- Delta
- 39.35%
- Verdict
- OVERPRICED
- Comps
- 20 within 1.0 mi
Show comp detail 10 sales within ~0.75 mi
| Address | Dist | Beds/Ba | Sqft | Sold | Price | $/sf | Match |
|---|---|---|---|---|---|---|---|
| 12995 6th St #71 | 0.00mi | 2/2.0 | 960 (0%) | 0mo | $117,000 | $122 | 100 |
| 12995 6th #9 | 0.06mi | 2/2.0 | 880 (-8%) | 4mo | $160,000 | $182 | 79 |
| 12830 6TH St #67 | 0.34mi | 2/2.0 | 976 (+2%) | 9mo | $100,000 | $102 | 74 |
| 34111 Wildwood Canyon Rd #136 | 0.25mi | 2/2.0 | 1,080 (+12%) | 1mo | $150,000 | $139 | 66 |
| 33600 Calimesa Blvd SPC # 159 | 0.60mi | 2/2.0 | 960 (0%) | 13mo | $71,500 | $74 | 61 |
| 13063 5th St #5 | 0.23mi | 2/1.0 | 864 (-10%) | 12mo | $39,999 | $46 | 58 |
| 34111 Wildwood Canyon Rd #33 | 0.19mi | 3/2.0 (+1) | 1,056 (+10%) | 17mo | $163,400 | $155 | 55 |
| 12813 7th St #5 | 0.44mi | 2/2.0 | 1,080 (+12%) | 15mo | $50,000 | $46 | 46 |
| 12830 6TH St #5 | 0.26mi | 2/1.5 | 840 (-12%) | 24mo | $114,900 | $137 | 45 |
| 33848 Avenue G #24 | 0.47mi | 2/1.0 | 1,040 (+8%) | 23mo | $109,000 | $105 | 41 |
Match score weights: distance 35% · size 25% · config 20% · recency 20%. Top-matched comps best support the ARV.
Projected returns pro-forma
-3.0% appreciation · 0.0% rent growth · sell at horizon
- IRR
- 1.7%
- Equity multiple
- 1.06×
- Total profit
- $2,279
- Equity at exit
- $19,831
- IRR
- 8.0%
- Equity multiple
- 1.53×
- Total profit
- $19,618
- Equity at exit
- $11,499
Cash invested: $37,240 (down + closing). Projections, not guarantees.
Landlord ↔ Tenant lean methodology
- Overall (STATE)
- 18 Strongly Tenant-Friendly
- State California
- 18 Strongly Tenant-Friendly · D+13
- County
- — inherits STATE
- City
- — inherits STATE
ZIP-level market 92399
- Rents YoY
- -1.3%
- Active inventory
- 205
- Price-to-rent
- 6.4×
Monthly cashflow live
- Estimated rent
- $1,738 high interval (Pro) →
- Mortgage (P&I)
- −$697
- Tax est. 1.5%
- −$166 /mo · $1,995/yr
- Insurance
- −$55
- HOA
- −$0
- Vacancy / Maint / Mgmt
- −$365
- Net cashflow
- $454
Break-even live
UW: 25.0% down · 7.5% · 30yr · 1.5% tax · 5.0% vac · 8.0% maint · 8.0% mgmt
Financing live
Cash to close
- Down payment
- $33,250
- Closing costs
- $3,990
- Reserves months
- —
- Total cash needed
- —
Loan-product check · same deal, 3 products live
Conventional
25% down · 7.5% · 30yr
- Down + closing
- —
- Monthly P&I
- —
- Monthly cashflow
- —
- DSCR
- —
- Eligible?
- —
Personal DTI + credit; lowest rate.
DSCR
20% down · 8.5% · 30yr
- Down + closing
- —
- Monthly P&I
- —
- Monthly cashflow
- —
- DSCR
- —
- Eligible?
- —
No personal income docs; deal must DSCR.
Hard money
10% down · 12.0% · 12mo
- Down + closing
- —
- Monthly P&I
- —
- Monthly cashflow
- —
- DSCR
- —
- Eligible?
- —
Short-term bridge; refi at stabilization.
Rent comps 25 comps
| Address | Beds | Baths | Sqft | Rent | $/sqft | DOM | Units | Dist |
|---|---|---|---|---|---|---|---|---|
| 12710 3rd St Spc 64 Yucaipa, CA | 3.0 | 2.0 | 800 | $1,795 | $2.24 | 43d | 1 | 0.67mi |
| 12710 3rd St Spc 54 Yucaipa, CA | 2.0 | 1.0 | 800 | $1,595 | $1.99 | 43d | 1 | 0.67mi |
| 12710 3rd St #21 Yucaipa, CA | 2.0 | 2.0 | 760 | $1,650 | $2.17 | 24d | 1 | 0.69mi |
| 12710 3rd St #57 Yucaipa, CA | 2.0 | 1.0 | 720 | $1,495 | $2.08 | 43d | 1 | 0.71mi |
| 12710 3rd St #32 Yucaipa, CA | 2.0 | 1.0 | 800 | $1,650 | $2.06 | 43d | 1 | 0.71mi |
| 12710 3rd St Spc 2 Yucaipa, CA | 2.0 | 1.5 | 660 | $1,650 | $2.50 | 43d | 1 | 0.71mi |
| 12710 3rd St Spc 3 Yucaipa, CA | 2.0 | 1.0 | 640 | $1,595 | $2.49 | 24d | 1 | 0.71mi |
| 12710 3rd St Unit 97 Yucaipa, CA | 1.0 | 1.0 | 672 | $1,350 | $2.01 | 43d | 1 | 0.75mi |
| 12710 3rd St Unit 81 Yucaipa, CA | 2.0 | 1.0 | 560 | $1,495 | $2.67 | 5d | 1 | 0.75mi |
| 34063 Avenue J Apt A Yucaipa, CA | 1.0 | 1.0 | 800 | $1,250 | $1.56 | 43d | 1 | 0.75mi |
| 12710 3rd St Unit 31 Yucaipa, CA | 2.0 | 1.0 | 800 | $1,650 | $2.06 | 24d | 1 | 0.76mi |
| 13645 5th St #75 Yucaipa, CA | 2.0 | 2.0 | 890 | $1,700 | $1.91 | 43d | 1 | 0.77mi |
| 13383 3rd St Unit 3 Yucaipa, CA | 2.0 | 1.0 | 750 | $1,800 | $2.40 | 24d | 1 | 0.80mi |
| 12350 5th St Unit 12382 Yucaipa, CA | 2.0 | 1.0 | 825 | $1,850 | $2.24 | 24d | 1 | 0.87mi |
| 947 Park Ave Calimesa, CA | 2.0 | 1.0 | 800 | $1,600 | $2.00 | 15d | 1 | 1.01mi |
| 12301 3rd St Yucaipa, CA | 1.0 | 1.0 | 992 | $2,150 | $2.17 | 1d | 1 | 1.15mi |
| 34449 Yucaipa Blvd Unit 10 Yucaipa, CA | 2.0 | 1.0 | 802 | $1,595 | $1.99 | 43d | 1 | 1.19mi |
| 213 W County Line Rd #5 Calimesa, CA | 2.0 | 2.0 | 950 | $1,750 | $1.84 | 11d | 1 | 1.23mi |
| 34759 Avenue B Ct Unit 3 Yucaipa, CA | 2.0 | 1.0 | 700 | $1,795 | $2.56 | 43d | 1 | 1.24mi |
| 34384 Yucaipa Blvd Unit 102 Yucaipa, CA | 1.0 | 1.0 | 920 | $1,900 | $2.07 | 43d | 1 | 1.25mi |
| 34384 Yucaipa Blvd Yucaipa, CA | 1.0 | 1.0 | 920 | $2,100 | $2.28 | 43d | 2 | 1.28mi |
| 12225 2nd St Yucaipa, CA | 1.0 | 1.0 | 720 | $2,295 | $3.19 | 1d | 1 | 1.35mi |
| 34947 Avenue A Unit A Yucaipa, CA | 2.0 | 1.0 | 800 | $1,900 | $2.38 | 43d | 1 | 1.44mi |
| 34976 Avenue A Unit A Yucaipa, CA | 2.0 | 1.0 | 755 | $1,925 | $2.55 | 3d | 1 | 1.49mi |
| 34976 Avenue A Unit A Yucaipa, CA | 2.0 | 1.0 | 755 | $1,895 | $2.51 | 43d | 1 | 1.49mi |
Listing history 31 events
-
2026-06-18days on market $133,000 Active 56 DOM
-
2026-06-17days on market $133,000 Active 55 DOM
-
2026-06-16days on market $133,000 Active 54 DOM
-
2026-06-15days on market $133,000 Active 53 DOM
-
2026-06-13days on market $133,000 Active 51 DOM
-
2026-06-13days on market $133,000 Active 50 DOM
-
2026-06-09days on market $133,000 Active 47 DOM
-
2026-06-08days on market $133,000 Active 46 DOM
-
2026-06-07days on market $133,000 Active 45 DOM
-
2026-06-04days on market $133,000 Active 42 DOM
-
2026-06-03days on market $133,000 Active 41 DOM
-
2026-06-02days on market $133,000 Active 40 DOM
-
2026-06-01days on market $133,000 Active 39 DOM
-
2026-05-31days on market $133,000 Active 38 DOM
-
2026-04-23$133,000 Active 1055-char remark
-
2024-05-27historical
-
2024-05-17status Active
-
2024-05-07status Active
-
2024-04-28status Active
-
2024-04-23status Active
-
2024-03-14status Active
-
2024-03-02status Active
-
2024-02-29status Active
-
2023-04-26status Active
-
2023-04-11$137,500 Active
-
2007-10-17historical
-
2007-07-28price $45,900
-
2007-05-28price $49,000
-
2007-04-19$54,900
-
2005-07-22soldstatus $35,000
-
2005-05-06$40,000
ⓘ Source: listings_history table (triggers on properties + properties_extension) + one-shot
backfill from property_details.listing_events for pre-trigger history.
Climate risk First Street
- Flood 1/10 Low FEMA zone X (unshaded) · 0% chance over 30 yrs
- Wildfire 9/10 Extreme
- Heat 6/10 Major 7 d/yr ≥100°F today · 20 d/yr by 30 yrs out
- Wind 1/10 Low
- Air quality 10/10 Extreme 30 unhealthy d/yr today · 37 by 30 yrs out
Nearby sold comps map
Loading sold comps map…
Walkable amenities ~0.75 mi
Loading nearby amenities…
Taxation est. · year 1
- Rental income
- $20,853
- − Mortgage interest
- −$7,450
- − Property taxes
- −$1,995
- − Insurance
- −$665
- − Repairs & maintenance
- −$1,668
- − Management
- −$1,668
- − Depreciation
- −$3,869
- Taxable income
- $3,538
- Est. tax owed @ 24.0%
- −$849
- After-tax cash flow
- $4,595/yr
For passive investors: Depreciation is non-cash, so a rental often shows a tax loss while cash-flowing — sheltering income. Rental losses are passive: they offset passive income freely, and up to $25,000/yr can offset ordinary (W-2) income if you actively participate and your MAGI is under $100k (phasing out to $0 by $150k); unused losses carry forward. On sale, claimed depreciation is recaptured at up to 25%, and gains may owe capital-gains tax (a 1031 exchange can defer both). Figures are a year-1 estimate at your 24.0% rate — not tax advice; consult a CPA.
Schools (NCES district)
- District
- Yucaipa-Calimesa Joint Unified
- NCES district ID
- 0643560
- Math proficiency
- 32% ▼ -4.00%
- Reading proficiency
- 55% ▲ 6.00%
- Median HH income
- $58,243
- Composite
- 38.09/100
- National rank
- #4277
- State rank
- #195 of 517 in CA
Livability — Yucaipa
- Score
- 66/100
- State rank
- #334
- US rank
- #11542
Category grades
Schools grade is shown separately in the Schools card above.
Census & demographics
- Census place
- Yucaipa, CA
- County
- San Bernardino County · 2,030,291 people
- City population
- 55,366
- Metro
- Riverside-San Bernardino-Ontario, CA
- Population (ZIP)
- 55,366
- Household income
- $92,440
- Rent vs Own
- Severe rent burden
- 1110.0
Population outlook (San Bernardino County) Hauer SSP2
- Today (2025)
- 2,300,329 people
- By 2030
- 2,378,907 · +3.4%
- By 2040
- 2,523,137 · +9.7%
- By 2050
- 2,642,388 · +14.9%
- By 2075
- 2,880,769 · +25.2%
- By 2100
- 2,909,436 · +26.5%
Race, ethnicity, and origin ACS 2023
- Neighborhood character
- Diverse neighborhood (Simpson 0.57)
- Race & ethnicity
- White 55% Hispanic / Latino 36% Two or more races 15% Asian 3% Black 2%
- Hispanic origin (detail)
- Mexican 31%
- Common ancestry
- Italian 4% Iranian 2% Lithuanian 2%
- Foreign-born
- 10% · Canada
- Languages at home
- 77% English-only · Spanish 19% Other Indo-European 1% Other Asian/Pacific 1%
Political lean MEDSL · San Bernardino
- 2024 margin
- Toss-up / Even · D 47.5% · R 49.7% · Other 2.8%
- 2008→2024 swing
- -8.5pp toward R · 2008: 6.3pp · 2024: -2.1pp
- All cycles
- 2024: R+2.1 2020: D+10.7 2016: D+9.8 2012: D+5.4 2008: D+6.3
Not yet ingested
- Civics
- —
Market trends
- HPI YoY
- ▼ -632.71%
- Current HPI
- 353.4762
- Rent YoY
- ▼ -1.27%
- Metro
- Riverside-San Bernardino-Ontario, CA
- State GDP YoY
- ▲ 3.21%
- F500 in state
- 116
Industry mix (Fortune 500 HQ in CA)
| Industry | F500 HQs | Revenue |
|---|---|---|
| Technology | 27 | $1,492B |
|
||
| Financial Services | 3 | $174B |
|
||
| Retail | 3 | $44B |
|
||
| Insurance | 3 | $26B |
|
||
| Media / Entertainment | 2 | $115B |
|
||
| Pharmaceuticals / Biotech | 2 | $62B |
|
||
Price history
+232.5% since first listed17 events — show timeline
- 2026-04-23 Listed $133,000 CRMLS
- 2024-05-27 Listing Removed — CRMLS
- 2024-05-17 Relisted — CRMLS
- 2024-05-07 Relisted — CRMLS
- 2024-04-28 Relisted — CRMLS
- 2024-04-23 Relisted — CRMLS
- 2024-03-14 Relisted — CRMLS
- 2024-03-02 Relisted — CRMLS
- 2024-02-29 Relisted — CRMLS
- 2023-04-26 Relisted — CRMLS
- 2023-04-11 Listed $137,500 CRMLS
- 2007-10-17 Listing Removed — CRMLS
- 2007-07-28 Price Changed $45,900 CRMLS
- 2007-05-28 Price Changed $49,000 CRMLS
- 2007-04-19 Listed $54,900 CRMLS
- 2005-07-22 Sold (MLS) $35,000 CRMLS
- 2005-05-06 Listed $40,000 CRMLS
Cash-flow waterfall
monthlySold comps — $/sqft
last 12 mo · ≤1 miLoading sold comps…