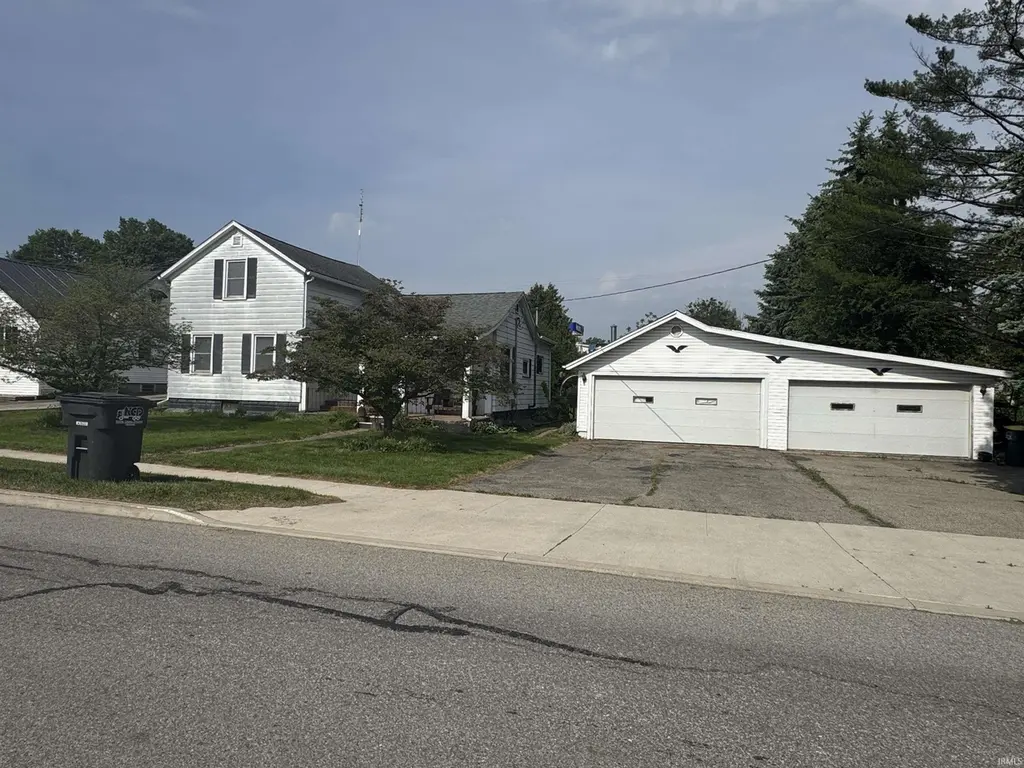
416 S Poplar Street St · Lagrange, IN
Flood risk 1/10 · Minimal
- FEMA flood zone
- X (unshaded)
- Chance of flooding over 30 yrs
- 0.0%
- Est. flood insurance / yr
- $473 – $860
Fire risk 1/10 · Minimal
- Est. fire insurance / yr
- $717 – $1,331
Heat risk 2/10 · Minimal
- Hot days now (above 98°F)
- 7 days/yr
- Hot days in 30 yrs
- 16 days/yr
Wind risk 2/10 · Minimal
- Chance of severe wind over 30 yrs
- —
Air-quality risk 2/10 · Minimal
- Unhealthy air days now
- 1 days/yr
- Unhealthy air days in 30 yrs
- 1 days/yr
Risk factors via First Street. Map © Google.
Why this score? — see what drove the C- grade
The composite is a weighted blend of 9 inputs, each scored 0–100. Each bar is that input's sub-score; the figure is the points it added to the 100-point composite (weight × sub-score).
- Cash flow +15.6/30.0
- ARV discount +15.0/15.0
- DSCR +4.8/10.0
- Livability +3.7/5.0
- 1% rule +3.5/10.0
- Schools +2.6/10.0
- Rent growth +2.5/5.0
- Condition / age +2.5/5.0
- Appreciation +0.0/10.0
$145,000
🖨 Deal sheet 📄 Offer letter ✓ Due diligence
Listing remarks
Investors, Handy Man, Home Owners!! Ready for some new updates and a new family to make this house a home. 3 bedroom 1 bath home on . 38 of an acre with two sheds and a oversized 2 car garage. Many possibilities close to town walking distance to shopping, dinning and all other amenities. Selling - AS-IS
Key facts
- 0.38 acre lot
- 2 garage spots
- Built 1864
Property features AI
Exterior
- Parking: Detached 2-car garage
- Utilities: Public water; Public sewer
- Home design: Single-family residence (site-built); 2 stories
- Construction: Aluminum siding; Shingle roof; Built as a site-built home
- Exterior features: Porch; Shed(s); Level lot
Interior
- Kitchen: Electric cooktop; Oven; Dishwasher; Refrigerator
- Bedrooms: 7 total rooms (includes bedrooms and other living spaces)
- Bathrooms: 1 full bathroom (main level)
- Heating & cooling: Forced air heating; Central air conditioning
- Interior features: Dishwasher; Refrigerator; Electric cooktop; Oven; Gas water heater; Dryer; Water heater; Full basement
- Laundry & utility: Main level laundry; Dryer; Gas water heater
Neighborhood map
What this means for you Summary
Snapshot
- This is a 3-bed/1.0-bath single-family listed at $145k.
Deal economics
- At list price, monthly cash flow is $61 ($737/yr) — positive.
- The deal already cash-flows at list — no discount required.
- To meet the 1% rule (rent ≥ 1% of price), the offer needs to be $124k (14.6% below list).
- Recommended offer: $124k (14.6% below list) — sets the bar for 1% rule.
Location & tenants
- Location reads 74/100 on livability (#72 in IN, #4,583 nationally) — a middle-class / working-renter tenant base. Strengths: crime A+, cost of living A+, housing A+; Watch: employment D+, amenities F, commute F.
- Lakeland School Corporation (rural): math 25% / reading 34% proficiency, ranked #243 of 301 in IN (top 81%) — low school quality limits family demand, transient renter base, plan for 1-2y turnover.
- Zoned schools: Lakeland Primary School (318 students, 67% FRL); Lakeland Jr/Sr High School (math 21% / reading 41%, grade F, #303 of 369 statewide, top 82%, 793 students, 48% FRL).
- Market conditions: 28 active listings in the ZIP; 2 comparable units currently listed for rent nearby; 134 units permitted in LaGrange County in 2024 (0 in 5+ unit buildings).
Forward outlook
- Local home prices are declining (-3.0%/yr); year-one equity from $1k of loan paydown is wiped out by about $4k of value loss. Plan a longer hold.
Negotiation context
- Only 13 days on market — expect competitive offers; lowballing is unlikely to land.
Risks & watch-outs
- Watch-outs: built in 1864 — expect roof / HVAC / electrical / plumbing capex.
Questions for the listing agent
- Built in 1864 — when were the roof, HVAC, electrical panel, plumbing, and water heater last replaced?
- Is there a deadline driving the sale (1031 exchange, divorce, estate, relocation)? That informs how much negotiation room exists.
- Schools are D-rated, which usually means shorter tenancies and higher turnover. Who's the typical renter profile here, and what's been the actual vacancy rate?
- What's the average days-on-market for RENTAL listings here right now (not sales)? A rising rental-DOM trend means longer vacancies and softer asking-rent achievability than the comps imply.
- What's the recent tenant-quality profile in this submarket — average credit score on applications, eviction rate, late-payment / NSF rate, and stable-employment percentage? A property-management company in the area should have these aggregated.
- How much new for-sale + rental construction is in the pipeline within 1–3 miles? Heavy new supply typically softens prices + rents 12–24 months out; constrained supply supports both.
Investment metrics
- 1% rule
- 0.85% ✗
- Cap rate
- 6.80%
- Cash-on-cash
- 1.82%
- DSCR
- 1.08
- GRM
- 9.8
CMA / ARV
- ARV (on-the-fly)
- $192,424
- Comps found
- 12
Show comp detail 12 sales within ~0.75 mi
| Address | Dist | Beds/Ba | Sqft | Sold | Price | $/sf | Match |
|---|---|---|---|---|---|---|---|
| 314 E Michigan St | 0.33mi | 3/1.0 | 1,384 (-4%) | 2mo | $185,000 | $134 | 77 |
| 503 E Michigan St | 0.40mi | 3/1.5 | 1,408 (-2%) | 1mo | $170,000 | $121 | 75 |
| 207 S Poplar St | 0.16mi | 3/1.0 | 1,592 (+11%) | 2mo | $185,000 | $116 | 73 |
| 203 Fenn St St | 0.21mi | 2/1.5 (-1) | 1,394 (-3%) | 14mo | $145,000 | $104 | 66 |
| 405 N Canal St | 0.51mi | 3/2.0 | 1,464 (+2%) | 3mo | $219,000 | $150 | 66 |
| 602 N Maple St | 0.64mi | 3/1.0 | 1,477 (+3%) | 2mo | $189,000 | $128 | 63 |
| 405 S Sherman St | 0.35mi | 3/1.5 | 1,568 (+9%) | 10mo | $220,000 | $140 | 58 |
| 508 E Michigan St | 0.38mi | 2/1.5 (-1) | 1,514 (+5%) | 12mo | $180,000 | $119 | 56 |
| 221 N Maple St | 0.50mi | 3/1.0 | 1,248 (-13%) | 9mo | $160,000 | $128 | 48 |
| 402 N Maple St | 0.54mi | 3/1.5 | 1,260 (-12%) | 7mo | $215,000 | $171 | 46 |
| 0175 N 010 W | 0.59mi | 3/1.0 | 1,640 (+14%) | 4mo | $245,000 | $149 | 46 |
| 0225 N 020 W | 0.67mi | 2/2.0 (-1) | 1,481 (+3%) | 12mo | $330,000 | $223 | 45 |
Match score weights: distance 35% · size 25% · config 20% · recency 20%. Top-matched comps best support the ARV.
Projected returns pro-forma
-3.0% appreciation · 3.0% rent growth · sell at horizon
- IRR
- -13.4%
- Equity multiple
- 0.52×
- Total profit
- $-19,619
- Equity at exit
- $21,620
- IRR
- -4.6%
- Equity multiple
- 0.70×
- Total profit
- $-12,184
- Equity at exit
- $12,537
Cash invested: $40,600 (down + closing). Projections, not guarantees.
Landlord ↔ Tenant lean methodology
- Overall (STATE)
- 90 Strongly Landlord-Friendly
- State Indiana
- 90 Strongly Landlord-Friendly · R+11
- County
- — inherits STATE
- City
- — inherits STATE
ZIP-level market 46761
- Home prices YoY
- -20.3%
- Active inventory
- 28
- Price-to-rent
- 9.8×
Monthly cashflow live
- Estimated rent
- $1,238 medium interval (Pro) →
- Mortgage (P&I)
- −$760
- Tax from tax record
- −$96 /mo · $1,150/yr
- Insurance
- −$60
- HOA
- −$0
- Vacancy / Maint / Mgmt
- −$260
- Net cashflow
- $61
Break-even live
UW: 25.0% down · 7.5% · 30yr · 1.5% tax · 5.0% vac · 8.0% maint · 8.0% mgmt
Financing live
Cash to close
- Down payment
- $36,250
- Closing costs
- $4,350
- Reserves months
- —
- Total cash needed
- —
Loan-product check · same deal, 3 products live
Conventional
25% down · 7.5% · 30yr
- Down + closing
- —
- Monthly P&I
- —
- Monthly cashflow
- —
- DSCR
- —
- Eligible?
- —
Personal DTI + credit; lowest rate.
DSCR
20% down · 8.5% · 30yr
- Down + closing
- —
- Monthly P&I
- —
- Monthly cashflow
- —
- DSCR
- —
- Eligible?
- —
No personal income docs; deal must DSCR.
Hard money
10% down · 12.0% · 12mo
- Down + closing
- —
- Monthly P&I
- —
- Monthly cashflow
- —
- DSCR
- —
- Eligible?
- —
Short-term bridge; refi at stabilization.
Rent comps 2 comps
| Address | Beds | Baths | Sqft | Rent | $/sqft | DOM | Units | Dist |
|---|---|---|---|---|---|---|---|---|
| 104 W Michigan St Unit 1 LaGrange, IN | 3.0 | 2.0 | 954 | $1,250 | $1.31 | 43d | 1 | 0.35mi |
| 407 N High St Lagrange, IN | 3.0 | 1.0 | 1632 | $1,225 | $0.75 | 43d | 1 | 0.51mi |
Listing history 5 events
-
2026-06-01status $145,000 Pending 13 DOM
-
2026-06-01days on market $145,000 Active 13 DOM
-
2026-05-31days on market $145,000 Active 12 DOM
-
2026-05-31days on market $145,000 Active 11 DOM
-
2026-05-19$145,000 Active
ⓘ Source: listings_history table (triggers on properties + properties_extension) + one-shot
backfill from property_details.listing_events for pre-trigger history.
Tax reassessment forecast IN · Partial reset (capped growth)
- Current annual tax
- $1,150 · $96/mo
- Projected year-2 tax
- $1,191 · $99/mo
- Expected delta
- +$41/yr (+$3/mo · 3.6%)
ⓘ Screening estimate from a state-policy table — verify with the county assessor before closing.
Climate risk First Street
- Flood 1/10 Low FEMA zone X (unshaded) · 0% chance over 30 yrs
- Wildfire 1/10 Low
- Heat 2/10 Low 7 d/yr ≥98°F today · 16 d/yr by 30 yrs out
- Wind 2/10 Low
- Air quality 2/10 Low 1 unhealthy d/yr today · 1 by 30 yrs out
Nearby sold comps map
Loading sold comps map…
Walkable amenities ~0.75 mi
Loading nearby amenities…
Taxation est. · year 1
- Rental income
- $14,856
- − Mortgage interest
- −$8,122
- − Property taxes
- −$1,150
- − Insurance
- −$725
- − Repairs & maintenance
- −$1,188
- − Management
- −$1,188
- − Depreciation
- −$4,218
- Taxable loss
- −$1,736
- Est. tax savings @ 24.0%
- +$417
- After-tax cash flow
- $1,154/yr
For passive investors: Depreciation is non-cash, so a rental often shows a tax loss while cash-flowing — sheltering income. Rental losses are passive: they offset passive income freely, and up to $25,000/yr can offset ordinary (W-2) income if you actively participate and your MAGI is under $100k (phasing out to $0 by $150k); unused losses carry forward. On sale, claimed depreciation is recaptured at up to 25%, and gains may owe capital-gains tax (a 1031 exchange can defer both). Figures are a year-1 estimate at your 24.0% rate — not tax advice; consult a CPA.
Schools (NCES district)
- District
- Lakeland School Corporation
- NCES district ID
- 1805520
- Math proficiency
- 25% ▼ -16.00%
- Reading proficiency
- 34% ▼ -6.00%
- Median HH income
- $48,394
- Composite
- 25.6/100
- National rank
- #7417
- State rank
- #243 of 301 in IN
Livability — Lagrange
- Score
- 74/100
- State rank
- #72
- US rank
- #4583
Category grades
Schools grade is shown separately in the Schools card above.
Census & demographics
- Census place
- Lagrange, IN
- County
- LaGrange · 11,985 people
- Population (ZIP)
- 11,985
- Household income
- $72,088
- Rent vs Own
- Severe rent burden
- 6.1
Population outlook (LaGrange County) Hauer SSP2
- Today (2025)
- 39,718 people
- By 2030
- 40,060 · +0.9%
- By 2040
- 40,333 · +1.5%
- By 2050
- 39,284 · -1.1%
- By 2075
- 32,100 · -19.2%
- By 2100
- 21,407 · -46.1%
Race, ethnicity, and origin ACS 2023
- Neighborhood character
- Predominantly White (91%)
- Race & ethnicity
- White 91% Hispanic / Latino 8% Two or more races 6%
- Hispanic origin (detail)
- Mexican 8%
- Common ancestry
- Italian 7% Polish 6% Iranian 2%
- Foreign-born
- 4% · Canada
- Languages at home
- 56% English-only · German/W. Germanic 37% Spanish 7%
Political lean MEDSL · LaGrange
- 2024 margin
- Solid R (+56.8) · D 20.8% · R 77.6% · Other 1.7%
- 2008→2024 swing
- -35.3pp toward R · 2008: -21.5pp · 2024: -56.8pp
- All cycles
- 2024: R+56.8 2020: R+54.1 2016: R+51.8 2012: R+35.8 2008: R+21.5
Not yet ingested
- Civics
- —
Market trends
- HPI YoY
- ▼ -58.86%
- Current HPI
- 231.4785
- Rent YoY
- —
- Metro
- —
- State GDP YoY
- ▲ 2.90%
- F500 in state
- 18
Industry mix (Fortune 500 HQ in IN)
| Industry | F500 HQs | Revenue |
|---|---|---|
| Industrial Machinery | 2 | $37B |
|
||
| Healthcare | 1 | $177B |
|
||
| Pharmaceuticals | 1 | $45B |
|
||
| Metals / Steel | 1 | $18B |
|
||
| Agriculture | 1 | $17B |
|
||
| Packaging | 1 | $12B |
|
||
Price history
1 event — show timeline
- 2026-05-19 Listed $145,000 IRMLS
Property tax history
+2.3%/yrLatest (2024): $1,150 · +5.5% YoY. Source: county tax records.
Cash-flow waterfall
monthlySold comps — $/sqft
last 12 mo · ≤1 miLoading sold comps…