718 E 6th St · Muscatine, IA
Flood risk 1/10 · Minimal
- FEMA flood zone
- X (unshaded)
- Chance of flooding over 30 yrs
- 0.0%
- Est. flood insurance / yr
- $473 – $860
Fire risk 3/10 · Minor
- Est. fire insurance / yr
- $902 – $1,676
Heat risk 4/10 · Minor
- Hot days now (above 107°F)
- 7 days/yr
- Hot days in 30 yrs
- 16 days/yr
Wind risk 2/10 · Minimal
- Chance of severe wind over 30 yrs
- —
Air-quality risk 2/10 · Minimal
- Unhealthy air days now
- 2 days/yr
- Unhealthy air days in 30 yrs
- 2 days/yr
Risk factors via First Street. Map © Google.
Why this score? — see what drove the C- grade
The composite is a weighted blend of 9 inputs, each scored 0–100. Each bar is that input's sub-score; the figure is the points it added to the 100-point composite (weight × sub-score).
- Cash flow +20.9/30.0
- ARV discount +7.5/15.0
- DSCR +6.6/10.0
- 1% rule +5.6/10.0
- Schools +4.9/10.0
- Livability +3.5/5.0
- Rent growth +2.5/5.0
- Condition / age +2.5/5.0
- Appreciation +0.0/10.0
$112,900
🖨 Deal sheet 📄 Offer letter ✓ Due diligence
Listing remarks MLS
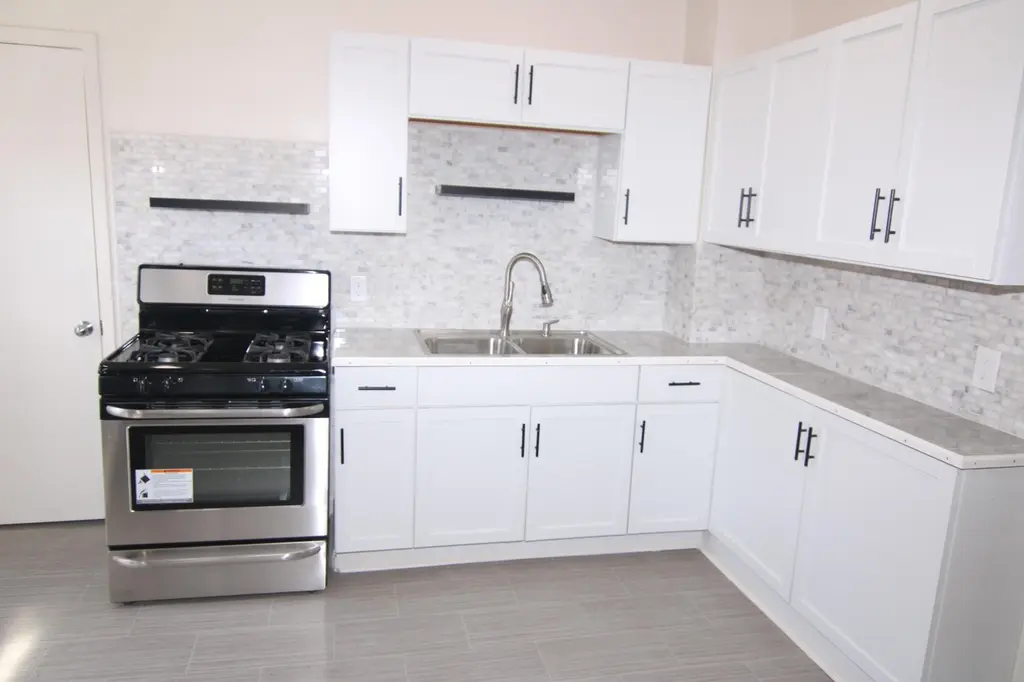
Kitchen with walk-in pantry, living and dining room spaces, HUGE main floor laundry/ 1/2 bath, 3 bedrooms up with a full bath. New flooring, fresh paint, totally remodeled kitchen with new cabinets. Siding on order to replace front porch siding. *Seller licensed real estate agent in IA* 48 hours Notice to Show- Seller must be present.
Key facts
- Remodeled kitchen
- Main floor laundry
- New cabinets
Tags
Property features AI
Exterior
- Utilities: Public water; Public sewer
- Home design: Single-family residence; One and one-half stories
- Construction: Vinyl siding
- Exterior features: Lot approximately 60 x 73; Zoning: R5
Interior
- Kitchen: Refrigerator
- Bedrooms: One and one-half level home
- Heating & cooling: Central air conditioning
- Interior features: Refrigerator included; Full basement
- Laundry & utility: Laundry on main level
Neighborhood map
What this means for you Summary
Snapshot
- This is a 3-bed/1.0-bath single-family listed at $113k.
Deal economics
- At list price, monthly cash flow is $156 ($2k/yr) — positive.
- The deal already cash-flows at list — no discount required.
- Meets the 1% rule at list price ($1k rent vs $113k).
Location & tenants
- Location reads 70/100 on livability (#358 in IA) — a middle-class / working-renter tenant base. Strengths: cost of living A+, housing A+, crime B; Watch: health & safety D+, amenities F, commute F.
- Muscatine Community School District (town): math 55% / reading 59% proficiency, ranked #257 of 289 in IA (top 89%) — acceptable for families but not a draw, mixed tenant base, ~2y average lease.
- Market conditions: 188 active listings in the ZIP; 4 comparable units currently listed for rent nearby; rentals lingering (median 44d on market — plan ~5-8 weeks vacancy on turnover, expect pricing pressure); 50% of comp listings sitting > 30 days — soft ceiling on asking rent; 65 units permitted in Muscatine County in 2024 (45 in 5+ unit buildings).
Forward outlook
- Local home prices are declining (-3.0%/yr); year-one equity from $781 of loan paydown is wiped out by about $3k of value loss. Plan a longer hold.
- Muscatine County population projected at +8% by 2050 — modest demand growth; plan on rents tracking national, not racing it.
Negotiation context
- Only 6 days on market — expect competitive offers; lowballing is unlikely to land.
- 5 sale attempts since 4y ago with the ask held roughly flat each time — persistent listings suggest the price (not the market) is what's stuck; bring a comps-based counter.
- Current owner paid $38k; list at $113k implies a 197% gain — meaningful room to come down on a strong offer.
Risks & watch-outs
- Watch-outs: built in 1915 — expect roof / HVAC / electrical / plumbing capex.
Questions for the listing agent
- Built in 1915 — when were the roof, HVAC, electrical panel, plumbing, and water heater last replaced?
- Is there a deadline driving the sale (1031 exchange, divorce, estate, relocation)? That informs how much negotiation room exists.
- What's the average days-on-market for RENTAL listings here right now (not sales)? A rising rental-DOM trend means longer vacancies and softer asking-rent achievability than the comps imply.
- What's the recent tenant-quality profile in this submarket — average credit score on applications, eviction rate, late-payment / NSF rate, and stable-employment percentage? A property-management company in the area should have these aggregated.
- How much new for-sale + rental construction is in the pipeline within 1–3 miles? Heavy new supply typically softens prices + rents 12–24 months out; constrained supply supports both.
Investment metrics
- 1% rule
- 1.06% ✓
- Cap rate
- 7.95%
- Cash-on-cash
- 5.93%
- DSCR
- 1.26
- GRM
- 7.8
CMA / ARV
No comps found within radius.
Projected returns pro-forma
-3.0% appreciation · 3.0% rent growth · sell at horizon
- IRR
- -7.1%
- Equity multiple
- 0.74×
- Total profit
- $-8,318
- Equity at exit
- $16,834
- IRR
- 2.5%
- Equity multiple
- 1.18×
- Total profit
- $5,674
- Equity at exit
- $9,762
Cash invested: $31,612 (down + closing). Projections, not guarantees.
Landlord ↔ Tenant lean methodology
- Overall (STATE)
- 83 Strongly Landlord-Friendly
- State Iowa
- 83 Strongly Landlord-Friendly · R+6
- County
- — inherits STATE
- City
- — inherits STATE
ZIP-level market 52761
- Active inventory
- 188
- Price-to-rent
- 7.8×
Monthly cashflow live
- Estimated rent
- $1,201 medium interval (Pro) →
- Mortgage (P&I)
- −$592
- Tax from tax record
- −$153 /mo · $1,838/yr
- Insurance
- −$47
- HOA
- −$0
- Vacancy / Maint / Mgmt
- −$252
- Net cashflow
- $156
Break-even live
UW: 25.0% down · 7.5% · 30yr · 1.5% tax · 5.0% vac · 8.0% maint · 8.0% mgmt
Financing live
Cash to close
- Down payment
- $28,225
- Closing costs
- $3,387
- Reserves months
- —
- Total cash needed
- —
Loan-product check · same deal, 3 products live
Conventional
25% down · 7.5% · 30yr
- Down + closing
- —
- Monthly P&I
- —
- Monthly cashflow
- —
- DSCR
- —
- Eligible?
- —
Personal DTI + credit; lowest rate.
DSCR
20% down · 8.5% · 30yr
- Down + closing
- —
- Monthly P&I
- —
- Monthly cashflow
- —
- DSCR
- —
- Eligible?
- —
No personal income docs; deal must DSCR.
Hard money
10% down · 12.0% · 12mo
- Down + closing
- —
- Monthly P&I
- —
- Monthly cashflow
- —
- DSCR
- —
- Eligible?
- —
Short-term bridge; refi at stabilization.
Rent comps 4 comps
| Address | Beds | Baths | Sqft | Rent | $/sqft | DOM | Units | Dist |
|---|---|---|---|---|---|---|---|---|
| 307 W 3rd St Unit A Muscatine, IA | 2.0 | 1.0 | 935 | $800 | $0.86 | 13d | 1 | 0.65mi |
| 609 W 3rd St Muscatine, IA | 3.0 | 2.0 | 1672 | $1,350 | $0.81 | 13d | 1 | 0.87mi |
| 611 W 7th St Muscatine, IA | 3.0 | 1.5 | 964 | $1,250 | $1.30 | 43d | 1 | 0.88mi |
| 1203 Sunrise Cir Muscatine, IA | 3.0 | 2.0 | 1830 | $1,545 | $0.84 | 43d | 1 | 1.13mi |
Listing history 6 events
-
2026-06-18days on market $112,900 Active 6 DOM
-
2026-06-17days on market $112,900 Active 5 DOM
-
2026-06-16days on market $112,900 Active 4 DOM
-
2026-06-15days on market $112,900 Active 3 DOM
-
2026-06-13remarks 291-char remark
-
2026-06-13$112,900 Active 1 DOM
ⓘ Source: listings_history table (triggers on properties + properties_extension) + one-shot
backfill from property_details.listing_events for pre-trigger history.
Tax reassessment forecast IA · Partial reset (capped growth)
- Current annual tax
- $1,838 · $153/mo
- Projected year-2 tax
- $1,838 · $153/mo
- Expected delta
- $0/yr ($0/mo · 0.0%)
ⓘ Screening estimate from a state-policy table — verify with the county assessor before closing.
Climate risk First Street
- Flood 1/10 Low FEMA zone X (unshaded) · 0% chance over 30 yrs
- Wildfire 3/10 Moderate
- Heat 4/10 Moderate 7 d/yr ≥107°F today · 16 d/yr by 30 yrs out
- Wind 2/10 Low
- Air quality 2/10 Low 2 unhealthy d/yr today · 2 by 30 yrs out
Nearby sold comps map
Loading sold comps map…
Walkable amenities ~0.75 mi
Loading nearby amenities…
Taxation est. · year 1
- Rental income
- $14,408
- − Mortgage interest
- −$6,324
- − Property taxes
- −$1,838
- − Insurance
- −$564
- − Repairs & maintenance
- −$1,153
- − Management
- −$1,153
- − Depreciation
- −$3,284
- Taxable income
- $91
- Est. tax owed @ 24.0%
- −$22
- After-tax cash flow
- $1,853/yr
For passive investors: Depreciation is non-cash, so a rental often shows a tax loss while cash-flowing — sheltering income. Rental losses are passive: they offset passive income freely, and up to $25,000/yr can offset ordinary (W-2) income if you actively participate and your MAGI is under $100k (phasing out to $0 by $150k); unused losses carry forward. On sale, claimed depreciation is recaptured at up to 25%, and gains may owe capital-gains tax (a 1031 exchange can defer both). Figures are a year-1 estimate at your 24.0% rate — not tax advice; consult a CPA.
Schools (NCES district)
- District
- Muscatine Community School District
- NCES district ID
- 1920130
- Math proficiency
- 55% ▼ -7.00%
- Reading proficiency
- 59% ▲ 2.00%
- Median HH income
- $50,193
- Composite
- 48.6/100
- National rank
- #2110
- State rank
- #257 of 289 in IA
Livability — Muscatine
- Score
- 70/100
- State rank
- #358
- US rank
- #7508
Category grades
Schools grade is shown separately in the Schools card above.
Census & demographics
- Census place
- Muscatine, IA
- City population
- 29,800
- Population (ZIP)
- 29,800
Population outlook (Muscatine County) Hauer SSP2
- Today (2025)
- 44,820 people
- By 2030
- 45,461 · +1.4%
- By 2040
- 46,765 · +4.3%
- By 2050
- 48,609 · +8.5%
- By 2075
- 56,014 · +25.0%
- By 2100
- 63,513 · +41.7%
Race, ethnicity, and origin ACS 2023
- Neighborhood character
- Predominantly White (76%)
- Race & ethnicity
- White 76% Hispanic / Latino 17% Two or more races 5% Black 4%
- Hispanic origin (detail)
- Mexican 13%
- Common ancestry
- Portuguese 2% Romanian 2% Iranian 2%
- Foreign-born
- 7% · Canada
- Languages at home
- 86% English-only · Spanish 11% French/Haitian/Cajun 1% Other Indo-European 1%
Political lean MEDSL · Muscatine
- 2024 margin
- R (+14.9) · D 41.7% · R 56.6% · Other 1.7%
- 2008→2024 swing
- -30.6pp toward R · 2008: 15.7pp · 2024: -14.9pp
- All cycles
- 2024: R+14.9 2020: R+7.0 2016: R+6.6 2012: D+15.5 2008: D+15.7
Not yet ingested
- Civics
- —
Market trends
- HPI YoY
- ▼ -130.30%
- Current HPI
- 182.4493
- Rent YoY
- —
- Metro
- —
- State GDP YoY
- ▲ 2.48%
- F500 in state
- 4
Industry mix (Fortune 500 HQ in IA)
| Industry | F500 HQs | Revenue |
|---|---|---|
| Financial Services | 1 | $16B |
|
||
| Retail / Convenience | 1 | $15B |
|
||
Price history
+75.0% since first listed12 events — show timeline
- 2026-06-12 Listed $112,900 Muscatine BOR
- 2026-06-12 Listed $112,900 MRED as Distributed by MLS Grid
- 2022-10-24 Price Changed — RMLSA as Distributed by MLS Grid
- 2022-10-22 Relisted — RMLSA as Distributed by MLS Grid
- 2022-10-22 Price Changed — RMLSA as Distributed by MLS Grid
- 2022-10-22 Listing Removed — MRED as Distributed by MLS Grid
- 2022-10-22 Listing Removed — RMLSA as Distributed by MLS Grid
- 2022-10-19 Pending — RMLSA as Distributed by MLS Grid
- 2022-10-06 Listed — RMLSA as Distributed by MLS Grid
- 2022-10-06 Listed $108,900 Muscatine BOR
- 2005-05-23 Sold (MLS) $38,000 Muscatine BOR
- 2002-08-24 Sold (MLS) $64,500 Muscatine BOR
Property tax history
+2.3%/yrLatest (2025): $1,838 · +2.9% YoY. Source: county tax records.
Cash-flow waterfall
monthlySold comps — $/sqft
last 12 mo · ≤1 miLoading sold comps…