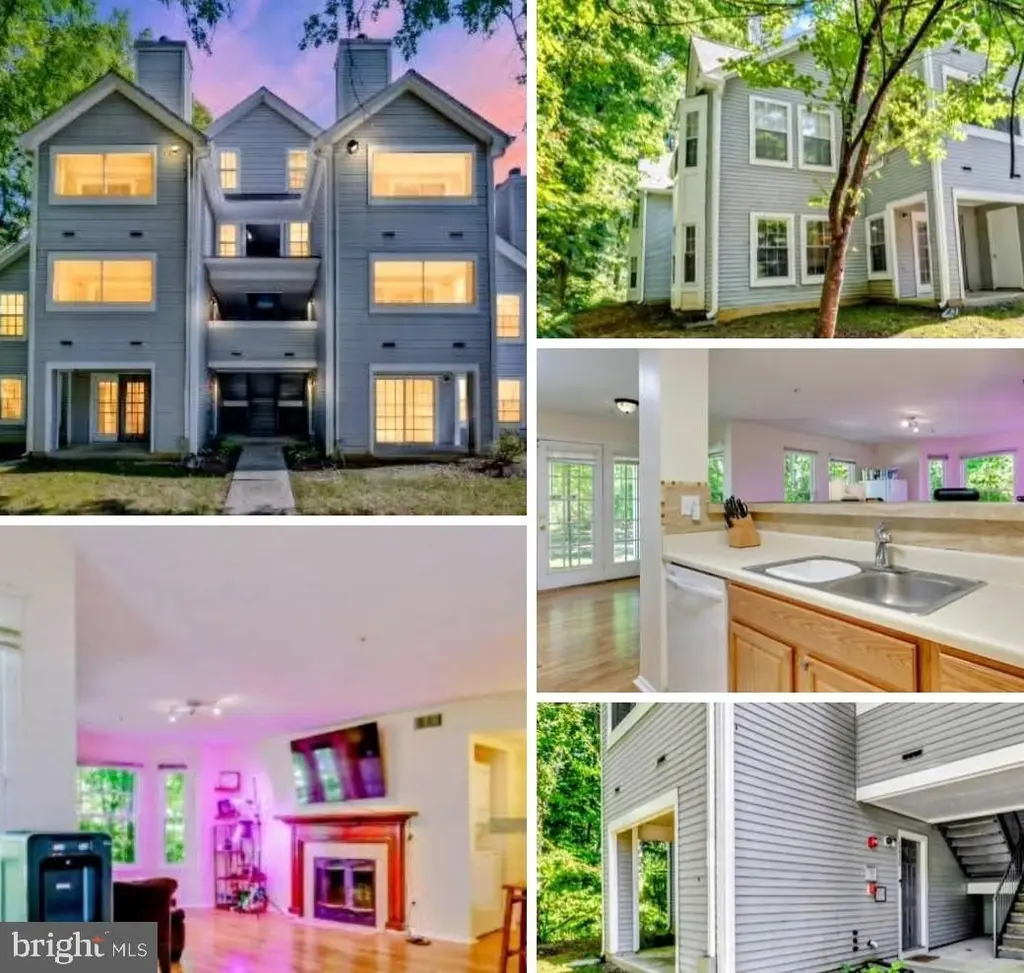
13550 Lord Sterling Pl Unit 9-2 · Marlboro Village, MD
Flood risk 1/10 · Minimal
- FEMA flood zone
- X (unshaded)
- Chance of flooding over 30 yrs
- 0.0%
- Est. flood insurance / yr
- $507 – $1,088
Fire risk 4/10 · Minor
- Est. fire insurance / yr
- $755 – $1,403
Heat risk 8/10 · Major
- Hot days now (above 103°F)
- 7 days/yr
- Hot days in 30 yrs
- 17 days/yr
Wind risk 5/10 · Moderate
- Chance of severe wind over 30 yrs
- 25.0%
Air-quality risk 2/10 · Minimal
- Unhealthy air days now
- 2 days/yr
- Unhealthy air days in 30 yrs
- 2 days/yr
Risk factors via First Street. Map © Google.
Why this score? — see what drove the D grade
The composite is a weighted blend of 9 inputs, each scored 0–100. Each bar is that input's sub-score; the figure is the points it added to the 100-point composite (weight × sub-score).
- Cash flow +11.3/30.0
- ARV discount +7.5/15.0
- 1% rule +5.7/10.0
- Rent growth +5.0/5.0
- DSCR +3.3/10.0
- Livability +3.3/5.0
- Condition / age +2.5/5.0
- Schools +1.7/10.0
- Appreciation +0.0/10.0
$215,000
🖨 Deal sheet 📄 Offer letter ✓ Due diligence
Listing remarks MLS
Tucked away in Upper Marlboro, welcome home to this fantastic 2-bedroom 1-bathroom condo. This lower level unit condo offers an open kitchen, dining and living room concept with access off the kitchen to the patio area. BRAND NEW FLOORING just installed less than a week ago! 1 mile to the Dutch Farmers Market and shopping center, and in close proximity to Rt-4, 495 and D. C.
Key facts
- $462 HOA
- Built 1990
- Listed 7 days
Property features AI
Finance
- Other: Total finished above-grade area reported as 876 (source: Assessor); Total below-grade area reported as 0; Accessibility listed as Level Entry - Main and No Stairs; Directions: Off Brown Station Road
- Financial info: No investor or rental income/expense details provided
- HOA & community: Monthly condo fee of $446; Annual HOA fee of $195; HOA fees cover parking, common area maintenance, grounds, snow removal, and trash; Community amenity: tot lots/playground
Exterior
- Parking: Parking lot; Parking fee included in condo/coop fee
- Security: No specific security features listed
- Utilities: Public water; Public sewer; Electric power and utilities
- Home design: Condominium unit in a garden-style building (1–4 floors); Unit/flat; Building name: LORDS LANDING VILLAGE CONDO - PHASE 7
- Construction: Shingle siding; Above-grade and below-grade structures present; Year built source: Assessor
- Exterior features: Not located in a federal flood zone; Located outside city limits; Entry on floor 1
Interior
- Kitchen: No kitchen appliance details provided
- Bedrooms: 2 bedrooms on main level
- Flooring: No flooring details provided
- Bathrooms: 1 full bathroom on main level
- Heating & cooling: Central heating (electric); Central air conditioning (electric); Electric hot water
- Interior features: Level entry with no stairs; No basement
- Laundry & utility: Washer/dryer hookup in unit
Neighborhood map
What this means for you Summary
Snapshot
- This is a 2-bed/1.0-bath condo listed at $215k.
Deal economics
- At list price, monthly cash flow is $-79 ($-942/yr) — negative.
- To cash-flow at today's rent, offer at most $201k (6.5% below list).
- Meets the 1% rule at list price ($2k rent vs $215k).
- Recommended offer: $201k (6.5% below list) — sets the bar for cash-flow.
Location & tenants
- Location reads 66/100 on livability (#226 in MD) — a middle-class / working-renter tenant base. Strengths: employment A+, housing A+; Watch: schools D, cost of living D, amenities F.
- Prince George'S County Public Schools (suburban): math 8% / reading 24% proficiency, ranked #21 of 24 in MD (top 88%) — low school quality limits family demand, transient renter base, plan for 1-2y turnover.
- Market conditions: Rents rising fast (+9.8%/yr); 309 active listings in the ZIP; 6 comparable units currently listed for rent nearby; rentals lingering (median 44d on market — plan ~5-8 weeks vacancy on turnover, expect pricing pressure); 50% of comp listings sitting > 30 days — soft ceiling on asking rent; high-income renter base; 1,481 units permitted in Prince George's County in 2024 (0 in 5+ unit buildings).
Forward outlook
- Local home prices are declining (-3.0%/yr); year-one equity from $1k of loan paydown is wiped out by about $6k of value loss. Plan a longer hold.
- Prince George's County population projected at +18% by 2050 — long-run rental-demand tailwind backs the buy-and-hold thesis.
Negotiation context
- Only 8 days on market — expect competitive offers; lowballing is unlikely to land.
- 10 sale attempts since 22y ago; this cycle's ask is 6% above the opening price — seller raised mid-cycle; expect resistance to lowballs.
- Current owner paid $172k; 25% above their basis — modest negotiation headroom, anchor on the comps not their cost.
Risks & watch-outs
- Watch-outs: HOA is 20% of rent.
- Climate carrying-cost: moderate wind risk, 25% chance of damaging wind over 30y; extreme-heat days projected 7→17/yr by 2055 (HVAC capex compounding) — expect insurance premiums to compound above CPI over the hold.
Questions for the listing agent
- What do current leases actually rent for vs. the listed asking? Can we see a recent rent roll and the last 12 months of T-12 income?
- What does the HOA fee cover, when was the last increase, and are there any pending special assessments or reserve-fund shortfalls?
- Any open or pending special assessments — roof, HVAC, plumbing, elevator, façade? What's the per-unit balance and payoff schedule, and is the seller paying it off at close or rolling it to the buyer?
- Is there a deadline driving the sale (1031 exchange, divorce, estate, relocation)? That informs how much negotiation room exists.
- Schools are D-rated, which usually means shorter tenancies and higher turnover. Who's the typical renter profile here, and what's been the actual vacancy rate?
- The area grade is low — what's the realistic commute time and amenity access for the typical tenant pool here? Any planned neighborhood developments (good or bad) we should know about?
- What's the average days-on-market for RENTAL listings here right now (not sales)? A rising rental-DOM trend means longer vacancies and softer asking-rent achievability than the comps imply.
- What's the recent tenant-quality profile in this submarket — average credit score on applications, eviction rate, late-payment / NSF rate, and stable-employment percentage? A property-management company in the area should have these aggregated.
- How much new apartment / multifamily construction is in the pipeline within 1–3 miles? Heavy new supply (>2% of stock underway) typically softens rents 12–24 months out; light construction supports rent growth.
Investment metrics
- 1% rule
- 1.07% ✓
- Cap rate
- 5.85%
- Cash-on-cash
- -1.57%
- DSCR
- 0.93
- GRM
- 7.8
CMA / ARV
No comps found within radius.
Projected returns pro-forma
-3.0% appreciation · 8.0% rent growth · sell at horizon
- IRR
- -11.9%
- Equity multiple
- 0.54×
- Total profit
- $-27,415
- Equity at exit
- $32,057
- IRR
- 4.6%
- Equity multiple
- 1.43×
- Total profit
- $26,106
- Equity at exit
- $18,589
Cash invested: $60,200 (down + closing). Projections, not guarantees.
Landlord ↔ Tenant lean methodology
- Overall (STATE)
- 27 Tenant-Leaning
- State Maryland
- 27 Tenant-Leaning · D+14
- County
- — inherits STATE
- City
- — inherits STATE
ZIP-level market 20772
- Rents YoY
- 9.8%
- Active inventory
- 309
- Price-to-rent
- 7.8×
Monthly cashflow live
- Estimated rent
- $2,297 high interval (Pro) →
- Mortgage (P&I)
- −$1,127
- Tax from tax record
- −$214 /mo · $2,573/yr
- Insurance
- −$90
- HOA
- −$462
- Vacancy / Maint / Mgmt
- −$482
- Net cashflow
- $-79
Break-even live
UW: 25.0% down · 7.5% · 30yr · 1.5% tax · 5.0% vac · 8.0% maint · 8.0% mgmt
Financing live
Cash to close
- Down payment
- $53,750
- Closing costs
- $6,450
- Reserves months
- —
- Total cash needed
- —
Loan-product check · same deal, 3 products live
Conventional
25% down · 7.5% · 30yr
- Down + closing
- —
- Monthly P&I
- —
- Monthly cashflow
- —
- DSCR
- —
- Eligible?
- —
Personal DTI + credit; lowest rate.
DSCR
20% down · 8.5% · 30yr
- Down + closing
- —
- Monthly P&I
- —
- Monthly cashflow
- —
- DSCR
- —
- Eligible?
- —
No personal income docs; deal must DSCR.
Hard money
10% down · 12.0% · 12mo
- Down + closing
- —
- Monthly P&I
- —
- Monthly cashflow
- —
- DSCR
- —
- Eligible?
- —
Short-term bridge; refi at stabilization.
Rent comps 6 comps
| Address | Beds | Baths | Sqft | Rent | $/sqft | DOM | Units | Dist |
|---|---|---|---|---|---|---|---|---|
| 13560 Lord Sterling Pl Unit 9-4 Upper Marlboro, MD | 2.0 | 1.0 | 894 | $1,999 | $2.24 | 44d | 1 | 0.01mi |
| 4442 Lord Loudoun Ct Upper Marlboro, MD | 1.0 | 1.0 | 700 | $2,100 | $3.00 | 44d | 1 | 0.11mi |
| 14005 Lord Marlborough Pl Unit 21-5 Upper Marlboro, MD | 2.0 | 2.0 | 971 | $2,100 | $2.16 | 20d | 1 | 0.12mi |
| 13052 Salford Ter Upper Marlboro, MD | 3.0 | 3.5 | 1096 | $2,725 | $2.49 | 44d | 1 | 0.53mi |
| 13803 Bentwaters Dr Upper Marlboro, MD | 2.0 | 2.5 | 986 | $2,270 | $2.30 | 19d | 1 | 0.59mi |
| 13901 Ascott Dr Upper Marlboro, MD | 2.0 | 1.5 | 998 | $2,657 | $2.66 | 5d | 1 | 0.69mi |
HOA detail condo
- Monthly dues
- $462 · $5,544/yr
- Assessments
- None detected in remarks — confirm with the listing agent.
Listing history 6 events
-
2026-06-18days on market $215,000 Coming Soon 8 DOM
-
2026-06-17days on market $215,000 Coming Soon 7 DOM
-
2026-06-16days on market $215,000 Coming Soon 6 DOM
-
2026-06-15days on market $215,000 Coming Soon 5 DOM
-
2026-06-13remarks 413-char remark
-
2026-06-13$215,000 Coming Soon 3 DOM
ⓘ Source: listings_history table (triggers on properties + properties_extension) + one-shot
backfill from property_details.listing_events for pre-trigger history.
Tax reassessment forecast MD · Partial reset (capped growth)
- Current annual tax
- $2,573 · $214/mo
- Projected year-2 tax
- $2,573 · $214/mo
- Expected delta
- $0/yr ($0/mo · 0.0%)
ⓘ Screening estimate from a state-policy table — verify with the county assessor before closing.
Climate risk First Street
- Flood 1/10 Low FEMA zone X (unshaded) · 0% chance over 30 yrs
- Wildfire 4/10 Moderate
- Heat 8/10 Severe 7 d/yr ≥103°F today · 17 d/yr by 30 yrs out
- Wind 5/10 Major 25% chance of damaging wind over 30 yrs
- Air quality 2/10 Low 2 unhealthy d/yr today · 2 by 30 yrs out
Nearby sold comps map
Loading sold comps map…
Walkable amenities ~0.75 mi
Loading nearby amenities…
Taxation est. · year 1
- Rental income
- $27,569
- − Mortgage interest
- −$12,043
- − Property taxes
- −$2,573
- − Insurance
- −$1,075
- − Repairs & maintenance
- −$2,206
- − Management
- −$2,206
- − HOA
- −$5,544
- − Depreciation
- −$6,255
- Taxable loss
- −$4,332
- Est. tax savings @ 24.0%
- +$1,040
- After-tax cash flow
- $97/yr
For passive investors: Depreciation is non-cash, so a rental often shows a tax loss while cash-flowing — sheltering income. Rental losses are passive: they offset passive income freely, and up to $25,000/yr can offset ordinary (W-2) income if you actively participate and your MAGI is under $100k (phasing out to $0 by $150k); unused losses carry forward. On sale, claimed depreciation is recaptured at up to 25%, and gains may owe capital-gains tax (a 1031 exchange can defer both). Figures are a year-1 estimate at your 24.0% rate — not tax advice; consult a CPA.
Schools (NCES district)
- District
- Prince George'S County Public Schools
- NCES district ID
- 2400510
- Math proficiency
- 8% ▼ -11.00%
- Reading proficiency
- 24% ▼ -9.00%
- Median HH income
- $73,967
- Composite
- 16.82/100
- National rank
- #9151
- State rank
- #21 of 24 in MD
Livability — Marlboro Village
- Score
- 66/100
- State rank
- #226
- US rank
- #11335
Category grades
Schools grade is shown separately in the Schools card above.
Census & demographics
- Census place
- Marlboro Village, MD
- County
- Prince Georges County · 919,866 people
- Metro
- Washington-Arlington-Alexandria, DC-VA-MD-WV
- Population (ZIP)
- 54,319
- Household income
- $139,403
- Rent vs Own
- Severe rent burden
- 524.0
Population outlook (Prince George's County) Hauer SSP2
- Today (2025)
- 1,005,426 people
- By 2030
- 1,048,416 · +4.3%
- By 2040
- 1,123,425 · +11.7%
- By 2050
- 1,183,220 · +17.7%
- By 2075
- 1,306,202 · +29.9%
- By 2100
- 1,408,179 · +40.1%
Race, ethnicity, and origin ACS 2023
- Neighborhood character
- Predominantly Black (78%)
- Race & ethnicity
- Black 78% White 10% Hispanic / Latino 7% Two or more races 5% Asian 1%
- Hispanic origin (detail)
- Mexican 1%
- Foreign-born
- 10% · Canada, China
- Languages at home
- 88% English-only · Spanish 5% French/Haitian/Cajun 1% Other Indo-European 1%
Political lean MEDSL · Prince George's
- 2024 margin
- Solid D (+75.2) · D 86.3% · R 11.2% · Other 2.5%
- 2008→2024 swing
- -3.3pp toward R · 2008: 78.5pp · 2024: 75.2pp
- All cycles
- 2024: D+75.2 2020: D+80.5 2016: D+81.0 2012: D+80.9 2008: D+78.5
Not yet ingested
- Civics
- —
Market trends
- HPI YoY
- ▼ -184.63%
- Current HPI
- 251.8236
- Rent YoY
- ▲ 9.80%
- Metro
- Washington-Arlington-Alexandria, DC-VA-MD-WV
- State GDP YoY
- ▲ 2.97%
- F500 in state
- 12
Industry mix (Fortune 500 HQ in MD)
| Industry | F500 HQs | Revenue |
|---|---|---|
| Aerospace / Defense | 1 | $71B |
|
||
| Utilities | 1 | $25B |
|
||
| Hotels | 1 | $24B |
|
||
| Consumer Goods | 1 | $7B |
|
||
| Real Estate | 1 | $6B |
|
||
| Chemicals | 1 | $2B |
|
||
Price history
+140.2% since first listed36 events — show timeline
- 2026-06-11 Coming Soon $215,000 BRIGHT MLS
- 2026-02-26 Listing Removed — BRIGHT MLS
- 2025-12-02 Price Changed $195,000 BRIGHT MLS
- 2025-11-12 Price Changed $215,000 BRIGHT MLS
- 2025-11-12 Relisted — BRIGHT MLS
- 2025-10-22 Pending — BRIGHT MLS
- 2025-10-21 Price Changed $205,000 BRIGHT MLS
- 2025-10-14 Rental Removed $2,300 BRIGHTMLS
- 2025-10-14 Price Changed $195,000 BRIGHT MLS
- 2025-10-03 Relisted — BRIGHT MLS
- 2025-10-02 Listing Removed — BRIGHT MLS
- 2025-10-01 Listed $202,000 BRIGHT MLS
- 2025-09-16 Price Changed $202,000 BRIGHT MLS
- 2025-08-28 Coming Soon — BRIGHT MLS
- 2025-06-05 Listed for Rent $2,300 BRIGHTMLS
- 2022-01-24 Sold (Public Records) $172,000 Public Records
- 2021-12-10 Sold (MLS) $172,000 BRIGHT MLS
- 2021-11-13 Pending — BRIGHT MLS
- 2021-11-03 Relisted — BRIGHT MLS
- 2021-10-30 Listing Removed — BRIGHT MLS
- 2021-10-27 Relisted — BRIGHT MLS
- 2021-10-25 Listing Removed — BRIGHT MLS
- 2021-10-13 Price Changed $165,000 BRIGHT MLS
- 2021-10-13 Relisted — BRIGHT MLS
- 2021-08-18 Listed $155,000 BRIGHT MLS
- 2021-08-18 Listing Removed — BRIGHT MLS
- 2006-10-31 Sold (MLS) $204,990 MRIS
- 2006-09-21 Sold (Public Records) $206,000 Public Records
- 2006-08-21 Delisted — MRIS
- 2006-08-16 Listed $204,990 MRIS
- 2005-02-09 Sold (Public Records) $144,000 Public Records
- 2005-02-09 Sold (Public Records) $144,000 Public Records
- 2004-12-10 Sold (MLS) $144,000 MRIS
- 2004-11-01 Delisted — MRIS
- 2004-10-29 Listed $146,500 MRIS
- 2001-10-09 Sold (Public Records) $89,500 Public Records
Property tax history
+4.3%/yrLatest (2025): $2,573 · +13.4% YoY. Source: county tax records.
Cash-flow waterfall
monthlySold comps — $/sqft
last 12 mo · ≤1 miLoading sold comps…