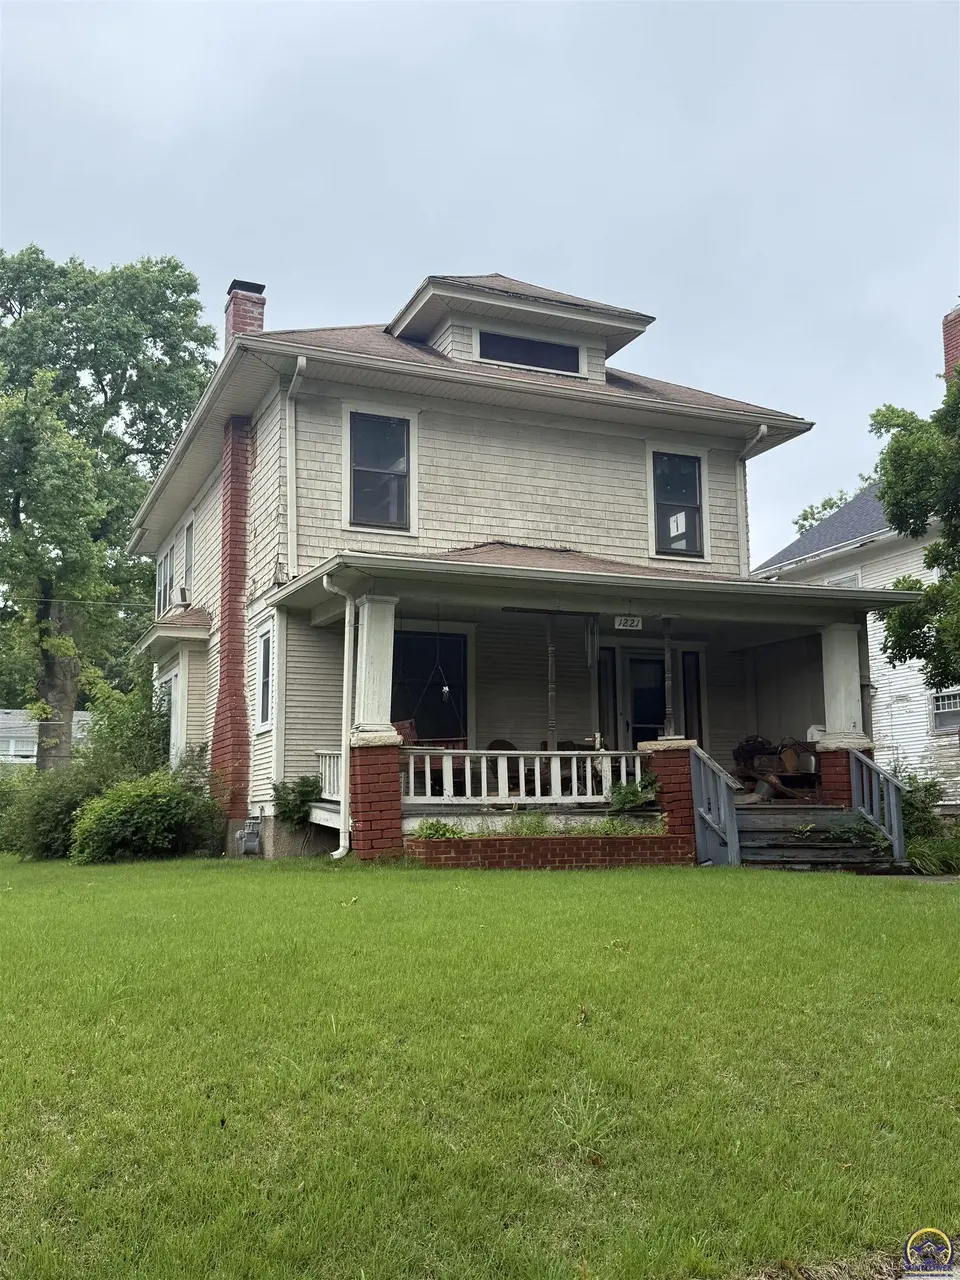
1221 SW Mulvane St · Topeka, KS
Flood risk 1/10 · Minimal
- FEMA flood zone
- X (unshaded)
- Chance of flooding over 30 yrs
- 0.0%
- Est. flood insurance / yr
- $473 – $860
Fire risk 1/10 · Minimal
- Est. fire insurance / yr
- $1,154 – $2,142
Heat risk 4/10 · Minor
- Hot days now (above 107°F)
- 7 days/yr
- Hot days in 30 yrs
- 16 days/yr
Wind risk 2/10 · Minimal
- Chance of severe wind over 30 yrs
- —
Air-quality risk 3/10 · Minor
- Unhealthy air days now
- 3 days/yr
- Unhealthy air days in 30 yrs
- 4 days/yr
Risk factors via First Street. Map © Google.
Why this score? — see what drove the B- grade
The composite is a weighted blend of 9 inputs, each scored 0–100. Each bar is that input's sub-score; the figure is the points it added to the 100-point composite (weight × sub-score).
- Cash flow +30.0/30.0
- 1% rule +10.0/10.0
- DSCR +10.0/10.0
- ARV discount +7.5/15.0
- Rent growth +3.6/5.0
- Livability +3.5/5.0
- Condition / age +2.5/5.0
- Schools +1.7/10.0
- Appreciation +0.0/10.0
$70,000
🖨 Deal sheet 📄 Offer letter ✓ Due diligence
Listing remarks
Opportunity is knocking at 1221 SW Mulvane! Priced approximately $30,000 below county appraisal, this fixer-upper is ready for its next owner to bring it back to life. Whether you're an investor searching for your next project or a buyer looking to build equity through hard work and vision, this property offers tremendous potential at an affordable price. Conveniently located in the heart of Topeka, you'll be just minutes from downtown, local hospitals, the library, shopping, dining, and have quick access to other areas of town via 12th Street. Its central location makes it an excellent opportunity for homeowners, investors, or those looking to add to their rental portfolio. This property i
Key facts
- Central location
- 7,405 sq ft lot
- Garage
Tags
Property features AI
Exterior
- Parking: Detached 1-car garage
- Utilities: Public water; Public sewer
- Home design: Single-family residence; Located in the Elmhurst subdivision
- Construction: Frame construction with wood siding
- Exterior features: Fenced yard; Composition roof
Interior
- Flooring: Hardwood flooring; Carpeted areas
- Bathrooms: 1 full bathroom; 1 half bathroom
- Heating & cooling: Window unit(s) for cooling
- Interior features: Gas water heater; Basement present
- Laundry & utility: Laundry located in the basement
Neighborhood map
What this means for you Summary
Snapshot
- This is a 3-bed/1.5-bath single-family listed at $70k.
Deal economics
- At list price, monthly cash flow is $508 ($6k/yr) — positive.
- The deal already cash-flows at list — no discount required.
- Meets the 1% rule at list price ($1k rent vs $70k).
- Cap rate 15.0% vs local median 4.3% in Topeka — top-decile yield for the area; either an underpriced asset or a hidden risk that comps aren't pricing in. Stress-test before assuming the spread holds.
Location & tenants
- Location reads 69/100 on livability (#195 in KS) — a middle-class / working-renter tenant base. Strengths: cost of living A+, housing A+, health & safety A+; Watch: employment C-, crime F, commute F.
- Topeka Public Schools (urban): math 17% / reading 23% proficiency, ranked #158 of 169 in KS (top 94%) — low school quality limits family demand, transient renter base, plan for 1-2y turnover; 69% free/reduced lunch — lower-income household profile, screen leases tightly.
- Zoned schools: Lowman Hill Elem (math 17% / reading 22%, grade F, #593 of 684 statewide, top 89%, 308 students, 88% FRL); Robinson Middle School (math 10% / reading 19%, grade F, #180 of 219 statewide, top 83%, 360 students, 84% FRL); Topeka High (math 11% / reading 20%, grade F, #248 of 327 statewide, top 76%, 1,514 students, 72% FRL).
- Market conditions: Rents rising fast (+4.4%/yr); 130 active listings in the ZIP; 13 comparable units currently listed for rent nearby; rentals at typical pace (median 21d on market — plan ~3-4 weeks tenant-placement turnaround); 219 units permitted in Shawnee County in 2024 (25 in 5+ unit buildings).
Forward outlook
- Local home prices are declining (-3.0%/yr); year-one equity from $484 of loan paydown is wiped out by about $2k of value loss. Plan a longer hold.
- Shawnee County population projected to shrink 7% by 2050 — rents likely to lag national; underwrite the cash flow, not the appreciation.
- At projected returns (-3.0% appreciation + 4.4% rent growth), your $20k cash investment doubles in ~4 years — after that, you're playing with house money.
Negotiation context
- Only 4 days on market — expect competitive offers; lowballing is unlikely to land.
Risks & watch-outs
- Watch-outs: built in 1910 — expect roof / HVAC / electrical / plumbing capex.
Questions for the listing agent
- Built in 1910 — when were the roof, HVAC, electrical panel, plumbing, and water heater last replaced?
- Is there a deadline driving the sale (1031 exchange, divorce, estate, relocation)? That informs how much negotiation room exists.
- Schools are D-rated, which usually means shorter tenancies and higher turnover. Who's the typical renter profile here, and what's been the actual vacancy rate?
- Crime grade is F in this area — have there been break-ins, vandalism, or insurance claims at this property in the last 3 years? What carrier currently insures it and at what premium?
- What's the average days-on-market for RENTAL listings here right now (not sales)? A rising rental-DOM trend means longer vacancies and softer asking-rent achievability than the comps imply.
- What's the recent tenant-quality profile in this submarket — average credit score on applications, eviction rate, late-payment / NSF rate, and stable-employment percentage? A property-management company in the area should have these aggregated.
- How much new for-sale + rental construction is in the pipeline within 1–3 miles? Heavy new supply typically softens prices + rents 12–24 months out; constrained supply supports both.
Investment metrics
- 1% rule
- 1.87% ✓
- Cap rate
- 15.00%
- Cash-on-cash
- 31.09%
- DSCR
- 2.38
- GRM
- 4.5
CMA / ARV
- ARV (on-the-fly)
- $181,440
- Comps found
- 4
Show comp detail 4 sales within ~0.75 mi
| Address | Dist | Beds/Ba | Sqft | Sold | Price | $/sf | Match |
|---|---|---|---|---|---|---|---|
| 1216 SW Woodward Ave | 0.22mi | 3/1.5 | 1,690 (+1%) | 18mo | $169,900 | $101 | 74 |
| 1020 / 1024 SW Fillmore St | 0.62mi | 3/1.0 | 1,630 (-3%) | 2mo | $124,000 | $76 | 63 |
| 1193 SW Jewell Ave | 0.20mi | 4/2.0 (+1) | 1,460 (-13%) | 11mo | $157,900 | $108 | 52 |
| 2706 SW Lee Ct | 0.64mi | 3/2.0 | 1,549 (-8%) | 18mo | $190,000 | $123 | 40 |
Match score weights: distance 35% · size 25% · config 20% · recency 20%. Top-matched comps best support the ARV.
Projected returns pro-forma
-3.0% appreciation · 4.39% rent growth · sell at horizon
- IRR
- 27.6%
- Equity multiple
- 2.17×
- Total profit
- $22,897
- Equity at exit
- $10,437
- IRR
- 35.9%
- Equity multiple
- 4.55×
- Total profit
- $69,589
- Equity at exit
- $6,052
Cash invested: $19,600 (down + closing). Projections, not guarantees.
Landlord ↔ Tenant lean methodology
- Overall (STATE)
- 83 Strongly Landlord-Friendly
- State Kansas
- 83 Strongly Landlord-Friendly · R+10
- County
- — inherits STATE
- City
- — inherits STATE
ZIP-level market 66604
- Rents YoY
- 4.4%
- Active inventory
- 130
- Price-to-rent
- 4.5×
Monthly cashflow live
- Estimated rent
- $1,307 high interval (Pro) →
- Mortgage (P&I)
- −$367
- Tax from tax record
- −$129 /mo · $1,544/yr
- Insurance
- −$29
- HOA
- −$0
- Vacancy / Maint / Mgmt
- −$275
- Net cashflow
- $508
Break-even live
UW: 25.0% down · 7.5% · 30yr · 1.5% tax · 5.0% vac · 8.0% maint · 8.0% mgmt
Financing live
Cash to close
- Down payment
- $17,500
- Closing costs
- $2,100
- Reserves months
- —
- Total cash needed
- —
Loan-product check · same deal, 3 products live
Conventional
25% down · 7.5% · 30yr
- Down + closing
- —
- Monthly P&I
- —
- Monthly cashflow
- —
- DSCR
- —
- Eligible?
- —
Personal DTI + credit; lowest rate.
DSCR
20% down · 8.5% · 30yr
- Down + closing
- —
- Monthly P&I
- —
- Monthly cashflow
- —
- DSCR
- —
- Eligible?
- —
No personal income docs; deal must DSCR.
Hard money
10% down · 12.0% · 12mo
- Down + closing
- —
- Monthly P&I
- —
- Monthly cashflow
- —
- DSCR
- —
- Eligible?
- —
Short-term bridge; refi at stabilization.
Rent comps 13 comps
| Address | Beds | Baths | Sqft | Rent | $/sqft | DOM | Units | Dist |
|---|---|---|---|---|---|---|---|---|
| 1275 SW Mulvane St Topeka, KS | 3.0 | 1.5 | 1791 | $1,350 | $0.75 | 21d | 1 | 0.15mi |
| 937 SW Jewell Ave Topeka, KS | 3.0 | 1.0 | 1297 | $1,295 | $1.00 | 21d | 1 | 0.57mi |
| 1647 SW Buchanan St Topeka, KS | 3.0 | 2.0 | 1550 | $1,395 | $0.90 | 21d | 1 | 0.63mi |
| 1268 SW Western Ave Unit 1A Topeka, KS | 2.0 | 1.0 | 1404 | $1,000 | $0.71 | 21d | 1 | 0.64mi |
| 1415 SW Western Ave Topeka, KS | 4.0 | 1.0 | 1190 | $1,400 | $1.18 | 21d | 1 | 0.69mi |
| 1116 SW 18th St Topeka, KS | 3.0 | 1.0 | 1105 | $1,175 | $1.06 | 21d | 1 | 0.74mi |
| 822 SW 8th Ave Topeka, KS | 3.0 | 1.5 | 1600 | $1,025 | $0.64 | 21d | 1 | 0.87mi |
| 1624 SW Polk St Topeka, KS | 3.0 | 2.0 | 1288 | $1,350 | $1.05 | 21d | 1 | 0.89mi |
| 1936 SW Clay St Topeka, KS | 3.0 | 1.0 | 1572 | $1,000 | $0.64 | 21d | 1 | 0.95mi |
| 416 SW Clay St Topeka, KS | 3.0 | 1.0 | 1639 | $1,025 | $0.63 | 21d | 1 | 1.10mi |
| 520 SW 5th St Topeka, KS | 4.0 | 1.0 | 1224 | $1,250 | $1.02 | 21d | 1 | 1.26mi |
| 111 NW Quinton Ave Topeka, KS | 3.0 | 1.5 | 1232 | $1,045 | $0.85 | 21d | 1 | 1.44mi |
| 703 SW Parkview St Topeka, KS | 3.0 | 2.0 | 1922 | $1,995 | $1.04 | 21d | 1 | 1.48mi |
Listing history 5 events
-
2026-06-15status $70,000 Pending 4 DOM
-
2026-06-15days on market $70,000 Active 4 DOM
-
2026-06-14days on market $70,000 Active 2 DOM
-
2026-06-13remarks 699-char remark
-
2026-06-13$70,000 Active 1 DOM
ⓘ Source: listings_history table (triggers on properties + properties_extension) + one-shot
backfill from property_details.listing_events for pre-trigger history.
Tax reassessment forecast KS · Resets to sale price
- Current annual tax
- $1,544 · $129/mo
- Projected year-2 tax
- $1,544 · $129/mo
- Expected delta
- $0/yr ($0/mo · 0.0%)
ⓘ Screening estimate from a state-policy table — verify with the county assessor before closing.
Climate risk First Street
- Flood 1/10 Low FEMA zone X (unshaded) · 0% chance over 30 yrs
- Wildfire 1/10 Low
- Heat 4/10 Moderate 7 d/yr ≥107°F today · 16 d/yr by 30 yrs out
- Wind 2/10 Low
- Air quality 3/10 Moderate 3 unhealthy d/yr today · 4 by 30 yrs out
Nearby sold comps map
Loading sold comps map…
Walkable amenities ~0.75 mi
Loading nearby amenities…
Taxation est. · year 1
- Rental income
- $15,686
- − Mortgage interest
- −$3,921
- − Property taxes
- −$1,544
- − Insurance
- −$350
- − Repairs & maintenance
- −$1,255
- − Management
- −$1,255
- − Depreciation
- −$2,036
- Taxable income
- $5,325
- Est. tax owed @ 24.0%
- −$1,278
- After-tax cash flow
- $4,815/yr
For passive investors: Depreciation is non-cash, so a rental often shows a tax loss while cash-flowing — sheltering income. Rental losses are passive: they offset passive income freely, and up to $25,000/yr can offset ordinary (W-2) income if you actively participate and your MAGI is under $100k (phasing out to $0 by $150k); unused losses carry forward. On sale, claimed depreciation is recaptured at up to 25%, and gains may owe capital-gains tax (a 1031 exchange can defer both). Figures are a year-1 estimate at your 24.0% rate — not tax advice; consult a CPA.
Schools (NCES district)
- District
- Topeka Public Schools
- NCES district ID
- 2012260
- Math proficiency
- 17% ▼ -8.00%
- Reading proficiency
- 23% ▼ -2.00%
- Median HH income
- $37,405
- Composite
- 16.69/100
- National rank
- #9167
- State rank
- #158 of 169 in KS
Livability — Topeka
- Score
- 69/100
- State rank
- #195
- US rank
- #8848
Category grades
Schools grade is shown separately in the Schools card above.
Census & demographics
- Census place
- Topeka, KS
- County
- Shawnee County · 118,130 people
- City population
- 118,130
- Metro
- Topeka, KS
- Population (ZIP)
- 23,006
- Household income
- $60,874
- Rent vs Own
- Severe rent burden
- 1192.0
Population outlook (Shawnee County) Hauer SSP2
- Today (2025)
- 179,277 people
- By 2030
- 177,762 · -0.8%
- By 2040
- 172,341 · -3.9%
- By 2050
- 166,330 · -7.2%
- By 2075
- 152,417 · -15.0%
- By 2100
- 134,782 · -24.8%
Race, ethnicity, and origin ACS 2023
- Neighborhood character
- Predominantly White (70%)
- Race & ethnicity
- White 70% Hispanic / Latino 15% Two or more races 11% Black 6% Asian 1%
- Hispanic origin (detail)
- Mexican 12%
- Common ancestry
- Slovak 2% Lithuanian 2% Romanian 1%
- Foreign-born
- 4% · Canada, China
- Languages at home
- 94% English-only · Spanish 4% Other Asian/Pacific 1% Other Indo-European 1%
Political lean MEDSL · Shawnee
- 2024 margin
- Toss-up / Even · D 49.3% · R 48.8% · Other 2.0%
- 2008→2024 swing
- +0.8pp no change · 2008: -0.3pp · 2024: 0.5pp
- All cycles
- 2024: D+0.5 2020: D+3.0 2016: R+2.8 2012: R+1.7 2008: R+0.3
Not yet ingested
- Civics
- —
Market trends
- HPI YoY
- ▼ -151.78%
- Current HPI
- 227.637
- Rent YoY
- ▲ 4.39%
- Metro
- Topeka, KS
- State GDP YoY
- —
- F500 in state
- 0
Price history
1 event — show timeline
- 2026-06-11 Listed $70,000 Sunflower MLS as distributed by MLS GRID
Property tax history
+2.1%/yrLatest (2025): $1,544 · +5.1% YoY. Source: county tax records.
Cash-flow waterfall
monthlySold comps — $/sqft
last 12 mo · ≤1 miLoading sold comps…