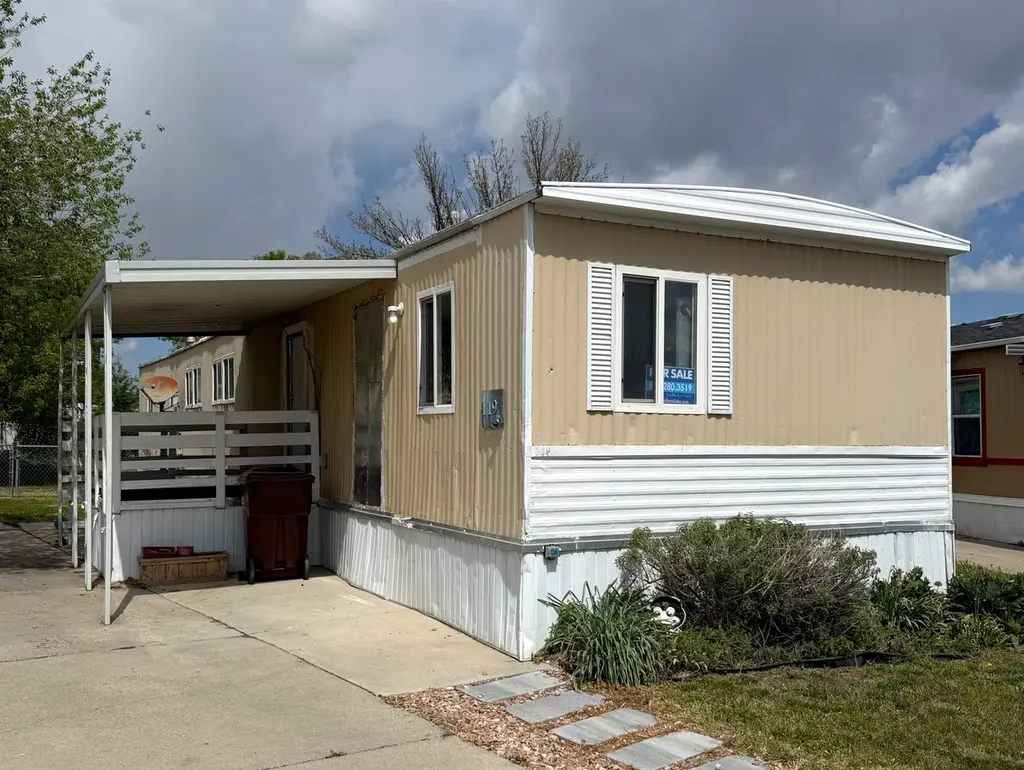
8400 S 4000 W #119 · West Jordan, UT
Flood risk 1/10 · Minimal
- FEMA flood zone
- X (unshaded)
- Chance of flooding over 30 yrs
- 0.0%
- Est. flood insurance / yr
- $507 – $1,088
Fire risk 1/10 · Minimal
- Est. fire insurance / yr
- $453 – $841
Heat risk 4/10 · Minor
- Hot days now (above 95°F)
- 6 days/yr
- Hot days in 30 yrs
- 15 days/yr
Wind risk 1/10 · Minimal
- Chance of severe wind over 30 yrs
- —
Air-quality risk 3/10 · Minor
- Unhealthy air days now
- 2 days/yr
- Unhealthy air days in 30 yrs
- 3 days/yr
Risk factors via First Street. Map © Google.
Why this score? — see what drove the B- grade
The composite is a weighted blend of 9 inputs, each scored 0–100. Each bar is that input's sub-score; the figure is the points it added to the 100-point composite (weight × sub-score).
- Cash flow +30.0/30.0
- 1% rule +10.0/10.0
- DSCR +10.0/10.0
- ARV discount +7.5/15.0
- Livability +4.0/5.0
- Schools +3.8/10.0
- Condition / age +2.5/5.0
- Rent growth +2.1/5.0
- Appreciation +0.0/10.0
$55,000
🖨 Deal sheet 📄 Offer letter ✓ Due diligence
Listing remarks
* THIS IS A RESALE LISTING * You'll love living in this 3 bedroom, 1 bathroom home within a wonderful family-friendly community. Check out the awesome amenities your community has to offer such as community events, a basketball court, a picnic area / pavilion / grill, and more! This home won't be on the market long, so call us today for more information or to schedule a tour. Deposits & Fees are subject to change.
Key facts
- Built 2026
- Listed 46 days
Property features AI
Finance
- Other: Located at 8400 S 4000 W #119, West Jordan, UT 84088; Listing status: Active
- Financial info: List price $55,000
Exterior
- Utilities: Natural gas available
- Home design: Spec-built plan 93632; Single-level entry
Interior
- Bedrooms: 3 bedrooms
- Bathrooms: 1 full bathroom
- Heating & cooling: Natural gas heating
- Interior features: 960 finished living area
Neighborhood map
What this means for you Summary
Snapshot
- This is a 3-bed/1.0-bath manufactured listed at $55k.
Deal economics
- At list price, monthly cash flow is $1k ($15k/yr) — positive.
- The deal already cash-flows at list — no discount required.
- Meets the 1% rule at list price ($2k rent vs $55k).
- Recommended offer: $53k (3.0% below list) — sets the bar for market timing.
Location & tenants
- Location reads 80/100 on livability (#34 in UT, #1,632 nationally) — a professional / high-income tenant draw. Strengths: commute A+, employment A+, housing A+; Watch: schools C-, cost of living D+.
- Jordan District (suburban): math 38% / reading 43% proficiency, ranked #36 of 80 in UT (top 45%) — families likely to look elsewhere, expect single-tenant / working-renter base with shorter leases.
- Market conditions: Rents soft (-1.5%/yr); 114 active listings in the ZIP; 6 comparable units currently listed for rent nearby; rentals leasing fast (median 2d on market — plan ~1-2 weeks tenant-placement turnaround); solid renter incomes; 4,970 units permitted in Salt Lake County in 2024 (1,963 in 5+ unit buildings).
Forward outlook
- Local home prices are declining (-3.0%/yr); year-one equity from $380 of loan paydown is wiped out by about $2k of value loss. Plan a longer hold.
- Salt Lake County population projected at +37% by 2050 — long-run rental-demand tailwind backs the buy-and-hold thesis.
- At projected returns (-3.0% appreciation + 0.0% rent growth), your $15k cash investment doubles in ~2 years — after that, you're playing with house money.
Negotiation context
- It's been on market 47 days — a 3% lower offer ($53k) is reasonable based on typical stale-listing flexibility.
Questions for the listing agent
- It's been on market 47 days. Have you received any prior offers? Is the seller open to a 3% concession, seller financing, or rate buy-down credit?
- Is there a deadline driving the sale (1031 exchange, divorce, estate, relocation)? That informs how much negotiation room exists.
- What's the average days-on-market for RENTAL listings here right now (not sales)? A rising rental-DOM trend means longer vacancies and softer asking-rent achievability than the comps imply.
- What's the recent tenant-quality profile in this submarket — average credit score on applications, eviction rate, late-payment / NSF rate, and stable-employment percentage? A property-management company in the area should have these aggregated.
- How much new for-sale + rental construction is in the pipeline within 1–3 miles? Heavy new supply typically softens prices + rents 12–24 months out; constrained supply supports both.
Investment metrics
- 1% rule
- 3.75% ✓
- Cap rate
- 33.51%
- Cash-on-cash
- 97.21%
- DSCR
- 5.33
- GRM
- 2.2
CMA / ARV
No comps found within radius.
Projected returns pro-forma
-3.0% appreciation · 0.0% rent growth · sell at horizon
- IRR
- 94.8%
- Equity multiple
- 5.19×
- Total profit
- $64,539
- Equity at exit
- $8,201
- IRR
- 96.9%
- Equity multiple
- 9.79×
- Total profit
- $135,306
- Equity at exit
- $4,755
Cash invested: $15,400 (down + closing). Projections, not guarantees.
Landlord ↔ Tenant lean methodology
- Overall (STATE)
- 86 Strongly Landlord-Friendly
- State Utah
- 86 Strongly Landlord-Friendly · R+15
- County
- — inherits STATE
- City
- — inherits STATE
ZIP-level market 84088
- Rents YoY
- -1.5%
- Active inventory
- 114
- Price-to-rent
- 2.2×
Monthly cashflow live
- Estimated rent
- $2,060 high interval (Pro) →
- Mortgage (P&I)
- −$288
- Tax est. 1.5%
- −$69 /mo · $825/yr
- Insurance
- −$23
- HOA
- −$0
- Vacancy / Maint / Mgmt
- −$433
- Net cashflow
- $1,248
Break-even live
UW: 25.0% down · 7.5% · 30yr · 1.5% tax · 5.0% vac · 8.0% maint · 8.0% mgmt
Financing live
Cash to close
- Down payment
- $13,750
- Closing costs
- $1,650
- Reserves months
- —
- Total cash needed
- —
Loan-product check · same deal, 3 products live
Conventional
25% down · 7.5% · 30yr
- Down + closing
- —
- Monthly P&I
- —
- Monthly cashflow
- —
- DSCR
- —
- Eligible?
- —
Personal DTI + credit; lowest rate.
DSCR
20% down · 8.5% · 30yr
- Down + closing
- —
- Monthly P&I
- —
- Monthly cashflow
- —
- DSCR
- —
- Eligible?
- —
No personal income docs; deal must DSCR.
Hard money
10% down · 12.0% · 12mo
- Down + closing
- —
- Monthly P&I
- —
- Monthly cashflow
- —
- DSCR
- —
- Eligible?
- —
Short-term bridge; refi at stabilization.
Rent comps 6 comps
| Address | Beds | Baths | Sqft | Rent | $/sqft | DOM | Units | Dist |
|---|---|---|---|---|---|---|---|---|
| 8771 S Jordan Valley Way West Jordan, UT | 3.0 | 1.0–2.0 | 826 | $2,057 | $2.49 | 1d | 42 | 0.63mi |
| 3361 W Jordan Line Pkwy West Jordan, UT | 2.0 | 1.0–2.0 | 941 | $2,439 | $2.59 | 1d | 42 | 0.71mi |
| 3354 W Jordan Line Pkwy West Jordan, UT | 3.0 | 1.0–2.0 | 1005 | $2,281 | $2.27 | 2d | 16 | 0.71mi |
| 3283 W Jordan Line Pkwy West Jordan, UT | 2.0 | 1.0–2.0 | 930 | $1,988 | $2.14 | 2d | 9 | 0.77mi |
| 3375 W 7800 S West Jordan, UT | 1.0–3.0 | 1.0–2.0 | 905 | $1,984 | $2.19 | 2d | 30 | 0.92mi |
| 4698 Colander Dr Unit B West Jordan, UT | 3.0 | 1.0 | 1100 | $1,400 | $1.27 | 21d | 1 | 1.12mi |
Listing history 9 events
-
2026-06-15days on market $55,000 Active 47 DOM
-
2026-06-13days on market $55,000 Active 45 DOM
-
2026-06-09days on market $55,000 Active 41 DOM
-
2026-06-08days on market $55,000 Active 40 DOM
-
2026-06-07days on market $55,000 Active 39 DOM
-
2026-06-03days on market $55,000 Active 35 DOM
-
2026-06-02days on market $55,000 Active 34 DOM
-
2026-06-01days on market $55,000 Active 33 DOM
-
2026-05-31days on market $55,000 Active 32 DOM
ⓘ Source: listings_history table (triggers on properties + properties_extension) + one-shot
backfill from property_details.listing_events for pre-trigger history.
Climate risk First Street
- Flood 1/10 Low FEMA zone X (unshaded) · 0% chance over 30 yrs
- Wildfire 1/10 Low
- Heat 4/10 Moderate 6 d/yr ≥95°F today · 15 d/yr by 30 yrs out
- Wind 1/10 Low
- Air quality 3/10 Moderate 2 unhealthy d/yr today · 3 by 30 yrs out
Nearby sold comps map
Loading sold comps map…
Walkable amenities ~0.75 mi
Loading nearby amenities…
Taxation est. · year 1
- Rental income
- $24,724
- − Mortgage interest
- −$3,081
- − Property taxes
- −$825
- − Insurance
- −$275
- − Repairs & maintenance
- −$1,978
- − Management
- −$1,978
- − Depreciation
- −$1,600
- Taxable income
- $14,987
- Est. tax owed @ 24.0%
- −$3,597
- After-tax cash flow
- $11,374/yr
For passive investors: Depreciation is non-cash, so a rental often shows a tax loss while cash-flowing — sheltering income. Rental losses are passive: they offset passive income freely, and up to $25,000/yr can offset ordinary (W-2) income if you actively participate and your MAGI is under $100k (phasing out to $0 by $150k); unused losses carry forward. On sale, claimed depreciation is recaptured at up to 25%, and gains may owe capital-gains tax (a 1031 exchange can defer both). Figures are a year-1 estimate at your 24.0% rate — not tax advice; consult a CPA.
Schools (NCES district)
- District
- Jordan District
- NCES district ID
- 4900420
- Math proficiency
- 38% ▼ -7.00%
- Reading proficiency
- 43% ▼ -4.00%
- Median HH income
- $78,154
- Composite
- 37.59/100
- National rank
- #4384
- State rank
- #36 of 80 in UT
Livability — West Jordan
- Score
- 80/100
- State rank
- #34
- US rank
- #1632
Category grades
Schools grade is shown separately in the Schools card above.
Census & demographics
- Census place
- West Jordan, UT
- County
- Salt Lake County · 1,195,750 people
- City population
- 123,084
- Metro
- Salt Lake City, UT
- Population (ZIP)
- 39,228
- Household income
- $105,142
- Rent vs Own
- Severe rent burden
- 777.0
Population outlook (Salt Lake County) Hauer SSP2
- Today (2025)
- 1,305,860 people
- By 2030
- 1,402,611 · +7.4%
- By 2040
- 1,594,533 · +22.1%
- By 2050
- 1,787,244 · +36.9%
- By 2075
- 2,224,138 · +70.3%
- By 2100
- 2,551,390 · +95.4%
Race, ethnicity, and origin ACS 2023
- Neighborhood character
- Predominantly White (67%)
- Race & ethnicity
- White 67% Hispanic / Latino 25% Two or more races 10% Asian 3% Native American 1% Pacific Islander 1%
- Hispanic origin (detail)
- Mexican 18%
- Common ancestry
- Slovak 3% Italian 2% Iranian 2%
- Foreign-born
- 13% · Canada, Jamaica, China
- Languages at home
- 78% English-only · Spanish 17% Other Indo-European 1% Other Asian/Pacific 1%
Political lean MEDSL · Salt Lake
- 2024 margin
- D (+10.2) · D 53.7% · R 43.5% · Other 2.8%
- 2008→2024 swing
- +10.1pp toward D · 2008: 0.1pp · 2024: 10.2pp
- All cycles
- 2024: D+10.2 2020: D+11.0 2016: D+10.2 2012: R+19.3 2008: D+0.1
Not yet ingested
- Civics
- —
Market trends
- HPI YoY
- ▼ -259.12%
- Current HPI
- 321.656
- Rent YoY
- ▼ -1.51%
- Metro
- Salt Lake City, UT
- State GDP YoY
- ▲ 3.54%
- F500 in state
- 2
Industry mix (Fortune 500 HQ in UT)
| Industry | F500 HQs | Revenue |
|---|---|---|
| Financial Services | 1 | $3B |
|
||
Cash-flow waterfall
monthlySold comps — $/sqft
last 12 mo · ≤1 miLoading sold comps…