 Multi-family
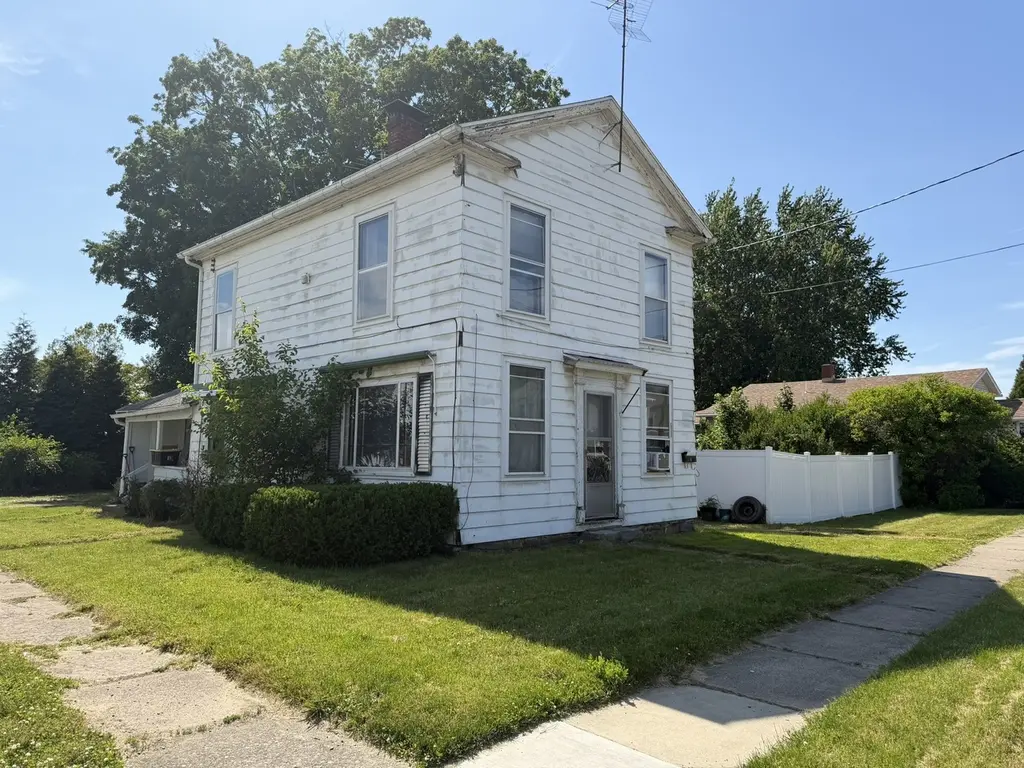
6 Vine St · Girard, PA
Flood risk 1/10 · Minimal
- FEMA flood zone
- X (unshaded)
- Chance of flooding over 30 yrs
- 0.0%
- Est. flood insurance / yr
- $473 – $860
Fire risk 1/10 · Minimal
- Est. fire insurance / yr
- $511 – $949
Heat risk 3/10 · Minor
- Hot days now (above 91°F)
- 7 days/yr
- Hot days in 30 yrs
- 20 days/yr
Wind risk 1/10 · Minimal
- Chance of severe wind over 30 yrs
- —
Air-quality risk 3/10 · Minor
- Unhealthy air days now
- 2 days/yr
- Unhealthy air days in 30 yrs
- 4 days/yr
Risk factors via First Street. Map © Google.
Why this score? — see what drove the B grade
The composite is a weighted blend of 9 inputs, each scored 0–100. Each bar is that input's sub-score; the figure is the points it added to the 100-point composite (weight × sub-score).
- Cash flow +30.0/30.0
- 1% rule +10.0/10.0
- DSCR +10.0/10.0
- ARV discount +7.5/15.0
- Schools +4.7/10.0
- Livability +4.2/5.0
- Rent growth +2.5/5.0
- Condition / age +2.5/5.0
- Appreciation +0.0/10.0
$110,000
🖨 Deal sheet 📄 Offer letter ✓ Due diligence
Multi-family units
County records classify this as Multi-Family (2-4 Unit). Listing-text estimate: 1 unit. estimate disagrees with records
Listing remarks MLS
Two unit investment in Girard, on a double corner lot. The first floor features 3 bedrooms with a large dining room, kitchen area & living room. Upstairs unit features one bedroom, includes the shed in yard. Both units have off-street parking & yard.
Key facts
- Two-unit property
- In-unit laundry
- Off-street parking
Tags
Property features AI
Finance
- Financial info: Actual rent: Unit 1 $600, Unit 2 $600
Exterior
- Parking: 2 parking spaces
- Utilities: Public water; Public sewer
- Home design: Residential income property (multi-family); Two stories; R-2 zoning
- Construction: Aluminum siding; Composition roof
- Exterior features: Corner lot; Paved road access
Interior
- Kitchen: Unit 1: Refrigerator; Unit 2: Range/Oven, Refrigerator
- Bedrooms: Unit 1: 3 bedrooms; Unit 2: 1 bedroom
- Bathrooms: Unit 1: 1 bathroom; Unit 2: 1 bathroom
- Heating & cooling: Forced air heating; No central cooling
- Interior features: Basement tenant use
- Laundry & utility: Unit 2: Laundry
Neighborhood map
What this means for you Summary
Snapshot
- This is a 3-bed/2.0-bath multifamily listed at $110k.
Deal economics
- At list price, monthly cash flow is $646 ($8k/yr) — positive.
- The deal already cash-flows at list — no discount required.
- Meets the 1% rule at list price ($2k rent vs $110k).
Location & tenants
- Location reads 83/100 on livability (#125 in PA, #971 nationally) — a professional / high-income tenant draw. Strengths: crime A+, cost of living A+, housing A+; Watch: amenities C-, commute F.
- Girard SD (suburban): math 48% / reading 64% proficiency, ranked #113 of 539 in PA (top 21%) — acceptable for families but not a draw, mixed tenant base, ~2y average lease.
- Market conditions: 32 active listings in the ZIP; 364 units permitted in Erie County in 2024 (188 in 5+ unit buildings).
Forward outlook
- Local home prices are declining (-3.0%/yr); year-one equity from $761 of loan paydown is wiped out by about $3k of value loss. Plan a longer hold.
- Erie County population projected at -14% by 2050 — secular population decline; favor cash flow + early exit over multi-decade hold.
- At projected returns (-3.0% appreciation + 3.0% rent growth), your $31k cash investment doubles in ~5 years — after that, you're playing with house money.
Negotiation context
- Only 14 days on market — expect competitive offers; lowballing is unlikely to land.
- 5 sale attempts since 10y ago with the ask held roughly flat each time — persistent listings suggest the price (not the market) is what's stuck; bring a comps-based counter.
- Current owner paid $70k; list at $110k implies a 57% gain — meaningful room to come down on a strong offer.
Risks & watch-outs
- Watch-outs: built in 1900 — expect roof / HVAC / electrical / plumbing capex.
Questions for the listing agent
- Built in 1900 — when were the roof, HVAC, electrical panel, plumbing, and water heater last replaced?
- Is there a deadline driving the sale (1031 exchange, divorce, estate, relocation)? That informs how much negotiation room exists.
- Schools are A-rated — typically a magnet for longer-tenancy family renters. What's the average tenant stay here, and is there a school-zone premium baked into asking?
- What's the average days-on-market for RENTAL listings here right now (not sales)? A rising rental-DOM trend means longer vacancies and softer asking-rent achievability than the comps imply.
- What's the recent tenant-quality profile in this submarket — average credit score on applications, eviction rate, late-payment / NSF rate, and stable-employment percentage? A property-management company in the area should have these aggregated.
- How much new apartment / multifamily construction is in the pipeline within 1–3 miles? Heavy new supply (>2% of stock underway) typically softens rents 12–24 months out; light construction supports rent growth.
Investment metrics
- 1% rule
- 1.62% ✓
- Cap rate
- 13.34%
- Cash-on-cash
- 25.15%
- DSCR
- 2.12
- GRM
- 5.1
CMA / ARV
No comps found within radius.
Projected returns pro-forma
-3.0% appreciation · 3.0% rent growth · sell at horizon
- IRR
- 18.7%
- Equity multiple
- 1.76×
- Total profit
- $23,324
- Equity at exit
- $16,401
- IRR
- 27.0%
- Equity multiple
- 3.38×
- Total profit
- $73,379
- Equity at exit
- $9,511
Cash invested: $30,800 (down + closing). Projections, not guarantees.
Landlord ↔ Tenant lean methodology
- Overall (STATE)
- 62 Landlord-Friendly
- State Pennsylvania
- 62 Landlord-Friendly · EVEN
- County
- — inherits STATE
- City
- — inherits STATE
ZIP-level market 16417
- Home prices YoY
- -34.5%
- Active inventory
- 32
- Price-to-rent
- 9.6×
Monthly cashflow live
- Estimated rent
- $1,786 medium interval (Pro) →
- Mortgage (P&I)
- −$577
- Tax from tax record
- −$143 /mo · $1,712/yr
- Insurance
- −$46
- HOA
- −$0
- Vacancy / Maint / Mgmt
- −$375
- Net cashflow
- $646
Break-even live
2-unit breakdown (identical units grouped — click to expand)
| Units | Beds | Baths | Est. rent |
|---|---|---|---|
| 1× unit | 3 | 1.5 | $957 |
| 1× unit | 1 | 1 | $828 |
| Total (2 units) | $1,786 | ||
UW: 25.0% down · 7.5% · 30yr · 1.5% tax · 5.0% vac · 8.0% maint · 8.0% mgmt
Financing live
Cash to close
- Down payment
- $27,500
- Closing costs
- $3,300
- Reserves months
- —
- Total cash needed
- —
Loan-product check · same deal, 3 products live
Conventional
25% down · 7.5% · 30yr
- Down + closing
- —
- Monthly P&I
- —
- Monthly cashflow
- —
- DSCR
- —
- Eligible?
- —
Personal DTI + credit; lowest rate.
DSCR
20% down · 8.5% · 30yr
- Down + closing
- —
- Monthly P&I
- —
- Monthly cashflow
- —
- DSCR
- —
- Eligible?
- —
No personal income docs; deal must DSCR.
Hard money
10% down · 12.0% · 12mo
- Down + closing
- —
- Monthly P&I
- —
- Monthly cashflow
- —
- DSCR
- —
- Eligible?
- —
Short-term bridge; refi at stabilization.
Listing history 11 events
-
2026-06-18days on market $110,000 Active 14 DOM
-
2026-06-17days on market $110,000 Active 13 DOM
-
2026-06-16days on market $110,000 Active 12 DOM
-
2026-06-15days on market $110,000 Active 11 DOM
-
2026-06-13days on market $110,000 Active 9 DOM
-
2026-06-12days on market $110,000 Active 8 DOM
-
2026-06-09days on market $110,000 Active 5 DOM
-
2026-06-08days on market $110,000 Active 4 DOM
-
2026-06-08days on market $110,000 Active 3 DOM
-
2026-06-07remarks 602-char remark
-
2026-06-07$110,000 Active 2 DOM
ⓘ Source: listings_history table (triggers on properties + properties_extension) + one-shot
backfill from property_details.listing_events for pre-trigger history.
Tax reassessment forecast PA · Partial reset (capped growth)
- Current annual tax
- $1,712 · $143/mo
- Projected year-2 tax
- $1,725 · $144/mo
- Expected delta
- +$13/yr (+$1/mo · 0.8%)
ⓘ Screening estimate from a state-policy table — verify with the county assessor before closing.
Climate risk First Street
- Flood 1/10 Low FEMA zone X (unshaded) · 0% chance over 30 yrs
- Wildfire 1/10 Low
- Heat 3/10 Moderate 7 d/yr ≥91°F today · 20 d/yr by 30 yrs out
- Wind 1/10 Low
- Air quality 3/10 Moderate 2 unhealthy d/yr today · 4 by 30 yrs out
Nearby sold comps map
Loading sold comps map…
Walkable amenities ~0.75 mi
Loading nearby amenities…
Taxation est. · year 1
- Rental income
- $21,432
- − Mortgage interest
- −$6,162
- − Property taxes
- −$1,712
- − Insurance
- −$550
- − Repairs & maintenance
- −$1,715
- − Management
- −$1,715
- − Depreciation
- −$3,200
- Taxable income
- $6,379
- Est. tax owed @ 24.0%
- −$1,531
- After-tax cash flow
- $6,216/yr
For passive investors: Depreciation is non-cash, so a rental often shows a tax loss while cash-flowing — sheltering income. Rental losses are passive: they offset passive income freely, and up to $25,000/yr can offset ordinary (W-2) income if you actively participate and your MAGI is under $100k (phasing out to $0 by $150k); unused losses carry forward. On sale, claimed depreciation is recaptured at up to 25%, and gains may owe capital-gains tax (a 1031 exchange can defer both). Figures are a year-1 estimate at your 24.0% rate — not tax advice; consult a CPA.
Schools (NCES district)
- District
- Girard SD
- NCES district ID
- 4210740
- Math proficiency
- 48% ▼ -16.00%
- Reading proficiency
- 64% ▼ -10.00%
- Median HH income
- $47,089
- Composite
- 47.42/100
- National rank
- #2283
- State rank
- #113 of 539 in PA
Livability — Girard
- Score
- 83/100
- State rank
- #125
- US rank
- #971
Category grades
Schools grade is shown separately in the Schools card above.
Census & demographics
- Census place
- Girard, PA
- Population (ZIP)
- 8,400
Population outlook (Erie County) Hauer SSP2
- Today (2025)
- 272,159 people
- By 2030
- 266,299 · -2.2%
- By 2040
- 250,987 · -7.8%
- By 2050
- 234,925 · -13.7%
- By 2075
- 199,164 · -26.8%
- By 2100
- 162,985 · -40.1%
Race, ethnicity, and origin ACS 2023
- Neighborhood character
- Predominantly White (96%)
- Race & ethnicity
- White 96% Two or more races 2% Hispanic / Latino 2%
- Common ancestry
- Romanian 7% Italian 2% Lithuanian 2%
- Foreign-born
- 1% · South Korea
- Languages at home
- 98% English-only · Spanish 1% Russian/Polish/Slavic 1%
Political lean MEDSL · Erie
- 2024 margin
- Toss-up / Even · D 49.0% · R 50.0%
- 2008→2024 swing
- -20.9pp toward R · 2008: 19.9pp · 2024: -1.0pp
- All cycles
- 2024: R+1.0 2020: D+1.0 2016: R+2.0 2012: D+16.9 2008: D+19.9
Not yet ingested
- Civics
- —
Market trends
- HPI YoY
- ▼ -120.88%
- Current HPI
- 229.4345
- Rent YoY
- —
- Metro
- —
- State GDP YoY
- ▲ 1.68%
- F500 in state
- 34
Industry mix (Fortune 500 HQ in PA)
| Industry | F500 HQs | Revenue |
|---|---|---|
| Healthcare | 2 | $309B |
|
||
| Insurance | 2 | $27B |
|
||
| Telecommunications / Media | 1 | $124B |
|
||
| Industrial Distribution | 1 | $22B |
|
||
| Financial Services | 1 | $20B |
|
||
| Chemicals / Materials | 1 | $18B |
|
||
Price history
+266.7% since first listed9 events — show timeline
- 2026-06-03 Listed $110,000 GEBOR
- 2022-08-31 Sold (Public Records) $70,000 Public Records
- 2022-08-31 Sold (MLS) $70,000 GEBOR
- 2022-08-31 Sold (MLS) $70,000 West Penn MLS
- 2022-04-28 Listed $75,900 GEBOR
- 2022-04-28 Listed $75,900 West Penn MLS
- 2021-04-29 Listed $85,900 GEBOR
- 2016-02-20 Listed $57,900 GEBOR
- 2007-02-15 Sold (Public Records) $30,000 Public Records
Property tax history
+3.7%/yrLatest (2026): $1,712 · +7.6% YoY. Source: county tax records.
Cash-flow waterfall
monthlySold comps — $/sqft
last 12 mo · ≤1 miLoading sold comps…