 🏷️ Likely Rental
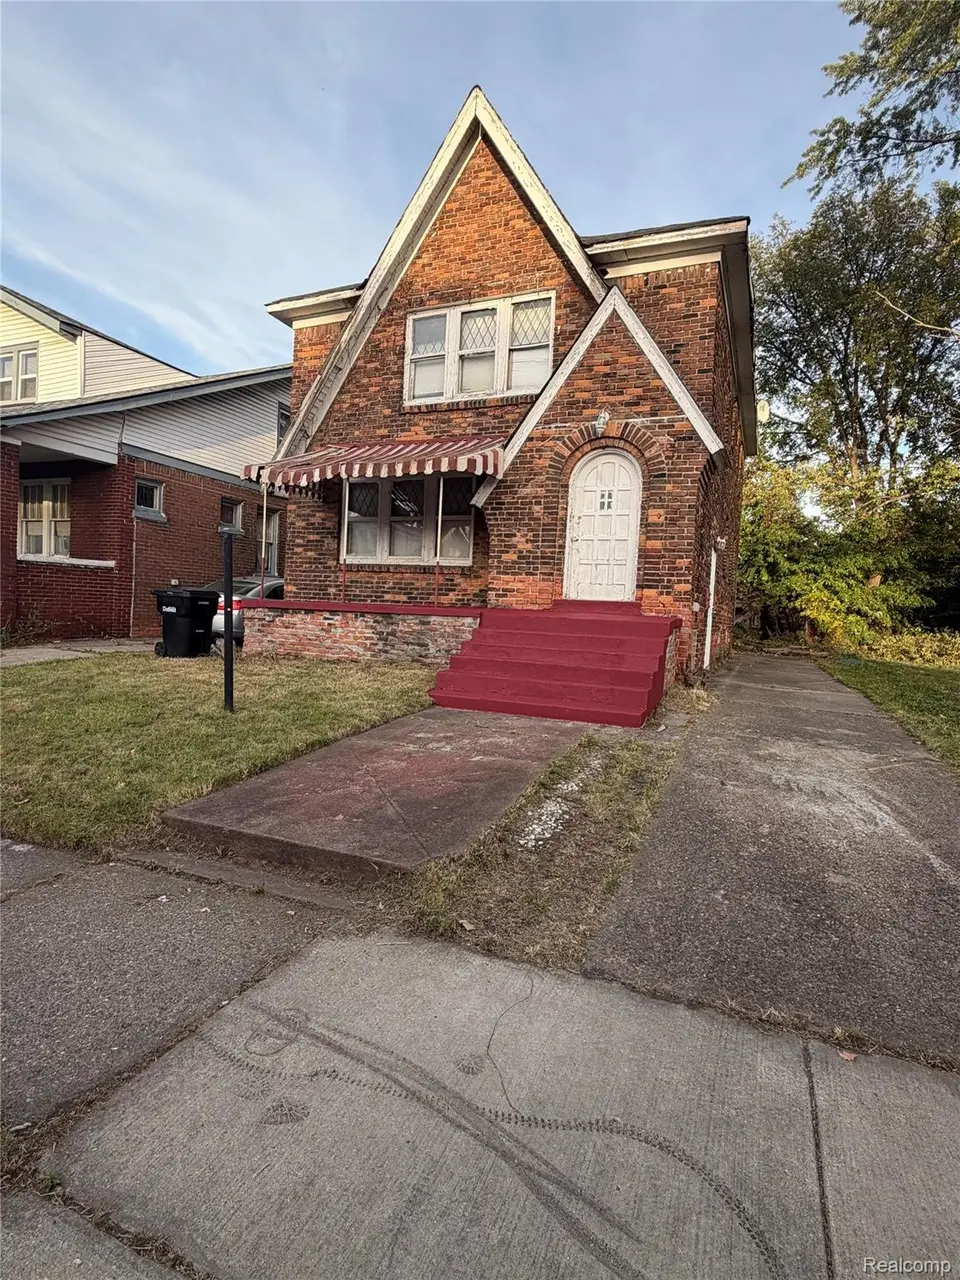
8264 Cloverlawn St · Detroit, MI
Flood risk 1/10 · Minimal
- FEMA flood zone
- X (unshaded)
- Chance of flooding over 30 yrs
- 0.0%
- Est. flood insurance / yr
- $473 – $860
Fire risk 1/10 · Minimal
- Est. fire insurance / yr
- $784 – $1,456
Heat risk 3/10 · Minor
- Hot days now (above 96°F)
- 7 days/yr
- Hot days in 30 yrs
- 15 days/yr
Wind risk 2/10 · Minimal
- Chance of severe wind over 30 yrs
- —
Air-quality risk 3/10 · Minor
- Unhealthy air days now
- 2 days/yr
- Unhealthy air days in 30 yrs
- 5 days/yr
Risk factors via First Street. Map © Google.
Why this score? — see what drove the A- grade
The composite is a weighted blend of 9 inputs, each scored 0–100. Each bar is that input's sub-score; the figure is the points it added to the 100-point composite (weight × sub-score).
- Cash flow +30.0/30.0
- ARV discount +15.0/15.0
- 1% rule +10.0/10.0
- DSCR +10.0/10.0
- Appreciation +10.0/10.0
- Livability +3.7/5.0
- Rent growth +2.5/5.0
- Condition / age +2.5/5.0
- Schools +1.3/10.0
$75,000
🖨 Deal sheet 📄 Offer letter ✓ Due diligence
Listing remarks MLS
Multi-Family Investment Opportunity Located just outside the desirable Aviation Subdivision on Detroit’s west side, presents a strong value-add opportunity for investors seeking cash flow and long-term appreciation. This solid brick, two-unit multifamily property features two spacious two-bedroom apartments, each offering: Two, two-bedroom apartments equipped with: • Expansive living room with fireplace • Formal dining room • Functional kitchen layout • Full bathrooms •Two generously sized bedrooms The property retains classic architectural character and offers substantial upside potential. While it does require cosmetic updates, the structure itself is solid—making it an ideal light-rehab project for investors looking to build equity quickly. Additional features include a massive basement with two large, separate storage areas—one designated for each unit—providing added convenience for tenants and increased rental appeal. With current two-bedroom payment standards through Michigan State Housing Development Authority (MSHDA), is $1313 per two bedroom, this property has projected income of $2626 per month and $31, 512 per year. Presents a compelling opportunity for Section 8 or other housing assistance rental strategies. Whether you’re expanding your portfolio or entering the multifamily market, this is a prime opportunity in a stable west-side Detroit location. THIS DEAL WILL GO FAST! ACT NOW!
Key facts
- Formal dining room
- Massive basement
- Full bathrooms
Tags
Neighborhood map
What this means for you Summary
Snapshot
- This is a 4-bed/1.5-bath townhouse listed at $75k.
Deal economics
- At list price, monthly cash flow is $711 ($9k/yr) — positive.
- The deal already cash-flows at list — no discount required.
- Meets the 1% rule at list price ($1k rent vs $75k).
- Recommended offer: $70k (6.0% below list) — sets the bar for market timing.
- Cap rate 17.7% vs local median 10.2% in Detroit — top-decile yield for the area; either an underpriced asset or a hidden risk that comps aren't pricing in. Stress-test before assuming the spread holds.
Location & tenants
- Location reads 73/100 on livability (#218 in MI) — a middle-class / working-renter tenant base. Strengths: amenities A+, commute A+, cost of living A+; Watch: schools F, crime F, employment F.
- Detroit Public Schools Community District (urban): math 10% / reading 24% proficiency, ranked #499 of 540 in MI (top 92%) — low school quality limits family demand, transient renter base, plan for 1-2y turnover; 90% free/reduced lunch — lower-income household profile, screen leases tightly.
- Market conditions: 244 active listings in the ZIP; 6 comparable units currently listed for rent nearby; rentals at typical pace (median 17d on market — plan ~3-4 weeks tenant-placement turnaround); lower-income renter base — watch delinquency; 2,639 units permitted in Wayne County in 2024 (1,216 in 5+ unit buildings).
- At $1,492/mo this rent would consume 52% of the median local household income ($34k/yr) (locally 1418% of renters already pay >50% of income on rent) — very limited rent-growth headroom before tenants either downsize or default.
Forward outlook
- In year one you build about $8k of equity ($519 loan paydown + $8k appreciation (10.0% local appreciation)).
- Wayne County population projected at -17% by 2050 — secular population decline; favor cash flow + early exit over multi-decade hold.
- At projected returns (10.0% appreciation + 3.0% rent growth), your $21k cash investment doubles in ~2 years — after that, you're playing with house money.
- By year 5, paydown + projected appreciation supports a ~$37k cash-out refi (75% LTV) — recoverable capital for the next deal without selling this one.
Negotiation context
- It's been on market 76 days — a 6% lower offer ($70k) is reasonable based on typical stale-listing flexibility.
- 4 sale attempts with the ask held roughly flat each time — persistent listings suggest the price (not the market) is what's stuck; bring a comps-based counter.
- Current owner paid $49k; list at $75k implies a 53% gain — meaningful room to come down on a strong offer.
Risks & watch-outs
- Watch-outs: built in 1929 — expect roof / HVAC / electrical / plumbing capex.
Questions for the listing agent
- It's been on market 76 days. Have you received any prior offers? Is the seller open to a 6% concession, seller financing, or rate buy-down credit?
- Built in 1929 — when were the roof, HVAC, electrical panel, plumbing, and water heater last replaced?
- Why hasn't it sold? Are there any deal-killer items the seller is aware of (foundation, flood, title, zoning, code violations)?
- Is there a deadline driving the sale (1031 exchange, divorce, estate, relocation)? That informs how much negotiation room exists.
- Schools are F-rated, which usually means shorter tenancies and higher turnover. Who's the typical renter profile here, and what's been the actual vacancy rate?
- Crime grade is F in this area — have there been break-ins, vandalism, or insurance claims at this property in the last 3 years? What carrier currently insures it and at what premium?
- What's the average days-on-market for RENTAL listings here right now (not sales)? A rising rental-DOM trend means longer vacancies and softer asking-rent achievability than the comps imply.
- What's the recent tenant-quality profile in this submarket — average credit score on applications, eviction rate, late-payment / NSF rate, and stable-employment percentage? A property-management company in the area should have these aggregated.
- How much new for-sale + rental construction is in the pipeline within 1–3 miles? Heavy new supply typically softens prices + rents 12–24 months out; constrained supply supports both.
Investment metrics
- 1% rule
- 1.99% ✓
- Cap rate
- 17.67%
- Cash-on-cash
- 40.63%
- DSCR
- 2.81
- GRM
- 4.2
CMA / ARV
- ARV (median comp)
- $119,037
- List price
- $75,000
- Delta
- -36.99%
- Verdict
- UNDERPRICED
- Comps
- 2 within 2.0 mi
Projected returns pro-forma
10.0% appreciation · 3.0% rent growth · sell at horizon
- IRR
- 55.7%
- Equity multiple
- 5.10×
- Total profit
- $86,121
- Equity at exit
- $67,566
- IRR
- 49.3%
- Equity multiple
- 11.38×
- Total profit
- $217,984
- Equity at exit
- $145,709
Cash invested: $21,000 (down + closing). Projections, not guarantees.
Landlord ↔ Tenant lean methodology
- Overall (STATE)
- 62 Landlord-Friendly
- State Michigan
- 62 Landlord-Friendly · EVEN
- County
- — inherits STATE
- City
- — inherits STATE
ZIP-level market 48204
- Home prices YoY
- 18.5%
- Active inventory
- 244
- Price-to-rent
- 4.2×
Monthly cashflow live
- Estimated rent
- $1,492 high interval (Pro) →
- Mortgage (P&I)
- −$393
- Tax from tax record
- −$43 /mo · $515/yr
- Insurance
- −$31
- HOA
- −$0
- Vacancy / Maint / Mgmt
- −$313
- Net cashflow
- $711
Break-even live
UW: 25.0% down · 7.5% · 30yr · 1.5% tax · 5.0% vac · 8.0% maint · 8.0% mgmt
Financing live
Cash to close
- Down payment
- $18,750
- Closing costs
- $2,250
- Reserves months
- —
- Total cash needed
- —
Loan-product check · same deal, 3 products live
Conventional
25% down · 7.5% · 30yr
- Down + closing
- —
- Monthly P&I
- —
- Monthly cashflow
- —
- DSCR
- —
- Eligible?
- —
Personal DTI + credit; lowest rate.
DSCR
20% down · 8.5% · 30yr
- Down + closing
- —
- Monthly P&I
- —
- Monthly cashflow
- —
- DSCR
- —
- Eligible?
- —
No personal income docs; deal must DSCR.
Hard money
10% down · 12.0% · 12mo
- Down + closing
- —
- Monthly P&I
- —
- Monthly cashflow
- —
- DSCR
- —
- Eligible?
- —
Short-term bridge; refi at stabilization.
Rent comps 6 comps
| Address | Beds | Baths | Sqft | Rent | $/sqft | DOM | Units | Dist |
|---|---|---|---|---|---|---|---|---|
| 8320 Northlawn St Detroit, MI | 3.0 | 1.0 | 1737 | $1,550 | $0.89 | 20d | 1 | 0.08mi |
| 8230 Ohio St Detroit, MI | 3.0 | 1.0 | 1350 | $1,200 | $0.89 | 16d | 1 | 0.08mi |
| 8143 Wisconsin St Detroit, MI | 4.0 | 1.0 | 1370 | $1,800 | $1.31 | 1d | 1 | 0.19mi |
| 9209 Pinehurst St Detroit, MI | 3.0 | 1.0 | 1589 | $1,500 | $0.94 | 43d | 1 | 0.92mi |
| 5315 Spokane St Detroit, MI | 3.0 | 1.0 | 2110 | $1,200 | $0.57 | 16d | 1 | 1.21mi |
| 4915 Maplewood St Detroit, MI | 3.0 | 1.0 | 1324 | $1,100 | $0.83 | 16d | 1 | 1.48mi |
Listing history 9 events
-
2026-05-31days on market $75,000 Active 76 DOM
-
2026-03-16$75,000 Active 1475-char remark
Show marketing remark (1513 chars)
Multi-Family Investment Opportunity Located just outside the desirable Aviation Subdivision on Detroit's west side, presents a strong value-add opportunity for investors seeking cash flow and long-term appreciation. This solid brick, two-unit multifamily property features two spacious two-bedroom apartments, each offering: Two, two-bedroom apartments equipped with: • Expansive living room with fireplace • Formal dining room • Functional kitchen layout • Full bathrooms •Two generously sized bedrooms The property retains classic architectural character and offers substantial upside potential. While it does require cosmetic updates, the structure itself is solid - making it an ideal light-rehab project for investors looking to build equity quickly. Additional features include a massive basement with two large, separate storage areas - one designated for each unit - providing added convenience for tenants and increased rental appeal. With current two-bedroom payment standards through Michigan State Housing Development Authority (MSHDA), is $1313 per two bedroom, this property has projected income of $2626 per month and $31, 512 per year. Presents a compelling opportunity for Section 8 or other housing assistance rental strategies. Whether you're expanding your portfolio or entering the multifamily market, this is a prime opportunity in a stable west-side Detroit location. THIS DEAL WILL GO FAST! ACT NOW!
-
2026-03-16$75,000 Active 1513-char remark
Show marketing remark (1513 chars)
Multi-Family Investment Opportunity Located just outside the desirable Aviation Subdivision on Detroit's west side, presents a strong value-add opportunity for investors seeking cash flow and long-term appreciation. This solid brick, two-unit multifamily property features two spacious two-bedroom apartments, each offering: Two, two-bedroom apartments equipped with: • Expansive living room with fireplace • Formal dining room • Functional kitchen layout • Full bathrooms •Two generously sized bedrooms The property retains classic architectural character and offers substantial upside potential. While it does require cosmetic updates, the structure itself is solid - making it an ideal light-rehab project for investors looking to build equity quickly. Additional features include a massive basement with two large, separate storage areas - one designated for each unit - providing added convenience for tenants and increased rental appeal. With current two-bedroom payment standards through Michigan State Housing Development Authority (MSHDA), is $1313 per two bedroom, this property has projected income of $2626 per month and $31, 512 per year. Presents a compelling opportunity for Section 8 or other housing assistance rental strategies. Whether you're expanding your portfolio or entering the multifamily market, this is a prime opportunity in a stable west-side Detroit location. THIS DEAL WILL GO FAST! ACT NOW!
-
2026-02-28historical
-
2026-02-28historical
-
2026-02-15$75,000 Active
-
2026-02-15$75,000 Active
-
2006-08-10soldstatus $49,000
-
2006-08-01soldstatus $96,000
ⓘ Source: listings_history table (triggers on properties + properties_extension) + one-shot
backfill from property_details.listing_events for pre-trigger history.
Tax reassessment forecast MI · Partial reset (capped growth)
- Current annual tax
- $515 · $43/mo
- Projected year-2 tax
- $835 · $70/mo
- Expected delta
- +$320/yr (+$27/mo · 62.2%)
ⓘ Screening estimate from a state-policy table — verify with the county assessor before closing.
Climate risk First Street
- Flood 1/10 Low FEMA zone X (unshaded) · 0% chance over 30 yrs
- Wildfire 1/10 Low
- Heat 3/10 Moderate 7 d/yr ≥96°F today · 15 d/yr by 30 yrs out
- Wind 2/10 Low
- Air quality 3/10 Moderate 2 unhealthy d/yr today · 5 by 30 yrs out
Nearby sold comps map
Loading sold comps map…
Walkable amenities ~0.75 mi
Loading nearby amenities…
Taxation est. · year 1
- Rental income
- $17,900
- − Mortgage interest
- −$4,201
- − Property taxes
- −$515
- − Insurance
- −$375
- − Repairs & maintenance
- −$1,432
- − Management
- −$1,432
- − Depreciation
- −$2,182
- Taxable income
- $7,763
- Est. tax owed @ 24.0%
- −$1,863
- After-tax cash flow
- $6,669/yr
For passive investors: Depreciation is non-cash, so a rental often shows a tax loss while cash-flowing — sheltering income. Rental losses are passive: they offset passive income freely, and up to $25,000/yr can offset ordinary (W-2) income if you actively participate and your MAGI is under $100k (phasing out to $0 by $150k); unused losses carry forward. On sale, claimed depreciation is recaptured at up to 25%, and gains may owe capital-gains tax (a 1031 exchange can defer both). Figures are a year-1 estimate at your 24.0% rate — not tax advice; consult a CPA.
Schools (NCES district)
- District
- Detroit Public Schools Community District
- NCES district ID
- 2601103
- Math proficiency
- 10% ▼ -2.00%
- Reading proficiency
- 24% ▲ 6.00%
- Median HH income
- $25,815
- Composite
- 13.06/100
- National rank
- #9564
- State rank
- #499 of 540 in MI
Livability — Detroit
- Score
- 73/100
- State rank
- #218
- US rank
- #5427
Category grades
Schools grade is shown separately in the Schools card above.
Census & demographics
- Census place
- Detroit, MI
- County
- Wayne County · 1,562,939 people
- City population
- 572,865
- Metro
- Detroit-Warren-Dearborn, MI
- Population (ZIP)
- 20,696
- Household income
- $34,468
- Rent vs Own
- Severe rent burden
- 1418.0
Population outlook (Wayne County) Hauer SSP2
- Today (2025)
- 1,675,273 people
- By 2030
- 1,620,300 · -3.3%
- By 2040
- 1,502,341 · -10.3%
- By 2050
- 1,384,039 · -17.4%
- By 2075
- 1,124,592 · -32.9%
- By 2100
- 881,193 · -47.4%
Race, ethnicity, and origin ACS 2023
- Neighborhood character
- Predominantly Black (86%)
- Race & ethnicity
- Black 86% Two or more races 7% Hispanic / Latino 5% White 4% Native American 2%
- Hispanic origin (detail)
- Mexican 4%
- Common ancestry
- Hispanic 1% Romanian 1%
- Foreign-born
- 2% · Canada
- Languages at home
- 95% English-only · Spanish 4%
Political lean MEDSL · Wayne
- 2024 margin
- Strong D (+29.0) · D 62.7% · R 33.7% · Other 3.6%
- 2008→2024 swing
- -20.5pp toward R · 2008: 49.5pp · 2024: 29.0pp
- All cycles
- 2024: D+29.0 2020: D+38.1 2016: D+37.3 2012: D+46.9 2008: D+49.5
Not yet ingested
- Civics
- —
Market trends
- HPI YoY
- ▲ 36.51%
- Current HPI
- 234.0465
- Rent YoY
- —
- Metro
- Detroit-Warren-Dearborn, MI
- State GDP YoY
- ▲ 1.37%
- F500 in state
- 28
Industry mix (Fortune 500 HQ in MI)
| Industry | F500 HQs | Revenue |
|---|---|---|
| Automotive Parts | 3 | $48B |
|
||
| Automotive | 2 | $372B |
|
||
| Chemicals | 1 | $45B |
|
||
| Automotive Retail | 1 | $29B |
|
||
| Healthcare / Medical Devices | 1 | $23B |
|
||
| Automotive Technology | 1 | $20B |
|
||
Price history
-21.9% since first listed8 events — show timeline
- 2026-03-16 Listed $75,000 REALCOMP
- 2026-03-16 Listed $75,000 MiRealSource-MiMLS
- 2026-02-28 Listing Removed — REALCOMP
- 2026-02-28 Listing Removed — MiRealSource-MiMLS
- 2026-02-15 Listed $75,000 REALCOMP
- 2026-02-15 Listed $75,000 MiRealSource-MiMLS
- 2006-08-10 Sold (Public Records) $49,000 Public Records
- 2006-08-01 Sold (Public Records) $96,000 Public Records
Property tax history
-11.9%/yrLatest (2025): $515 · -36.3% YoY. Source: county tax records.
Cash-flow waterfall
monthlySold comps — $/sqft
last 12 mo · ≤1 miLoading sold comps…