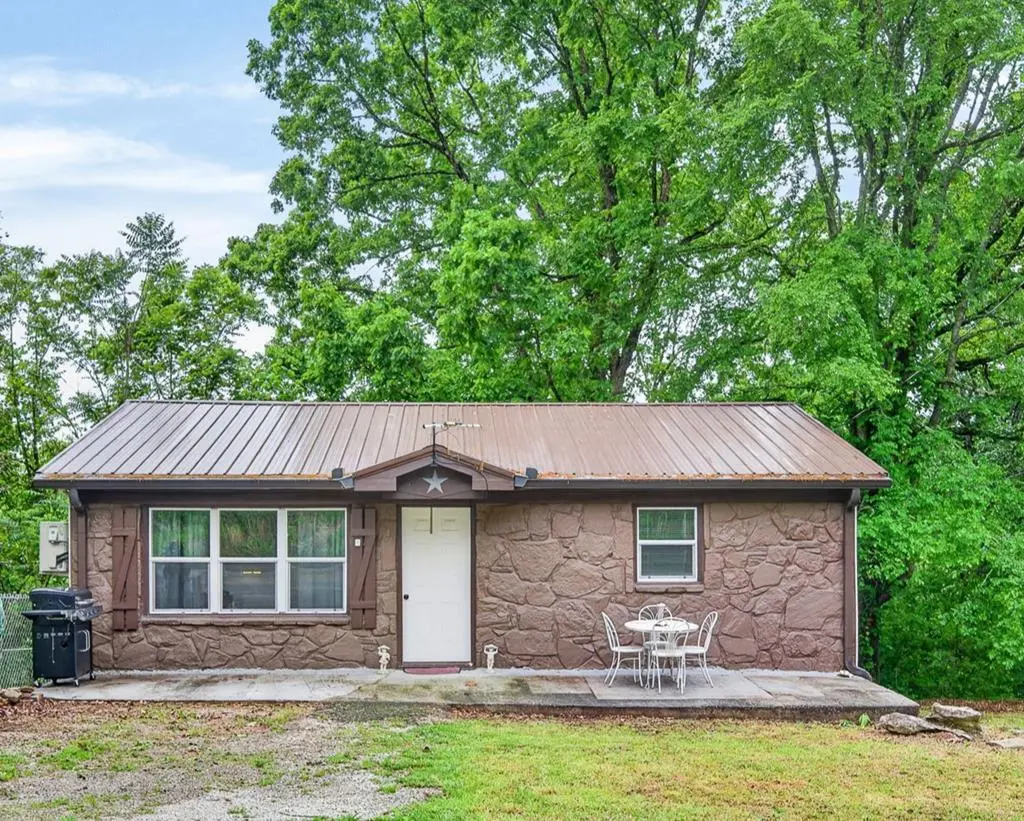
1976 Crossville Hwy · Sparta, TN
Flood risk 1/10 · Minimal
- FEMA flood zone
- X (unshaded)
- Chance of flooding over 30 yrs
- 0.0%
- Est. flood insurance / yr
- $473 – $860
Fire risk 5/10 · Moderate
- Est. fire insurance / yr
- $949 – $1,763
Heat risk 5/10 · Moderate
- Hot days now (above 102°F)
- 7 days/yr
- Hot days in 30 yrs
- 19 days/yr
Wind risk 3/10 · Minor
- Chance of severe wind over 30 yrs
- 8.0%
Air-quality risk 2/10 · Minimal
- Unhealthy air days now
- 1 days/yr
- Unhealthy air days in 30 yrs
- 3 days/yr
Risk factors via First Street. Map © Google.
Why this score? — see what drove the D grade
The composite is a weighted blend of 9 inputs, each scored 0–100. Each bar is that input's sub-score; the figure is the points it added to the 100-point composite (weight × sub-score).
- Cash flow +12.6/30.0
- ARV discount +7.5/15.0
- Appreciation +4.8/10.0
- DSCR +3.8/10.0
- Livability +3.5/5.0
- Schools +2.6/10.0
- Rent growth +2.5/5.0
- Condition / age +2.5/5.0
- 1% rule +2.2/10.0
$159,900
🖨 Deal sheet 📄 Offer letter ✓ Due diligence
Listing remarks
Looking to downsize? This charming and cozy home offers everything a couple needs. Just off the main road, low maintenance, Nature oriented, yet offering convenience to town. (Current termite letter)
Key facts
- 0.46 acre lot
- Built 1975
- Listed 49 days
Property features AI
Exterior
- Security: Smoke detector(s)
- Utilities: Public water; Septic tank sewer; Electric service with circuit breakers
- Home design: Residential single-family site-built home; R1 zoning
- Construction: Block, stone, and vinyl siding construction; Below-grade finished area present
- Exterior features: Metal roof; Satellite dish; Paved road access
Interior
- Kitchen: Dishwasher; Gas oven; Refrigerator; Microwave
- Flooring: Hardwood; Tile
- Bathrooms: 1 full bathroom
- Heating & cooling: Electric heating; Attic fan; Ceiling fans for cooling
- Interior features: Ceiling fans; Double-pane windows; Drapes; Gas water heater; Smoke detector(s)
- Laundry & utility: Washer and dryer included; Laundry on main level
Neighborhood map
What this means for you Summary
Snapshot
- This is a 2-bed/1.0-bath single-family listed at $160k.
Deal economics
- At list price, monthly cash flow is $-20 ($-244/yr) — negative.
- To cash-flow at today's rent, offer at most $156k (2.3% below list).
- To meet the 1% rule (rent ≥ 1% of price), the offer needs to be $116k (27.5% below list).
- Recommended offer: $116k (27.5% below list) — sets the bar for 1% rule.
- Cap rate 6.1% vs local median 2.7% in Sparta — top-decile yield for the area; either an underpriced asset or a hidden risk that comps aren't pricing in. Stress-test before assuming the spread holds.
Location & tenants
- Location reads 69/100 on livability (#67 in TN) — a middle-class / working-renter tenant base. Strengths: cost of living A+, housing A+, health & safety A+; Watch: schools F, amenities F, commute F.
- White County (rural): math 31% / reading 31% proficiency, ranked #56 of 139 in TN (top 40%) — families likely to look elsewhere, expect single-tenant / working-renter base with shorter leases.
- Market conditions: 354 active listings in the ZIP; 209 units permitted in White County in 2024 (0 in 5+ unit buildings).
Forward outlook
- In year one you build about $342 of equity ($1k loan paydown + $-764 appreciation (-0.5% local appreciation)).
- White County population projected at +5% by 2050 — modest demand growth; plan on rents tracking national, not racing it.
Negotiation context
- It's been on market 50 days — a 3% lower offer ($155k) is reasonable based on typical stale-listing flexibility.
- 2 sale attempts since 3y ago with the ask held roughly flat each time — persistent listings suggest the price (not the market) is what's stuck; bring a comps-based counter.
- Current owner paid $100k; list at $160k implies a 60% gain — meaningful room to come down on a strong offer.
Risks & watch-outs
- Climate carrying-cost: moderate wildfire risk; extreme-heat days projected 7→19/yr by 2055 (HVAC capex compounding) — expect insurance premiums to compound above CPI over the hold.
Questions for the listing agent
- What do current leases actually rent for vs. the listed asking? Can we see a recent rent roll and the last 12 months of T-12 income?
- It's been on market 50 days. Have you received any prior offers? Is the seller open to a 28% concession, seller financing, or rate buy-down credit?
- Built in 1975 — when were the roof, HVAC, electrical panel, plumbing, and water heater last replaced?
- Is there a deadline driving the sale (1031 exchange, divorce, estate, relocation)? That informs how much negotiation room exists.
- Schools are F-rated, which usually means shorter tenancies and higher turnover. Who's the typical renter profile here, and what's been the actual vacancy rate?
- The area grade is low — what's the realistic commute time and amenity access for the typical tenant pool here? Any planned neighborhood developments (good or bad) we should know about?
- What's the average days-on-market for RENTAL listings here right now (not sales)? A rising rental-DOM trend means longer vacancies and softer asking-rent achievability than the comps imply.
- What's the recent tenant-quality profile in this submarket — average credit score on applications, eviction rate, late-payment / NSF rate, and stable-employment percentage? A property-management company in the area should have these aggregated.
- How much new for-sale + rental construction is in the pipeline within 1–3 miles? Heavy new supply typically softens prices + rents 12–24 months out; constrained supply supports both.
Investment metrics
- 1% rule
- 0.72% ✗
- Cap rate
- 6.14%
- Cash-on-cash
- -0.55%
- DSCR
- 0.98
- GRM
- 11.5
CMA / ARV
No comps found within radius.
Projected returns pro-forma
-0.48% appreciation · 3.0% rent growth · sell at horizon
- IRR
- -4.7%
- Equity multiple
- 0.79×
- Total profit
- $-9,616
- Equity at exit
- $42,649
- IRR
- 1.5%
- Equity multiple
- 1.15×
- Total profit
- $6,652
- Equity at exit
- $48,338
Cash invested: $44,772 (down + closing). Projections, not guarantees.
Landlord ↔ Tenant lean methodology
- Overall (STATE)
- 87 Strongly Landlord-Friendly
- State Tennessee
- 87 Strongly Landlord-Friendly · R+13
- County
- — inherits STATE
- City
- — inherits STATE
ZIP-level market 38583
- Home prices YoY
- -0.1%
- Active inventory
- 354
- Price-to-rent
- 11.5×
Monthly cashflow live
- Estimated rent
- $1,159 medium interval (Pro) →
- Mortgage (P&I)
- −$839
- Tax from tax record
- −$31 /mo · $368/yr
- Insurance
- −$67
- HOA
- −$0
- Vacancy / Maint / Mgmt
- −$243
- Net cashflow
- $-20
Break-even live
UW: 25.0% down · 7.5% · 30yr · 1.5% tax · 5.0% vac · 8.0% maint · 8.0% mgmt
Financing live
Cash to close
- Down payment
- $39,975
- Closing costs
- $4,797
- Reserves months
- —
- Total cash needed
- —
Loan-product check · same deal, 3 products live
Conventional
25% down · 7.5% · 30yr
- Down + closing
- —
- Monthly P&I
- —
- Monthly cashflow
- —
- DSCR
- —
- Eligible?
- —
Personal DTI + credit; lowest rate.
DSCR
20% down · 8.5% · 30yr
- Down + closing
- —
- Monthly P&I
- —
- Monthly cashflow
- —
- DSCR
- —
- Eligible?
- —
No personal income docs; deal must DSCR.
Hard money
10% down · 12.0% · 12mo
- Down + closing
- —
- Monthly P&I
- —
- Monthly cashflow
- —
- DSCR
- —
- Eligible?
- —
Short-term bridge; refi at stabilization.
Listing history 24 events
-
2026-06-19days on market $159,900 Active 50 DOM
-
2026-06-18days on market $159,900 Active 49 DOM
-
2026-06-17days on market $159,900 Active 48 DOM
-
2026-06-16days on market $159,900 Active 47 DOM
-
2026-06-15days on market $159,900 Active 46 DOM
-
2026-06-14days on market $159,900 Active 44 DOM
-
2026-06-13days on market $159,900 Active 43 DOM
-
2026-06-10days on market $159,900 Active 41 DOM
-
2026-06-09days on market $159,900 Active 40 DOM
-
2026-06-08days on market $159,900 Active 39 DOM
-
2026-06-07days on market $159,900 Active 38 DOM
-
2026-06-03days on market $159,900 Active 34 DOM
-
2026-06-02days on market $159,900 Active 33 DOM
-
2026-06-01days on market $159,900 Active 32 DOM
-
2026-05-31days on market $159,900 Active 31 DOM
-
2026-05-30days on market $159,900 Active 30 DOM
-
2026-05-20historical Active Under Contract
-
2026-04-30$159,900 Active
-
2025-08-01soldstatus $100,000
-
2023-08-31soldstatus $90,000
-
2023-08-31soldstatus $90,000
-
2023-08-03$125,000
-
2021-02-09soldstatus $61,622
-
2002-05-22soldstatus $41,700
ⓘ Source: listings_history table (triggers on properties + properties_extension) + one-shot
backfill from property_details.listing_events for pre-trigger history.
Tax reassessment forecast TN · Resets to sale price
- Current annual tax
- $368 · $31/mo
- Projected year-2 tax
- $1,135 · $95/mo
- Expected delta
- +$767/yr (+$64/mo · 208.5%)
ⓘ Screening estimate from a state-policy table — verify with the county assessor before closing.
Climate risk First Street
- Flood 1/10 Low FEMA zone X (unshaded) · 0% chance over 30 yrs
- Wildfire 5/10 Major
- Heat 5/10 Major 7 d/yr ≥102°F today · 19 d/yr by 30 yrs out
- Wind 3/10 Moderate 8% chance of damaging wind over 30 yrs
- Air quality 2/10 Low 1 unhealthy d/yr today · 3 by 30 yrs out
Nearby sold comps map
Loading sold comps map…
Walkable amenities ~0.75 mi
Loading nearby amenities…
Taxation est. · year 1
- Rental income
- $13,906
- − Mortgage interest
- −$8,957
- − Property taxes
- −$368
- − Insurance
- −$800
- − Repairs & maintenance
- −$1,112
- − Management
- −$1,112
- − Depreciation
- −$4,652
- Taxable loss
- −$3,095
- Est. tax savings @ 24.0%
- +$743
- After-tax cash flow
- $498/yr
For passive investors: Depreciation is non-cash, so a rental often shows a tax loss while cash-flowing — sheltering income. Rental losses are passive: they offset passive income freely, and up to $25,000/yr can offset ordinary (W-2) income if you actively participate and your MAGI is under $100k (phasing out to $0 by $150k); unused losses carry forward. On sale, claimed depreciation is recaptured at up to 25%, and gains may owe capital-gains tax (a 1031 exchange can defer both). Figures are a year-1 estimate at your 24.0% rate — not tax advice; consult a CPA.
Schools (NCES district)
- District
- White County
- NCES district ID
- 4704500
- Math proficiency
- 31% ▼ -6.00%
- Reading proficiency
- 31% ▲ 1.00%
- Median HH income
- $35,292
- Composite
- 25.63/100
- National rank
- #7406
- State rank
- #56 of 139 in TN
Livability — Sparta
- Score
- 69/100
- State rank
- #67
- US rank
- #8576
Category grades
Schools grade is shown separately in the Schools card above.
Census & demographics
- Population (ZIP)
- 25,739
Population outlook (White County) Hauer SSP2
- Today (2025)
- 27,593 people
- By 2030
- 28,026 · +1.6%
- By 2040
- 28,684 · +4.0%
- By 2050
- 28,970 · +5.0%
- By 2075
- 29,481 · +6.8%
- By 2100
- 27,841 · +0.9%
Race, ethnicity, and origin ACS 2023
- Neighborhood character
- Predominantly White (93%)
- Race & ethnicity
- White 93% Two or more races 4% Hispanic / Latino 3% Black 1%
- Common ancestry
- Slovak 3% Lithuanian 2% Serbian 2%
- Foreign-born
- 1% · Canada
- Languages at home
- 98% English-only · Spanish 2%
Political lean MEDSL · White
- 2024 margin
- Solid R (+66.6) · D 16.3% · R 82.9%
- 2008→2024 swing
- -38.3pp toward R · 2008: -28.3pp · 2024: -66.6pp
- All cycles
- 2024: R+66.6 2020: R+62.7 2016: R+59.5 2012: R+37.2 2008: R+28.3
Not yet ingested
- Civics
- —
Market trends
- HPI YoY
- ▼ -0.48%
- Current HPI
- 357.041
- Rent YoY
- —
- Metro
- —
- State GDP YoY
- ▲ 2.78%
- F500 in state
- 22
Industry mix (Fortune 500 HQ in TN)
| Industry | F500 HQs | Revenue |
|---|---|---|
| Healthcare | 3 | $91B |
|
||
| Retail | 3 | $72B |
|
||
| Transportation / Logistics | 1 | $88B |
|
||
| Paper / Packaging | 1 | $19B |
|
||
| Insurance | 1 | $13B |
|
||
| Energy | 1 | $12B |
|
||
Price history
+283.5% since first listed8 events — show timeline
- 2026-05-20 Contingent — UCMLS
- 2026-04-30 Listed $159,900 UCMLS
- 2025-08-01 Sold (Public Records) $100,000 Public Records
- 2023-08-31 Sold (Public Records) $90,000 Public Records
- 2023-08-31 Sold (MLS) $90,000 UCMLS
- 2023-08-03 Listed $125,000 UCMLS
- 2021-02-09 Sold (Public Records) $61,622 Public Records
- 2002-05-22 Sold (Public Records) $41,700 Public Records
Property tax history
+4.2%/yrLatest (2025): $368 · +72.8% YoY. Source: county tax records.
Cash-flow waterfall
monthlySold comps — $/sqft
last 12 mo · ≤1 miLoading sold comps…