 Duplex
1011 Macfarlane · Aberdeen, WA
Flood risk 4/10 · Minor
- FEMA flood zone
- X
- Chance of flooding over 30 yrs
- 0.24%
- Est. flood insurance / yr
- $507 – $1,088
Fire risk 1/10 · Minimal
- Est. fire insurance / yr
- $604 – $1,122
Heat risk 1/10 · Minimal
- Hot days now (above 78°F)
- 8 days/yr
- Hot days in 30 yrs
- 16 days/yr
Wind risk 1/10 · Minimal
- Chance of severe wind over 30 yrs
- —
Air-quality risk 6/10 · Moderate
- Unhealthy air days now
- 7 days/yr
- Unhealthy air days in 30 yrs
- 7 days/yr
Risk factors via First Street. Map © Google.
Why this score? — see what drove the C- grade
The composite is a weighted blend of 9 inputs, each scored 0–100. Each bar is that input's sub-score; the figure is the points it added to the 100-point composite (weight × sub-score).
- Cash flow +15.3/30.0
- ARV discount +15.0/15.0
- DSCR +4.7/10.0
- Livability +4.0/5.0
- Rent growth +3.6/5.0
- Schools +3.6/10.0
- 1% rule +3.5/10.0
- Condition / age +2.8/5.0
- Appreciation +0.0/10.0
$320,000
🖨 Deal sheet 📄 Offer letter ✓ Due diligence
Multi-family units
County records classify this as Multi-Family (2-4 Unit). Listing-text estimate: 2 units. confirmed
Listing remarks
Enjoy a stable tenancy with this nicw duplex in a great location. 2 bedroom 1 bath makes for a nice place to live. Close to the ocean. Units have been upgraded
Key facts
- Close to the ocean
- Great location
- Upgraded units
Tags
Property features AI
Finance
- Other: Listing terms: Cash, Conventional, See remarks
- Financial info: Total monthly income reported: $2,800; Gross scheduled income: $33,600; Gross adjusted income: $26,556; Net operating income: $26,556; Total expenses: $7,044; Electric expense: $84; Insurance expense: $800; Other expense: $585; Gross rent multiplier: 10.41; Vacancy rate: 10%; 3 total units in building; 2 units in building noted in another field
Exterior
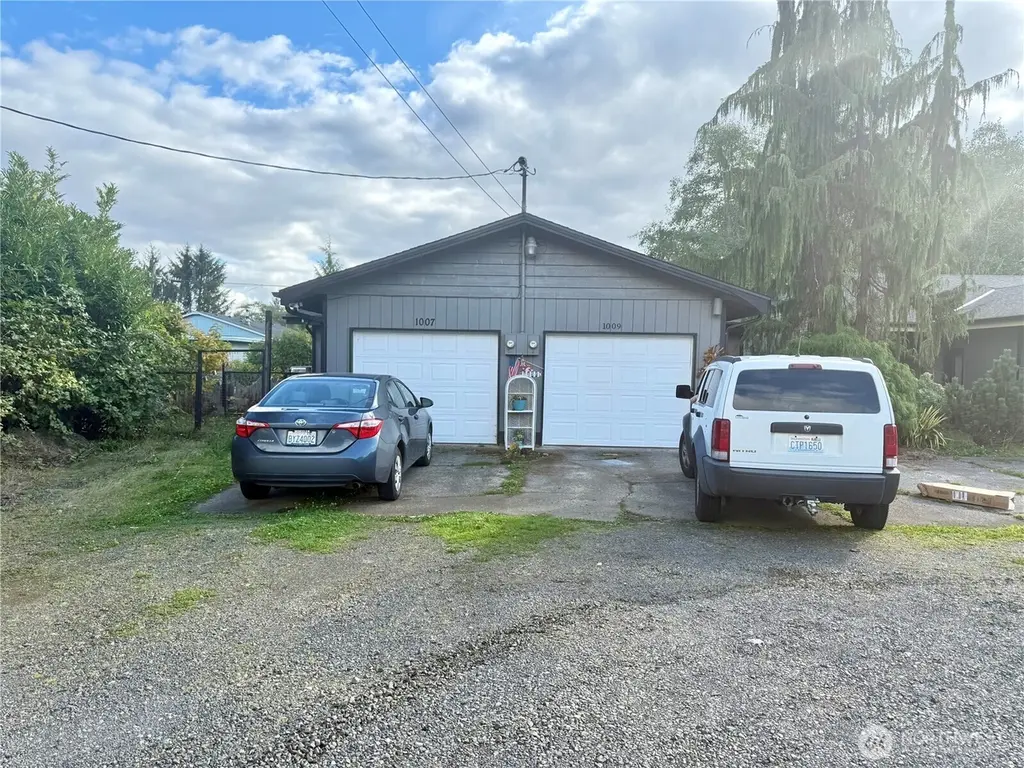
- Parking: 2 covered parking spaces; 2 garage spaces; 2 uncovered parking spaces; Approximately 576 sq ft garage
- Utilities: Electric service; Sewer connected
- Home design: Residential income duplex; Single-story structure
- Construction: Wood construction; Composition roof; Block foundation; Built on a duplex structure
- Exterior features: Wood exterior
Interior
- Kitchen: Unit 2011: Range/oven, Refrigerator, Dishwasher; Unit 2013: Range/oven, Refrigerator, Dishwasher
- Bedrooms: Unit 2011: 2 bedrooms; Unit 2013: 2 bedrooms
- Flooring: Laminate
- Bathrooms: Unit 2011: 1 bathroom; Unit 2013: 1 bathroom
- Heating & cooling: Baseboard heating; No central cooling
- Interior features: Laminate flooring; Baseboard heating
- Laundry & utility: No in-unit washer/dryer reported for units
Neighborhood map
What this means for you Summary
Snapshot
- This is a 2 × 2-bed/1.0-bath units multifamily listed at $320k. Condition is rated average.
Deal economics
- At list price, monthly cash flow is $116 ($1k/yr) — positive. Per door: $58/mo.
- The deal already cash-flows at list — no discount required.
- To meet the 1% rule (rent ≥ 1% of price), the offer needs to be $272k (15.0% below list).
- Recommended offer: $272k (15.0% below list) — sets the bar for 1% rule.
- Cap rate 6.7% vs local median 4.1% in Aberdeen — top-decile yield for the area; either an underpriced asset or a hidden risk that comps aren't pricing in. Stress-test before assuming the spread holds.
Location & tenants
- Location reads 81/100 on livability (#73 in WA, #1,320 nationally) — a professional / high-income tenant draw. Strengths: amenities A+, commute A+, cost of living A+; Watch: schools D+, crime D-, employment F.
- Aberdeen School District (town): math 35% / reading 45% proficiency, ranked #222 of 291 in WA (top 76%) — families likely to look elsewhere, expect single-tenant / working-renter base with shorter leases; 61% free/reduced lunch — lower-income household profile, screen leases tightly.
- Market conditions: Rents rising fast (+4.3%/yr); 257 active listings in the ZIP; 2 comparable units currently listed for rent nearby; 297 units permitted in Grays Harbor County in 2024 (17 in 5+ unit buildings).
- At $2,721/mo this rent would consume 56% of the median local household income ($58k/yr) (locally 635% of renters already pay >50% of income on rent) — very limited rent-growth headroom before tenants either downsize or default.
Forward outlook
- Local home prices are declining (-3.0%/yr); year-one equity from $2k of loan paydown is wiped out by about $10k of value loss. Plan a longer hold.
- Grays Harbor County population projected at -24% by 2050 — secular population decline; favor cash flow + early exit over multi-decade hold.
Negotiation context
- It's been on market 47 days — a 3% lower offer ($310k) is reasonable based on typical stale-listing flexibility.
- 3 sale attempts since 5y ago; this cycle's ask has dropped $30k (9%) from the opening price — seller is motivated, your offer sets the floor, not the list.
- Current owner paid $268k; 19% above their basis — modest negotiation headroom, anchor on the comps not their cost.
Questions for the listing agent
- It's been on market 47 days. Have you received any prior offers? Is the seller open to a 15% concession, seller financing, or rate buy-down credit?
- Can we see the unit-by-unit rent roll, current vacancy, and any below-market leases? What's the average tenancy length?
- What capital expenditures (roof, boiler, parking lot, exteriors) have been made in the last 5 years, and what's planned in the next 2?
- Built in 1976 — when were the roof, HVAC, electrical panel, plumbing, and water heater last replaced?
- Is there a deadline driving the sale (1031 exchange, divorce, estate, relocation)? That informs how much negotiation room exists.
- Schools are D-rated, which usually means shorter tenancies and higher turnover. Who's the typical renter profile here, and what's been the actual vacancy rate?
- Crime grade is D in this area — have there been break-ins, vandalism, or insurance claims at this property in the last 3 years? What carrier currently insures it and at what premium?
- What's the average days-on-market for RENTAL listings here right now (not sales)? A rising rental-DOM trend means longer vacancies and softer asking-rent achievability than the comps imply.
- What's the recent tenant-quality profile in this submarket — average credit score on applications, eviction rate, late-payment / NSF rate, and stable-employment percentage? A property-management company in the area should have these aggregated.
- How much new apartment / multifamily construction is in the pipeline within 1–3 miles? Heavy new supply (>2% of stock underway) typically softens rents 12–24 months out; light construction supports rent growth.
Investment metrics
- 1% rule
- 0.85% ✗
- Cap rate
- 6.73%
- Cash-on-cash
- 1.56%
- DSCR
- 1.07
- GRM
- 9.8
CMA / ARV
- ARV (median comp)
- $391,584
- List price
- $320,000
- Delta
- -18.28%
- Verdict
- UNDERPRICED
- Comps
- 2 within 1.0 mi
Show comp detail 3 sales within ~0.75 mi
| Address | Dist | Beds/Ba | Sqft | Sold | Price | $/sf | Match |
|---|---|---|---|---|---|---|---|
| 522 -524 W Cushing St | 0.41mi | 4/2.0 | 1,482 (-2%) | 10mo | $310,000 | $209 | 68 |
| 526 -528 W Cushing St | 0.40mi | 4/2.0 | 1,482 (-2%) | 11mo | $310,000 | $209 | 68 |
| 518 -520 W Cushing St | 0.42mi | 4/2.0 | 1,482 (-2%) | 10mo | $310,000 | $209 | 67 |
Match score weights: distance 35% · size 25% · config 20% · recency 20%. Top-matched comps best support the ARV.
Projected returns pro-forma
-3.0% appreciation · 4.35% rent growth · sell at horizon
- IRR
- -12.5%
- Equity multiple
- 0.54×
- Total profit
- $-40,779
- Equity at exit
- $47,713
- IRR
- -1.6%
- Equity multiple
- 0.88×
- Total profit
- $-10,462
- Equity at exit
- $27,668
Cash invested: $89,600 (down + closing). Projections, not guarantees.
Landlord ↔ Tenant lean methodology
- Overall (STATE)
- 28 Tenant-Leaning
- State Washington
- 28 Tenant-Leaning · D+8
- County
- — inherits STATE
- City
- — inherits STATE
ZIP-level market 98520
- Rents YoY
- 4.3%
- Active inventory
- 257
- Price-to-rent
- 19.6×
Monthly cashflow live
- Estimated rent
- $2,721 high interval (Pro) →
- Mortgage (P&I)
- −$1,678
- Tax from tax record
- −$222 /mo · $2,664/yr
- Insurance
- −$133
- HOA
- −$0
- Vacancy / Maint / Mgmt
- −$571
- Net cashflow
- $116
Break-even live
2-unit breakdown (identical units grouped — click to expand)
| Units | Beds | Baths | Est. rent |
|---|---|---|---|
| 2× units | 2 | 1 | $2,722 |
| #1 | 2 | 1 | $1,361 |
| #2 | 2 | 1 | $1,361 |
| Total (2 units) | $2,721 | ||
UW: 25.0% down · 7.5% · 30yr · 1.5% tax · 5.0% vac · 8.0% maint · 8.0% mgmt
Financing live
Cash to close
- Down payment
- $80,000
- Closing costs
- $9,600
- Reserves months
- —
- Total cash needed
- —
Loan-product check · same deal, 3 products live
Conventional
25% down · 7.5% · 30yr
- Down + closing
- —
- Monthly P&I
- —
- Monthly cashflow
- —
- DSCR
- —
- Eligible?
- —
Personal DTI + credit; lowest rate.
DSCR
20% down · 8.5% · 30yr
- Down + closing
- —
- Monthly P&I
- —
- Monthly cashflow
- —
- DSCR
- —
- Eligible?
- —
No personal income docs; deal must DSCR.
Hard money
10% down · 12.0% · 12mo
- Down + closing
- —
- Monthly P&I
- —
- Monthly cashflow
- —
- DSCR
- —
- Eligible?
- —
Short-term bridge; refi at stabilization.
Rent comps 2 comps
| Address | Beds | Baths | Sqft | Rent | $/sqft | DOM | Units | Dist |
|---|---|---|---|---|---|---|---|---|
| 908 E 1st St Aberdeen, WA | 3.0 | 1.0 | 1608 | $2,100 | $1.31 | 43d | 1 | 1.13mi |
| 912 Bell Dr Cosmopolis, WA | 3.0 | 2.0 | 1877 | $2,600 | $1.39 | 43d | 1 | 1.45mi |
Listing history 20 events
-
2026-06-19days on market $320,000 Active 47 DOM
-
2026-06-18days on market $320,000 Active 46 DOM
-
2026-06-17days on market $320,000 Active 45 DOM
-
2026-06-16days on market $320,000 Active 44 DOM
-
2026-06-15days on market $320,000 Active 43 DOM
-
2026-06-14days on market $320,000 Active 41 DOM
-
2026-06-12days on market $320,000 Active 40 DOM
-
2026-06-09days on market $320,000 Active 37 DOM
-
2026-06-08days on market $320,000 Active 36 DOM
-
2026-06-07days on market $320,000 Active 35 DOM
-
2026-06-03days on market $320,000 Active 31 DOM
-
2026-06-02days on market $320,000 Active 30 DOM
-
2026-06-01days on market $320,000 Active 29 DOM
-
2026-05-31days on market $320,000 Active 28 DOM
-
2026-05-30price $320,000 Active 27 DOM
-
2025-10-23$350,000 Active
-
2021-04-01soldstatus $268,000 Sold
-
2021-03-19status Pending
-
2021-02-28status Pending Inspection
-
2021-02-17$268,000 Active
ⓘ Source: listings_history table (triggers on properties + properties_extension) + one-shot
backfill from property_details.listing_events for pre-trigger history.
Tax reassessment forecast WA · Resets to sale price
- Current annual tax
- $2,664 · $222/mo
- Projected year-2 tax
- $3,136 · $261/mo
- Expected delta
- +$472/yr (+$39/mo · 17.7%)
ⓘ Screening estimate from a state-policy table — verify with the county assessor before closing.
Climate risk First Street
- Flood 4/10 Moderate FEMA zone X · 24% chance over 30 yrs
- Wildfire 1/10 Low
- Heat 1/10 Low 8 d/yr ≥78°F today · 16 d/yr by 30 yrs out
- Wind 1/10 Low
- Air quality 6/10 Major 7 unhealthy d/yr today · 7 by 30 yrs out
Nearby sold comps map
Loading sold comps map…
Walkable amenities ~0.75 mi
Loading nearby amenities…
Taxation est. · year 1
- Rental income
- $32,652
- − Mortgage interest
- −$17,925
- − Property taxes
- −$2,664
- − Insurance
- −$1,600
- − Repairs & maintenance
- −$2,612
- − Management
- −$2,612
- − Depreciation
- −$9,309
- Taxable loss
- −$4,070
- Est. tax savings @ 24.0%
- +$977
- After-tax cash flow
- $2,371/yr
For passive investors: Depreciation is non-cash, so a rental often shows a tax loss while cash-flowing — sheltering income. Rental losses are passive: they offset passive income freely, and up to $25,000/yr can offset ordinary (W-2) income if you actively participate and your MAGI is under $100k (phasing out to $0 by $150k); unused losses carry forward. On sale, claimed depreciation is recaptured at up to 25%, and gains may owe capital-gains tax (a 1031 exchange can defer both). Figures are a year-1 estimate at your 24.0% rate — not tax advice; consult a CPA.
Condition & rehab AI · 12 photos
A stable two-unit duplex with basic updates and some wear, offering good potential for cosmetic upgrades to increase value.
Repairs flagged
- Minor kitchen cabinets — basic cabinetry
- Minor bathroom fixtures — dated fixtures
- Minor exterior siding — some discoloration
Value-add opportunities
- Both update kitchen cabinets — modernizes kitchen and adds value
- Both update bathroom fixtures — modernizes bathroom and adds value
- Both paint interior walls — enhances interior appearance and adds value
Renovation cost estimate screening
| Repair item | Severity | Est. cost |
|---|---|---|
| kitchen cabinets · basic cabinetry | Minor | $500–3,000 |
| bathroom fixtures · dated fixtures | Minor | $500–3,000 |
| exterior siding · some discoloration | Minor | $500–3,000 |
| Total estimated repair cost · 3 items | $1,500–9,000 |
Value-add ROI direction
- Both update kitchen cabinets — modernizes kitchen and adds value ↑
- Both update bathroom fixtures — modernizes bathroom and adds value ↑
- Both paint interior walls — enhances interior appearance and adds value ↑
ⓘ Cost ranges are severity-bucket heuristics (US national rule-of-thumb). Get contractor quotes + a written scope before underwriting a rehab budget.
Schools (NCES district)
- District
- Aberdeen School District
- NCES district ID
- 5300030
- Math proficiency
- 35% ▼ -1.00%
- Reading proficiency
- 45% ▬ 0.00%
- Median HH income
- $41,896
- Composite
- 36.13/100
- National rank
- #9477
- State rank
- #222 of 291 in WA
Livability — Aberdeen
- Score
- 81/100
- State rank
- #73
- US rank
- #1320
Category grades
Schools grade is shown separately in the Schools card above.
Census & demographics
- Census place
- Aberdeen, WA
- County
- Grays Harbor County · 44,693 people
- City population
- 24,888
- Metro
- Aberdeen, WA
- Population (ZIP)
- 24,888
- Household income
- $58,153
- Rent vs Own
- Severe rent burden
- 635.0
Population outlook (Grays Harbor County) Hauer SSP2
- Today (2025)
- 66,443 people
- By 2030
- 63,255 · -4.8%
- By 2040
- 56,466 · -15.0%
- By 2050
- 50,516 · -24.0%
- By 2075
- 39,296 · -40.9%
- By 2100
- 31,142 · -53.1%
Race, ethnicity, and origin ACS 2023
- Neighborhood character
- Predominantly White (70%)
- Race & ethnicity
- White 70% Hispanic / Latino 16% Two or more races 9% Black 4% Native American 3% Asian 1% Pacific Islander 1%
- Hispanic origin (detail)
- Mexican 11%
- Common ancestry
- Portuguese 4% Italian 3% Lithuanian 2%
- Foreign-born
- 7% · Canada
- Languages at home
- 87% English-only · Spanish 10% Other Asian/Pacific 1% German/W. Germanic 1%
Political lean MEDSL · Grays Harbor
- 2024 margin
- Lean R (+6.0) · D 45.6% · R 51.6% · Other 2.8%
- 2008→2024 swing
- -20.6pp toward R · 2008: 14.6pp · 2024: -6.0pp
- All cycles
- 2024: R+6.0 2020: R+6.6 2016: R+7.1 2012: D+14.0 2008: D+14.6
Not yet ingested
- Civics
- —
Market trends
- HPI YoY
- ▼ -138.75%
- Current HPI
- 207.7393
- Rent YoY
- ▲ 4.35%
- Metro
- Aberdeen, WA
- State GDP YoY
- ▲ 4.65%
- F500 in state
- 22
Industry mix (Fortune 500 HQ in WA)
| Industry | F500 HQs | Revenue |
|---|---|---|
| Retail | 2 | $269B |
|
||
| Technology / Retail | 1 | $638B |
|
||
| Technology | 1 | $245B |
|
||
| Telecommunications | 1 | $38B |
|
||
| Food / Beverage | 1 | $36B |
|
||
| Automotive / Trucks | 1 | $34B |
|
||
Price history
+30.6% since first listed6 events — show timeline
- 2026-05-30 Relisted — NWMLS as Distributed by MLS Grid
- 2025-10-23 Listed $350,000 NWMLS as Distributed by MLS Grid
- 2021-04-01 Sold (MLS) $268,000 NWMLS as Distributed by MLS Grid
- 2021-03-19 Pending — NWMLS as Distributed by MLS Grid
- 2021-02-28 Pending — NWMLS as Distributed by MLS Grid
- 2021-02-17 Listed $268,000 NWMLS as Distributed by MLS Grid
Property tax history
+14.1%/yrLatest (2026): $2,664 · +6.1% YoY. Source: county tax records.
Cash-flow waterfall
monthlySold comps — $/sqft
last 12 mo · ≤1 miLoading sold comps…