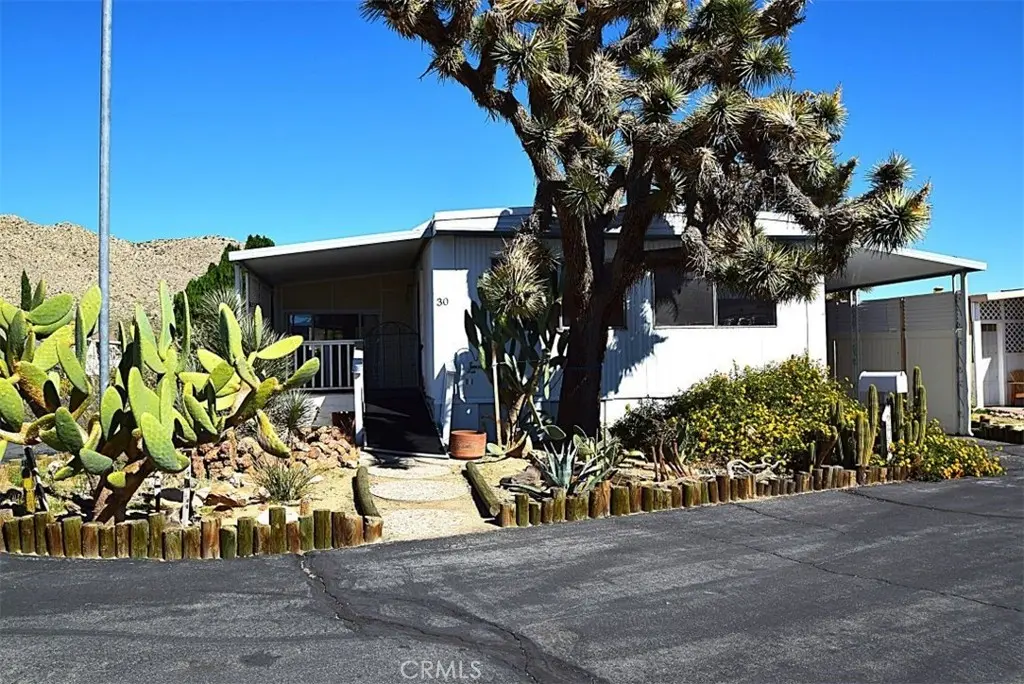
56254 29 Palms Hwy #30 · Yucca Valley, CA
Flood risk No data
- FEMA flood zone
- —
- Chance of flooding over 30 yrs
- —
- Est. flood insurance / yr
- —
Fire risk No data
- Est. fire insurance / yr
- —
Heat risk No data
- Hot days now (above threshold)
- —
- Hot days in 30 yrs
- —
Wind risk No data
- Chance of severe wind over 30 yrs
- —
Air-quality risk No data
- Unhealthy air days now
- —
- Unhealthy air days in 30 yrs
- —
Risk factors via First Street. Map © Google.
Why this score? — see what drove the C+ grade
The composite is a weighted blend of 9 inputs, each scored 0–100. Each bar is that input's sub-score; the figure is the points it added to the 100-point composite (weight × sub-score).
- Cash flow +30.0/30.0
- 1% rule +10.0/10.0
- DSCR +10.0/10.0
- Rent growth +3.5/5.0
- Livability +3.0/5.0
- ARV discount +2.8/15.0
- Condition / age +2.5/5.0
- Schools +2.2/10.0
- Appreciation +0.0/10.0
$52,500
🖨 Deal sheet 📄 Offer letter ✓ Due diligence
Listing remarks
Spacious 2-bedroom, 2-bath double wide located in the desirable Apache Mobile Home Park, a well-maintained gated senior community. This home offers a comfortable open layout, large living area, and plenty of natural light. Enjoy the peaceful setting and friendly neighborhood, complete with park amenities and easy access to shopping, dining, and medical services. Perfect for those seeking a quiet and affordable desert lifestyle!
Key facts
- Park amenities
- Community pool
- Built 1970
Tags
Property features AI
Finance
- Other: Living area source: Public records; Directions: From Hwy.62 take Church St. north to park entrance
- Financial info: Land lease: $415 monthly (land lease applies); Rent includes: None listed
- HOA & community: Located in a senior community; Park name: Apache Senior Park; Community is in a rural setting; Manager approval required for residency; Pets: contact manager
Exterior
- Parking: Covered parking; Parking available in park
- Utilities: Public/district water; Public sewer and soils analysis septic
- Home design: Single-story home; Mobile home model Lancer; Mobile home remains on site; Has a view
- Construction: Foundation: None reported; Mobile home, double body; Mobile dimensions approximately 10 ft by 53 ft
- Exterior features: Enclosed glass porch; Patio; Community pool; Paved lot
Interior
- Kitchen: Gas cooktop
- Bedrooms: All bedrooms are on the ground/main level
- Flooring: Laminate flooring
- Bathrooms: One full bathroom; One three-quarter bathroom
- Heating & cooling: Central furnace; Evaporative cooling
- Interior features: All bedrooms on the main level; Entry at level 1
- Laundry & utility: Interior laundry
Neighborhood map
What this means for you Summary
Snapshot
- This is a 2-bed/2.0-bath manufactured listed at $52k.
Deal economics
- At list price, monthly cash flow is $961 ($12k/yr) — positive.
- The deal already cash-flows at list — no discount required.
- Meets the 1% rule at list price ($2k rent vs $52k).
- Recommended offer: $51k (3.0% below list) — sets the bar for market timing.
- Cap rate 28.3% vs local median 3.6% in Yucca Valley — top-decile yield for the area; either an underpriced asset or a hidden risk that comps aren't pricing in. Stress-test before assuming the spread holds.
Location & tenants
- Location reads 60/100 on livability (#566 in CA) — a middle-class / working-renter tenant base. Strengths: commute A+, housing A+; Watch: cost of living D+, schools F, crime D-.
- Morongo Unified (town): math 15% / reading 38% proficiency, ranked #395 of 517 in CA (top 76%) — low school quality limits family demand, transient renter base, plan for 1-2y turnover.
- Market conditions: Rents rising fast (+4.1%/yr); 563 active listings in the ZIP; 16 comparable units currently listed for rent nearby; rentals at typical pace (median 18d on market — plan ~3-4 weeks tenant-placement turnaround); 44% of comp listings sitting > 30 days — soft ceiling on asking rent; 5,458 units permitted in San Bernardino County in 2024 (1,500 in 5+ unit buildings).
- This rent runs 34% of the median local income ($58k/yr) — at the standard rent-burdened threshold; future hikes will face affordability resistance.
Forward outlook
- Local home prices are declining (-3.0%/yr); year-one equity from $363 of loan paydown is wiped out by about $2k of value loss. Plan a longer hold.
- San Bernardino County population projected at +15% by 2050 — modest demand growth; plan on rents tracking national, not racing it.
- At projected returns (-3.0% appreciation + 4.1% rent growth), your $15k cash investment doubles in ~2 years — after that, you're playing with house money.
Negotiation context
- It's been on market 45 days — a 3% lower offer ($51k) is reasonable based on typical stale-listing flexibility.
- 5 sale attempts since 20y ago with the ask held roughly flat each time — persistent listings suggest the price (not the market) is what's stuck; bring a comps-based counter.
- Current owner paid $18k; list at $52k implies a 200% gain — meaningful room to come down on a strong offer.
Questions for the listing agent
- It's been on market 45 days. Have you received any prior offers? Is the seller open to a 3% concession, seller financing, or rate buy-down credit?
- Built in 1970 — when were the roof, HVAC, electrical panel, plumbing, and water heater last replaced?
- Is there a deadline driving the sale (1031 exchange, divorce, estate, relocation)? That informs how much negotiation room exists.
- Schools are F-rated, which usually means shorter tenancies and higher turnover. Who's the typical renter profile here, and what's been the actual vacancy rate?
- Crime grade is D in this area — have there been break-ins, vandalism, or insurance claims at this property in the last 3 years? What carrier currently insures it and at what premium?
- What's the average days-on-market for RENTAL listings here right now (not sales)? A rising rental-DOM trend means longer vacancies and softer asking-rent achievability than the comps imply.
- What's the recent tenant-quality profile in this submarket — average credit score on applications, eviction rate, late-payment / NSF rate, and stable-employment percentage? A property-management company in the area should have these aggregated.
- How much new for-sale + rental construction is in the pipeline within 1–3 miles? Heavy new supply typically softens prices + rents 12–24 months out; constrained supply supports both.
Investment metrics
- 1% rule
- 3.19% ✓
- Cap rate
- 28.26%
- Cash-on-cash
- 78.44%
- DSCR
- 4.49
- GRM
- 2.6
CMA / ARV
- ARV (median comp)
- $47,500
- List price
- $52,500
- Delta
- 10.53%
- Verdict
- OVERPRICED
- Comps
- 13 within 1.0 mi
Show comp detail 4 sales within ~0.75 mi
| Address | Dist | Beds/Ba | Sqft | Sold | Price | $/sf | Match |
|---|---|---|---|---|---|---|---|
| 56254 29 Palms Hwy #51 | 0.28mi | 2/2.0 | 1,040 (+4%) | 2mo | $60,000 | $58 | 79 |
| 56254 29 Palms Hwy #111 | 0.35mi | 2/1.0 | 1,040 (+4%) | 3mo | $38,000 | $37 | 71 |
| 7425 Church St #140 | 0.34mi | 2/2.0 | 1,056 (+6%) | 21mo | $36,500 | $35 | 58 |
| 7425 Church St #75 | 0.34mi | 2/2.0 | 1,080 (+8%) | 22mo | $36,500 | $34 | 53 |
Match score weights: distance 35% · size 25% · config 20% · recency 20%. Top-matched comps best support the ARV.
Projected returns pro-forma
-3.0% appreciation · 4.12% rent growth · sell at horizon
- IRR
- 79.8%
- Equity multiple
- 4.72×
- Total profit
- $54,627
- Equity at exit
- $7,828
- IRR
- 83.5%
- Equity multiple
- 10.15×
- Total profit
- $134,491
- Equity at exit
- $4,539
Cash invested: $14,700 (down + closing). Projections, not guarantees.
Landlord ↔ Tenant lean methodology
- Overall (STATE)
- 18 Strongly Tenant-Friendly
- State California
- 18 Strongly Tenant-Friendly · D+13
- County
- — inherits STATE
- City
- — inherits STATE
ZIP-level market 92284
- Home prices YoY
- -33.1%
- Rents YoY
- 4.1%
- Active inventory
- 563
- Price-to-rent
- 2.6×
Monthly cashflow live
- Estimated rent
- $1,676 high interval (Pro) →
- Mortgage (P&I)
- −$275
- Tax est. 1.5%
- −$66 /mo · $788/yr
- Insurance
- −$22
- HOA
- −$0
- Vacancy / Maint / Mgmt
- −$352
- Net cashflow
- $961
Break-even live
UW: 25.0% down · 7.5% · 30yr · 1.5% tax · 5.0% vac · 8.0% maint · 8.0% mgmt
Financing live
Cash to close
- Down payment
- $13,125
- Closing costs
- $1,575
- Reserves months
- —
- Total cash needed
- —
Loan-product check · same deal, 3 products live
Conventional
25% down · 7.5% · 30yr
- Down + closing
- —
- Monthly P&I
- —
- Monthly cashflow
- —
- DSCR
- —
- Eligible?
- —
Personal DTI + credit; lowest rate.
DSCR
20% down · 8.5% · 30yr
- Down + closing
- —
- Monthly P&I
- —
- Monthly cashflow
- —
- DSCR
- —
- Eligible?
- —
No personal income docs; deal must DSCR.
Hard money
10% down · 12.0% · 12mo
- Down + closing
- —
- Monthly P&I
- —
- Monthly cashflow
- —
- DSCR
- —
- Eligible?
- —
Short-term bridge; refi at stabilization.
Rent comps 16 comps
| Address | Beds | Baths | Sqft | Rent | $/sqft | DOM | Units | Dist |
|---|---|---|---|---|---|---|---|---|
| 7389 Cibola Trl Unit B Yucca Valley, CA | 2.0 | 1.0 | 750 | $1,100 | $1.47 | 14d | 1 | 0.16mi |
| 7496 Church St Yucca Valley, CA | 2.0 | 2.0 | 987 | $1,850 | $1.87 | 18d | 1 | 0.35mi |
| 7028 Cholla Ave Yucca Valley, CA | 3.0 | 2.0 | 1200 | $1,895 | $1.58 | 4d | 1 | 0.36mi |
| 6963 Tamarisk Ave Yucca Valley, CA | 3.0 | 2.0 | 1200 | $1,500 | $1.25 | 18d | 1 | 0.42mi |
| 7616 Apache Trl Yucca Valley, CA | 2.0 | 1.0 | 1008 | $1,900 | $1.88 | 43d | 1 | 0.57mi |
| 56565 Sunnyslope Dr Yucca Valley, CA | 3.0 | 2.0 | 1000 | $1,800 | $1.80 | 43d | 1 | 0.65mi |
| 6936 Grand Ave Yucca Valley, CA | 2.0 | 1.0 | 785 | $1,600 | $2.04 | 18d | 1 | 0.70mi |
| 7420 Geronimo Trl Yucca Valley, CA | 3.0 | 1.0 | 1280 | $1,700 | $1.33 | 43d | 1 | 0.80mi |
| 7154 Barberry Ave Unit A Yucca Valley, CA | 3.0 | 2.0 | 1100 | $2,049 | $1.86 | 18d | 1 | 0.91mi |
| 57004 Antelope Trl Yucca Valley, CA | 2.0 | 2.0 | 1143 | $2,050 | $1.79 | 43d | 1 | 0.97mi |
| 7330 Dumosa Ave Unit 7330 Yucca Valley, CA | 2.0 | 1.0 | 750 | $1,195 | $1.59 | 2d | 1 | 1.11mi |
| 56594 Joshua Dr Yucca Valley, CA | 3.0 | 2.0 | 1307 | $2,250 | $1.72 | 43d | 1 | 1.17mi |
| 7453 Dumosa Ave Yucca Valley, CA | 3.0 | 2.0 | 1394 | $2,200 | $1.58 | 43d | 1 | 1.18mi |
| 56769 Joshua Dr Yucca Valley, CA | 1.0 | 1.0 | 1000 | $1,000 | $1.00 | 10d | 1 | 1.31mi |
| 55220 Airlane Dr Unit 14A Yucca Valley, CA | 2.0 | 2.0 | 954 | $1,510 | $1.58 | 43d | 1 | 1.32mi |
| 56615 Bonanza Dr Yucca Valley, CA | 2.0 | 1.5 | 1342 | $1,900 | $1.42 | 16d | 1 | 1.36mi |
Listing history 27 events
-
2026-06-18days on market $52,500 Active 45 DOM
-
2026-06-17days on market $52,500 Active 44 DOM
-
2026-06-16days on market $52,500 Active 43 DOM
-
2026-06-15days on market $52,500 Active 42 DOM
-
2026-06-13days on market $52,500 Active 40 DOM
-
2026-06-13days on market $52,500 Active 39 DOM
-
2026-06-09days on market $52,500 Active 36 DOM
-
2026-06-08days on market $52,500 Active 35 DOM
-
2026-06-07days on market $52,500 Active 34 DOM
-
2026-06-04days on market $52,500 Active 31 DOM
-
2026-06-03days on market $52,500 Active 30 DOM
-
2026-06-02days on market $52,500 Active 29 DOM
-
2026-06-01days on market $52,500 Active 28 DOM
-
2026-05-31days on market $52,500 Active 27 DOM
-
2026-05-04$52,500 Active 431-char remark
-
2026-05-03historical
-
2026-03-12price $54,500
-
2025-11-03$59,500 Active
-
2015-04-30historical
-
2015-02-10$13,500 Active
-
2010-04-21historical
-
2010-04-21soldstatus $17,500 Closed
-
2010-03-25historical Contingent
-
2010-01-06price $18,500
-
2009-09-16$22,000 Active
-
2007-01-28historical
-
2006-10-23$53,500
ⓘ Source: listings_history table (triggers on properties + properties_extension) + one-shot
backfill from property_details.listing_events for pre-trigger history.
Nearby sold comps map
Loading sold comps map…
Walkable amenities ~0.75 mi
Loading nearby amenities…
Taxation est. · year 1
- Rental income
- $20,107
- − Mortgage interest
- −$2,941
- − Property taxes
- −$788
- − Insurance
- −$262
- − Repairs & maintenance
- −$1,609
- − Management
- −$1,609
- − Depreciation
- −$1,527
- Taxable income
- $11,372
- Est. tax owed @ 24.0%
- −$2,729
- After-tax cash flow
- $8,801/yr
For passive investors: Depreciation is non-cash, so a rental often shows a tax loss while cash-flowing — sheltering income. Rental losses are passive: they offset passive income freely, and up to $25,000/yr can offset ordinary (W-2) income if you actively participate and your MAGI is under $100k (phasing out to $0 by $150k); unused losses carry forward. On sale, claimed depreciation is recaptured at up to 25%, and gains may owe capital-gains tax (a 1031 exchange can defer both). Figures are a year-1 estimate at your 24.0% rate — not tax advice; consult a CPA.
Schools (NCES district)
- District
- Morongo Unified
- NCES district ID
- 0625860
- Math proficiency
- 15% ▼ -12.00%
- Reading proficiency
- 38% ▼ -3.00%
- Median HH income
- $39,399
- Composite
- 22.19/100
- National rank
- #8156
- State rank
- #395 of 517 in CA
Livability — Yucca Valley
- Score
- 60/100
- State rank
- #566
- US rank
- #18584
Category grades
Schools grade is shown separately in the Schools card above.
Census & demographics
- Census place
- Yucca Valley, CA
- County
- San Bernardino County · 2,030,291 people
- City population
- 25,415
- Metro
- Riverside-San Bernardino-Ontario, CA
- Population (ZIP)
- 25,415
- Household income
- $58,373
- Rent vs Own
- Severe rent burden
- 1132.0
Population outlook (San Bernardino County) Hauer SSP2
- Today (2025)
- 2,300,329 people
- By 2030
- 2,378,907 · +3.4%
- By 2040
- 2,523,137 · +9.7%
- By 2050
- 2,642,388 · +14.9%
- By 2075
- 2,880,769 · +25.2%
- By 2100
- 2,909,436 · +26.5%
Race, ethnicity, and origin ACS 2023
- Neighborhood character
- Diverse neighborhood (Simpson 0.55)
- Race & ethnicity
- White 62% Hispanic / Latino 25% Two or more races 18% Black 2% Native American 2% Asian 2% Pacific Islander 1%
- Hispanic origin (detail)
- Mexican 20%
- Common ancestry
- Italian 4% Romanian 2% Slovak 2%
- Foreign-born
- 9% · Canada
- Languages at home
- 82% English-only · Spanish 14% Other Indo-European 1% Other Asian/Pacific 1%
Political lean MEDSL · San Bernardino
- 2024 margin
- Toss-up / Even · D 47.5% · R 49.7% · Other 2.8%
- 2008→2024 swing
- -8.5pp toward R · 2008: 6.3pp · 2024: -2.1pp
- All cycles
- 2024: R+2.1 2020: D+10.7 2016: D+9.8 2012: D+5.4 2008: D+6.3
Not yet ingested
- Civics
- —
Market trends
- HPI YoY
- ▼ -241.13%
- Current HPI
- 486.7185
- Rent YoY
- ▲ 4.12%
- Metro
- Riverside-San Bernardino-Ontario, CA
- State GDP YoY
- ▲ 3.21%
- F500 in state
- 116
Industry mix (Fortune 500 HQ in CA)
| Industry | F500 HQs | Revenue |
|---|---|---|
| Technology | 27 | $1,492B |
|
||
| Financial Services | 3 | $174B |
|
||
| Retail | 3 | $44B |
|
||
| Insurance | 3 | $26B |
|
||
| Media / Entertainment | 2 | $115B |
|
||
| Pharmaceuticals / Biotech | 2 | $62B |
|
||
Price history
-1.9% since first listed13 events — show timeline
- 2026-05-04 Listed $52,500 CRMLS
- 2026-05-03 Listing Removed — CRMLS
- 2026-03-12 Price Changed $54,500 CRMLS
- 2025-11-03 Listed $59,500 CRMLS
- 2015-04-30 Listing Removed — CRMLS
- 2015-02-10 Listed $13,500 CRMLS
- 2010-04-21 Delisted — PALM
- 2010-04-21 Sold (MLS) $17,500 PALM
- 2010-03-25 Contingent — PALM
- 2010-01-06 Price Changed $18,500 PALM
- 2009-09-16 Listed $22,000 PALM
- 2007-01-28 Listing Removed — GPSMLS
- 2006-10-23 Listed $53,500 GPSMLS
Property tax history
-6.5%/yrLatest (2014): $50 · -1.4% YoY. Source: county tax records.
Cash-flow waterfall
monthlySold comps — $/sqft
last 12 mo · ≤1 miLoading sold comps…