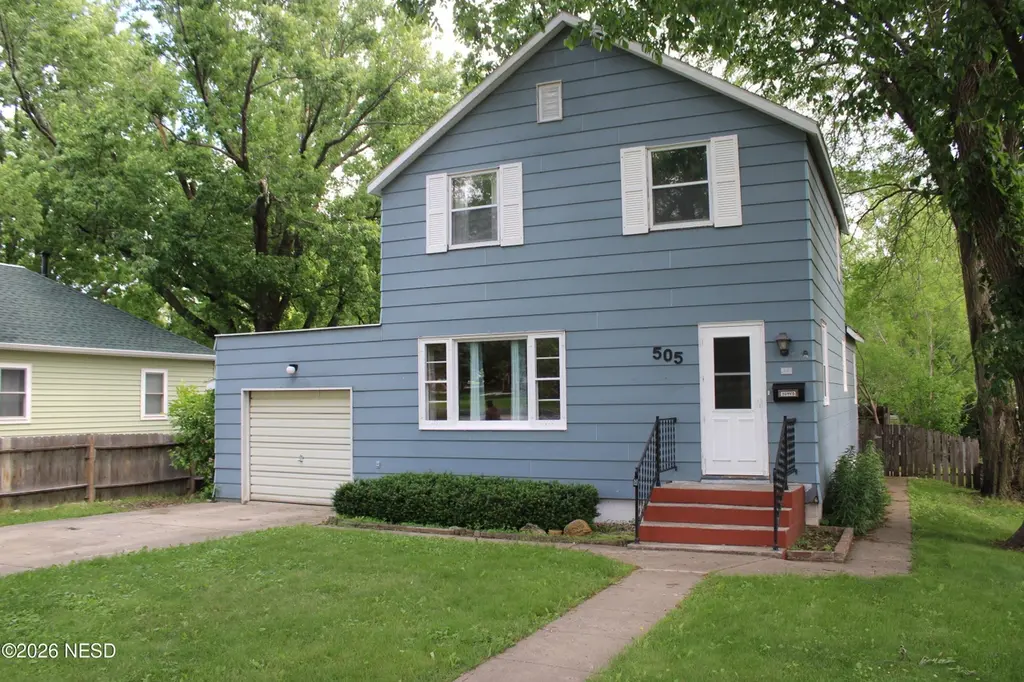
505 N Commercial St · Clark, SD
Flood risk 1/10 · Minimal
- FEMA flood zone
- X (unshaded)
- Chance of flooding over 30 yrs
- 0.0%
- Est. flood insurance / yr
- $473 – $860
Fire risk 3/10 · Minor
- Est. fire insurance / yr
- $1,342 – $2,492
Heat risk 2/10 · Minimal
- Hot days now (above 98°F)
- 7 days/yr
- Hot days in 30 yrs
- 13 days/yr
Wind risk 2/10 · Minimal
- Chance of severe wind over 30 yrs
- —
Air-quality risk 2/10 · Minimal
- Unhealthy air days now
- 1 days/yr
- Unhealthy air days in 30 yrs
- 1 days/yr
Risk factors via First Street. Map © Google.
Why this score? — see what drove the B- grade
The composite is a weighted blend of 9 inputs, each scored 0–100. Each bar is that input's sub-score; the figure is the points it added to the 100-point composite (weight × sub-score).
- Cash flow +30.0/30.0
- 1% rule +10.0/10.0
- DSCR +10.0/10.0
- Appreciation +6.2/10.0
- Livability +3.4/5.0
- Schools +3.3/10.0
- Rent growth +2.5/5.0
- Condition / age +2.5/5.0
- ARV discount +0.0/15.0
$130,000
🖨 Deal sheet 📄 Offer letter ✓ Due diligence
Key facts
- Spacious backyard
- Attached garage
- Full basement
Tags
Property features AI
Exterior
- Parking: Attached garage (1 car)
- Utilities: Sewer connected
- Home design: Residential single family home; Two levels
- Construction: Roof: Asphalt and wood
- Exterior features: Asphalt and wood roof
Interior
- Flooring: Linoleum
- Bathrooms: 1 full bathroom
- Interior features: Linoleum flooring; Full basement
Neighborhood map
What this means for you Summary
Snapshot
- This is a 3-bed/1.5-bath single-family listed at $130k.
Deal economics
- At list price, monthly cash flow is $1k ($16k/yr) — positive.
- The deal already cash-flows at list — no discount required.
- Meets the 1% rule at list price ($3k rent vs $130k).
Location & tenants
- Location reads 67/100 on livability (#109 in SD) — a middle-class / working-renter tenant base. Strengths: cost of living A+, housing A+, crime B; Watch: health & safety C-, amenities F, commute F.
- Clark School District 12-2 (rural): math 30% / reading 47% proficiency, ranked #53 of 59 in SD (top 90%) — families likely to look elsewhere, expect single-tenant / working-renter base with shorter leases.
- Zoned schools: Clark Elementary - 02 (math 44% / reading 54%, grade D, #115 of 253 statewide, top 52%, 201 students, 29% FRL); Clark High School - 01 (math 50% / reading 70%, grade C+, #31 of 151 statewide, top 32%, 102 students, 21% FRL) — zoned schools average 25% FRL vs 44% district-wide (19 pts lower); this property's tenant base skews higher-income than the district average.
- Zoned-school proficiency averages 54% at this address vs 38% district-wide (+16 pts) — the actual schools serving this property are materially stronger than the Clark School District 12-2 average implies; a family-tenant draw the district grade alone would hide.
- Market conditions: 7 active listings in the ZIP; 9 units permitted in Clark County in 2024 (0 in 5+ unit buildings).
Forward outlook
- In year one you build about $4k of equity ($899 loan paydown + $3k appreciation (2.5% local appreciation)).
- At projected returns (2.5% appreciation + 3.0% rent growth), your $36k cash investment doubles in ~2 years — after that, you're playing with house money.
- By year 8, paydown + projected appreciation supports a ~$31k cash-out refi (75% LTV) — recoverable capital for the next deal without selling this one.
Negotiation context
- Only 7 days on market — expect competitive offers; lowballing is unlikely to land.
Risks & watch-outs
- Watch-outs: built in 1900 — expect roof / HVAC / electrical / plumbing capex.
Questions for the listing agent
- Built in 1900 — when were the roof, HVAC, electrical panel, plumbing, and water heater last replaced?
- Is there a deadline driving the sale (1031 exchange, divorce, estate, relocation)? That informs how much negotiation room exists.
- What's the average days-on-market for RENTAL listings here right now (not sales)? A rising rental-DOM trend means longer vacancies and softer asking-rent achievability than the comps imply.
- What's the recent tenant-quality profile in this submarket — average credit score on applications, eviction rate, late-payment / NSF rate, and stable-employment percentage? A property-management company in the area should have these aggregated.
- How much new for-sale + rental construction is in the pipeline within 1–3 miles? Heavy new supply typically softens prices + rents 12–24 months out; constrained supply supports both.
Investment metrics
- 1% rule
- 2.14% ✓
- Cap rate
- 18.26%
- Cash-on-cash
- 42.73%
- DSCR
- 2.90
- GRM
- 3.9
CMA / ARV
- ARV (on-the-fly)
- $101,384
- Comps found
- 3
Show comp detail 3 sales within ~0.75 mi
| Address | Dist | Beds/Ba | Sqft | Sold | Price | $/sf | Match |
|---|---|---|---|---|---|---|---|
| 208 NE 4th Ave | 0.10mi | 3/1.0 | 1,140 (-14%) | 10mo | $87,000 | $76 | 61 |
| 304 N Dakota St | 0.26mi | 2/2.0 (-1) | 1,420 (+6%) | 20mo | $172,000 | $121 | 53 |
| 203 5th Ave SE | 0.70mi | 3/1.0 | 1,408 (+6%) | 23mo | $92,000 | $65 | 37 |
Match score weights: distance 35% · size 25% · config 20% · recency 20%. Top-matched comps best support the ARV.
Projected returns pro-forma
2.48% appreciation · 3.0% rent growth · sell at horizon
- IRR
- 47.4%
- Equity multiple
- 3.60×
- Total profit
- $94,728
- Equity at exit
- $54,708
- IRR
- 47.6%
- Equity multiple
- 7.21×
- Total profit
- $226,087
- Equity at exit
- $81,508
Cash invested: $36,400 (down + closing). Projections, not guarantees.
Landlord ↔ Tenant lean methodology
- Overall (STATE)
- 83 Strongly Landlord-Friendly
- State South Dakota
- 83 Strongly Landlord-Friendly · R+16
- County
- — inherits STATE
- City
- — inherits STATE
ZIP-level market 57225
- Home prices YoY
- 1.6%
- Active inventory
- 7
- Price-to-rent
- 3.9×
Monthly cashflow live
- Estimated rent
- $2,778 medium interval (Pro) →
- Mortgage (P&I)
- −$682
- Tax est. 1.5%
- −$162 /mo · $1,950/yr
- Insurance
- −$54
- HOA
- −$0
- Vacancy / Maint / Mgmt
- −$583
- Net cashflow
- $1,296
Break-even live
UW: 25.0% down · 7.5% · 30yr · 1.5% tax · 5.0% vac · 8.0% maint · 8.0% mgmt
Financing live
Cash to close
- Down payment
- $32,500
- Closing costs
- $3,900
- Reserves months
- —
- Total cash needed
- —
Loan-product check · same deal, 3 products live
Conventional
25% down · 7.5% · 30yr
- Down + closing
- —
- Monthly P&I
- —
- Monthly cashflow
- —
- DSCR
- —
- Eligible?
- —
Personal DTI + credit; lowest rate.
DSCR
20% down · 8.5% · 30yr
- Down + closing
- —
- Monthly P&I
- —
- Monthly cashflow
- —
- DSCR
- —
- Eligible?
- —
No personal income docs; deal must DSCR.
Hard money
10% down · 12.0% · 12mo
- Down + closing
- —
- Monthly P&I
- —
- Monthly cashflow
- —
- DSCR
- —
- Eligible?
- —
Short-term bridge; refi at stabilization.
Listing history 6 events
-
2026-06-18days on market $130,000 Active 7 DOM
-
2026-06-17days on market $130,000 Active 6 DOM
-
2026-06-16days on market $130,000 Active 5 DOM
-
2026-06-15days on market $130,000 Active 4 DOM
-
2026-06-13days on market $130,000 Active 2 DOM
-
2026-06-12$130,000 Active 1 DOM
ⓘ Source: listings_history table (triggers on properties + properties_extension) + one-shot
backfill from property_details.listing_events for pre-trigger history.
Climate risk First Street
- Flood 1/10 Low FEMA zone X (unshaded) · 0% chance over 30 yrs
- Wildfire 3/10 Moderate
- Heat 2/10 Low 7 d/yr ≥98°F today · 13 d/yr by 30 yrs out
- Wind 2/10 Low
- Air quality 2/10 Low 1 unhealthy d/yr today · 1 by 30 yrs out
Nearby sold comps map
Loading sold comps map…
Walkable amenities ~0.75 mi
Loading nearby amenities…
Taxation est. · year 1
- Rental income
- $33,333
- − Mortgage interest
- −$7,282
- − Property taxes
- −$1,950
- − Insurance
- −$650
- − Repairs & maintenance
- −$2,667
- − Management
- −$2,667
- − Depreciation
- −$3,782
- Taxable income
- $14,336
- Est. tax owed @ 24.0%
- −$3,441
- After-tax cash flow
- $12,112/yr
For passive investors: Depreciation is non-cash, so a rental often shows a tax loss while cash-flowing — sheltering income. Rental losses are passive: they offset passive income freely, and up to $25,000/yr can offset ordinary (W-2) income if you actively participate and your MAGI is under $100k (phasing out to $0 by $150k); unused losses carry forward. On sale, claimed depreciation is recaptured at up to 25%, and gains may owe capital-gains tax (a 1031 exchange can defer both). Figures are a year-1 estimate at your 24.0% rate — not tax advice; consult a CPA.
Schools (NCES district)
- District
- Clark School District 12-2
- NCES district ID
- 4612940
- Math proficiency
- 30% ▬ 0.00%
- Reading proficiency
- 47% ▲ 8.00%
- Median HH income
- $46,158
- Composite
- 32.82/100
- National rank
- #5621
- State rank
- #53 of 59 in SD
Livability — Clark
- Score
- 67/100
- State rank
- #109
- US rank
- #11194
Category grades
Schools grade is shown separately in the Schools card above.
Census & demographics
- Census place
- Clark, SD
- City population
- 1,760
- Population (ZIP)
- 1,760
Population outlook (Clark County) Hauer SSP2
- Today (2025)
- 3,553 people
- By 2030
- 3,490 · -1.8%
- By 2040
- 3,465 · -2.5%
- By 2050
- 3,532 · -0.6%
- By 2075
- 4,154 · +16.9%
- By 2100
- 5,073 · +42.8%
Race, ethnicity, and origin ACS 2023
- Neighborhood character
- Predominantly White (91%)
- Race & ethnicity
- White 91% Two or more races 7% Hispanic / Latino 7% Native American 1%
- Hispanic origin (detail)
- Mexican 5%
- Common ancestry
- Portuguese 19% Romanian 2% Lithuanian 2%
- Foreign-born
- 2% · Canada
- Languages at home
- 97% English-only · Spanish 3%
Political lean MEDSL · Clark
- 2024 margin
- Solid R (+52.5) · D 22.5% · R 75.0% · Other 2.4%
- 2008→2024 swing
- -40.4pp toward R · 2008: -12.1pp · 2024: -52.5pp
- All cycles
- 2024: R+52.5 2020: R+50.6 2016: R+44.7 2012: R+19.4 2008: R+12.1
Not yet ingested
- Civics
- —
Market trends
- HPI YoY
- ▲ 2.48%
- Current HPI
- 152.8578
- Rent YoY
- —
- Metro
- —
- State GDP YoY
- ▲ 0.70%
- F500 in state
- 2
Industry mix (Fortune 500 HQ in SD)
| Industry | F500 HQs | Revenue |
|---|---|---|
| Utilities | 1 | $1B |
|
||
Price history
1 event — show timeline
- 2026-06-11 Listed $130,000 NESD
Cash-flow waterfall
monthlySold comps — $/sqft
last 12 mo · ≤1 miLoading sold comps…