90 Westwood Dr · Lake, PA
Flood risk 1/10 · Minimal
- FEMA flood zone
- X (unshaded)
- Chance of flooding over 30 yrs
- 0.0%
- Est. flood insurance / yr
- $473 – $860
Fire risk 1/10 · Minimal
- Est. fire insurance / yr
- $511 – $949
Heat risk 2/10 · Minimal
- Hot days now (above 91°F)
- 7 days/yr
- Hot days in 30 yrs
- 16 days/yr
Wind risk 2/10 · Minimal
- Chance of severe wind over 30 yrs
- 3.0%
Air-quality risk 2/10 · Minimal
- Unhealthy air days now
- 1 days/yr
- Unhealthy air days in 30 yrs
- 2 days/yr
Risk factors via First Street. Map © Google.
Why this score? — see what drove the D grade
The composite is a weighted blend of 9 inputs, each scored 0–100. Each bar is that input's sub-score; the figure is the points it added to the 100-point composite (weight × sub-score).
- ARV discount +13.2/15.0
- Appreciation +10.0/10.0
- Cash flow +6.1/30.0
- Schools +4.4/10.0
- Rent growth +2.5/5.0
- Livability +2.5/5.0
- Condition / age +2.5/5.0
- 1% rule +1.6/10.0
- DSCR +0.5/10.0
$349,900
🖨 Deal sheet (PDF) 📄 Offer letter ✓ Due diligence
Listing remarks
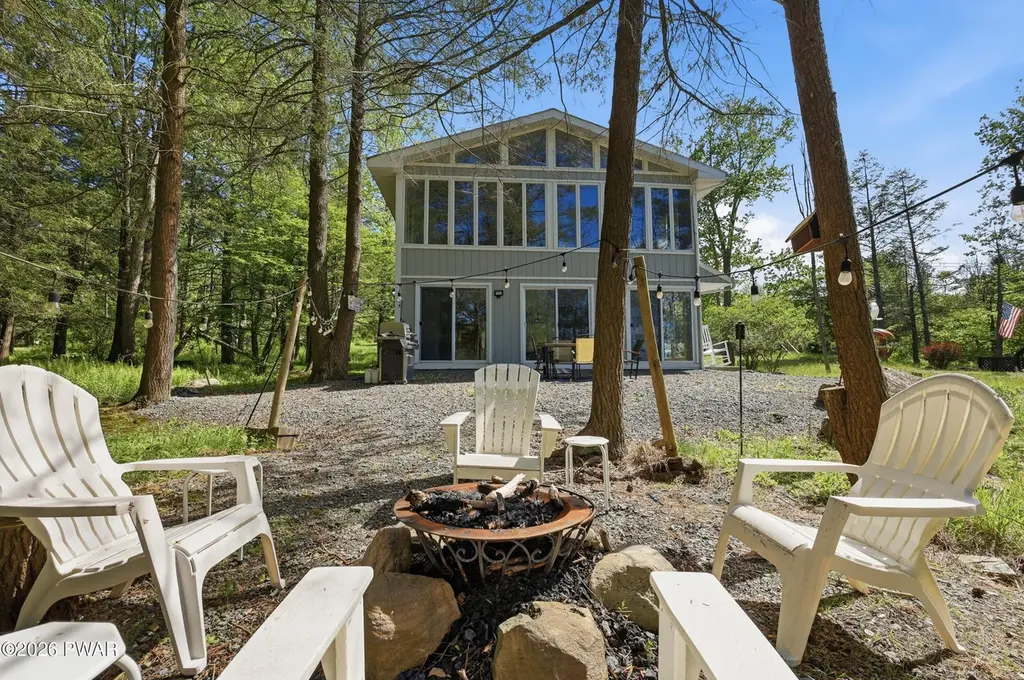
Located within walking distance to The Hideout's ski hill, this fully furnished, turn-key 4-bedroom Pocono retreat is ready for you to enjoy from day one. Recently painted inside and out, the home offers a fresh, inviting feel with spacious rooms and great natural light throughout. The large kitchen is a true gathering space, featuring a spacious island with a prep sink, wine fridge, and plenty of room for cooking, entertaining, and everyday living. Just off the kitchen, the generous dining room is perfect for family meals, holidays, or hosting guests. The living room features oversized windows that fill the space with natural light, creating a warm and comfortable place to relax. Outside,
Key facts
- Gravel fire pit area
- 0.34 acre lot
- 2 garage spots
Tags
Property features AI
Finance
- Other: Located in a community with beach rights and beach access
- HOA & community: Homeowners association with amenities including clubhouse, pool, tennis and sport courts, fitness center, playground, park, marina/boat access, golf, fishing, recreation facilities, game rooms, picnic area, maintenance and security; Annual association fee and additional one-time fee (association fee details available)
Exterior
- Parking: Driveway; 2-car garage
- Security: 24-hour security with guard; Gated with guard; Closed-circuit cameras
- Utilities: 200+ amp electric service; Electricity connected; Public sewer; Water connected
- Home design: Single-family house; Two levels; Private road frontage; Located in The Hideout subdivision; Gated community
- Construction: Block foundation; Shingle roof; Block basement (full, finished, walk-out, exterior entry)
- Exterior features: Barbecue and outdoor grill (gas grill); Fire pit; Rain gutters; View of Roamingwood Lake; Few trees, level lot; Paved private road with private maintenance
Interior
- Kitchen: Stainless steel appliances; Built-in gas oven; Oven; Microwave; Refrigerator; Dishwasher; Bar fridge; Granite and laminate counters; Kitchen island; Eat-in kitchen; Pantry
- Bedrooms: Total rooms: 9
- Flooring: Carpet; Hardwood; Ceramic tile
- Bathrooms: 2 full bathrooms; 1 half bathroom
- Heating & cooling: Electric heating; Pellet stove (fireplace); Ceiling fans; Window air conditioning units
- Interior features: Entrance foyer; Ceiling fans; Recessed lighting; Pantry; Laminate counters; Kitchen island; High speed internet; High ceilings; Granite counters; Eat-in kitchen; Chandelier; Window coverings, blinds and shutters; Finished walk-out basement with exterior entry
- Laundry & utility: Washer and dryer (stacked); Laundry room; Laundry in bathroom; Electric water heater; Water heater
Neighborhood map
What this means for you Summary
Snapshot
- This is a 4-bed/2.5-bath single-family listed at $350k.
Deal economics
- At list price, monthly cash flow is $-649 ($-8k/yr) — negative.
- To cash-flow at today's rent, offer at most $235k (32.8% below list).
- To meet the 1% rule (rent ≥ 1% of price), the offer needs to be $232k (33.7% below list).
- Recommended offer: $232k (33.7% below list) — sets the bar for 1% rule.
Location & tenants
- Location reads: area grade D — affects rentability + tenant quality, not the cash-flow math above.
- Western Wayne SD (rural): math 39% / reading 63% proficiency, ranked #165 of 539 in PA (top 31%) — acceptable for families but not a draw, mixed tenant base, ~2y average lease.
- Zoned schools: Evergreen El Sch (math 42% / reading 68%, grade C, #498 of 1,518 statewide, top 33%, 506 students, 64% FRL); Western Wayne Ms (math 21% / reading 61%, grade F, #243 of 512 statewide, top 48%, 411 students, 57% FRL); Western Wayne Hs (math 77% / reading 24%, grade D+, #125 of 437 statewide, top 30%, 545 students, 49% FRL) — zoned schools average 56% FRL vs 41% district-wide (16 pts higher); higher-poverty schools than district average — tighter screening recommended.
- Market conditions: 341 active listings in the ZIP; 177 units permitted in Wayne County in 2024 (0 in 5+ unit buildings).
Forward outlook
- In year one you build about $37k of equity ($2k loan paydown + $35k appreciation (10.0% local appreciation)).
- Wayne County population projected at -17% by 2050 — secular population decline; favor cash flow + early exit over multi-decade hold.
- By year 2, paydown + projected appreciation supports a ~$60k cash-out refi (75% LTV) — recoverable capital for the next deal without selling this one.
Negotiation context
- It's been on market 24 days — a 2% lower offer ($345k) is reasonable based on typical stale-listing flexibility.
- Current owner paid $257k; 36% above their basis — modest negotiation headroom, anchor on the comps not their cost.
Questions for the listing agent
- What do current leases actually rent for vs. the listed asking? Can we see a recent rent roll and the last 12 months of T-12 income?
- What does the HOA fee cover, when was the last increase, and are there any pending special assessments or reserve-fund shortfalls?
- Is there a deadline driving the sale (1031 exchange, divorce, estate, relocation)? That informs how much negotiation room exists.
- The area grade is low — what's the realistic commute time and amenity access for the typical tenant pool here? Any planned neighborhood developments (good or bad) we should know about?
- What's the average days-on-market for RENTAL listings here right now (not sales)? A rising rental-DOM trend means longer vacancies and softer asking-rent achievability than the comps imply.
- What's the recent tenant-quality profile in this submarket — average credit score on applications, eviction rate, late-payment / NSF rate, and stable-employment percentage? A property-management company in the area should have these aggregated.
- How much new for-sale + rental construction is in the pipeline within 1–3 miles? Heavy new supply typically softens prices + rents 12–24 months out; constrained supply supports both.
Investment metrics
- 1% rule
- 0.66% ✗
- Cap rate
- 4.07%
- Cash-on-cash
- -7.95%
- DSCR
- 0.65
- GRM
- 12.6
CMA / ARV
- ARV (on-the-fly)
- $400,140
- Comps found
- 12
Show comp detail 12 sales within ~0.75 mi
| Address | Dist | Beds/Ba | Sqft | Sold | Price | $/sf | Match |
|---|---|---|---|---|---|---|---|
| 58 Forest Ln | 0.17mi | 5/3.0 (+1) | 2,608 (+6%) | 8mo | $390,000 | $150 | 69 |
| 10 Crestwood Ct | 0.57mi | 4/3.0 | 2,474 (+0%) | 2mo | $355,000 | $143 | 69 |
| 171 Ridgeview Dr | 0.39mi | 4/2.5 | 2,314 (-6%) | 4mo | $370,000 | $160 | 68 |
| 703 Woodridge Dr Lot 87 | 0.42mi | 4/3.5 | 2,400 (-3%) | 5mo | $510,000 | $213 | 68 |
| 357 Lakeview Dr W | 0.40mi | 4/3.0 | 2,297 (-7%) | 3mo | $373,000 | $162 | 65 |
| 59 Woodhill Ln | 0.37mi | 3/3.0 (-1) | 2,421 (-2%) | 8mo | $475,000 | $196 | 65 |
| 8 Brentwood Ct Lot 1019 | 0.21mi | 3/2.5 (-1) | 2,261 (-8%) | 8mo | $352,000 | $156 | 64 |
| 1244 Woodhill Ln | 0.37mi | 3/2.5 (-1) | 2,290 (-7%) | 6mo | $405,000 | $177 | 60 |
| 1228 Lakeview Dr W | 0.42mi | 4/3.0 | 2,298 (-7%) | 8mo | $335,000 | $146 | 60 |
| 30 Tanglewood Ln | 0.48mi | 5/3.0 (+1) | 2,700 (+9%) | 1mo | $445,000 | $165 | 54 |
| 7 Woodpoint Ct | 0.69mi | 5/2.0 (+1) | 2,584 (+5%) | 1mo | $1,175,000 | $455 | 52 |
| 28 Woodcrest Ln Ln | 0.50mi | 5/3.0 (+1) | 2,200 (-11%) | 2mo | $335,000 | $152 | 50 |
Match score weights: distance 35% · size 25% · config 20% · recency 20%. Top-matched comps best support the ARV.
Projected returns pro-forma
10.0% appreciation · 3.0% rent growth · sell at horizon
- IRR
- 18.7%
- Equity multiple
- 2.52×
- Total profit
- $149,317
- Equity at exit
- $315,218
- IRR
- 17.3%
- Equity multiple
- 5.82×
- Total profit
- $472,355
- Equity at exit
- $679,779
Cash invested: $97,972 (down + closing). Projections, not guarantees.
Landlord ↔ Tenant lean methodology
- Overall (STATE)
- 62 Landlord-Friendly
- State Pennsylvania
- 62 Landlord-Friendly · EVEN
- County
- — inherits STATE
- City
- — inherits STATE
ZIP-level market 18436
- Home prices YoY
- 16.9%
- Active inventory
- 341
- Price-to-rent
- 12.6×
Monthly cashflow live
- Estimated rent
- $2,319 medium interval (Pro) →
- Mortgage (P&I)
- −$1,835
- Tax from tax record
- −$306 /mo · $3,677/yr
- Insurance
- −$146
- HOA
- −$194
- Vacancy / Maint / Mgmt
- −$487
- Net cashflow
- $-649
Break-even live
Sensitivity live
| Price | -10% $-451 | -5% $-550 | +0% $-649 | +5% $-748 | +10% $-847 |
|---|---|---|---|---|---|
| Rent | -10% $-832 | -5% $-740 | +0% $-649 | +5% $-557 | +10% $-466 |
| Rate | -1.0pp $-473 | -0.5pp $-560 | base $-649 | +0.5pp $-739 | +1.0pp $-832 |
UW: 25.0% down · 7.5% · 30yr · 1.5% tax · 5.0% vac · 8.0% maint · 8.0% mgmt
Financing live
Cash to close
- Down payment
- $87,475
- Closing costs
- $10,497
- Reserves months
- —
- Total cash needed
- —
Loan-product check · same deal, 3 products live
Conventional
25% down · 7.5% · 30yr
- Down + closing
- —
- Monthly P&I
- —
- Monthly cashflow
- —
- DSCR
- —
- Eligible?
- —
Personal DTI + credit; lowest rate.
DSCR
20% down · 8.5% · 30yr
- Down + closing
- —
- Monthly P&I
- —
- Monthly cashflow
- —
- DSCR
- —
- Eligible?
- —
No personal income docs; deal must DSCR.
Hard money
10% down · 12.0% · 12mo
- Down + closing
- —
- Monthly P&I
- —
- Monthly cashflow
- —
- DSCR
- —
- Eligible?
- —
Short-term bridge; refi at stabilization.
HOA detail
- Monthly dues
- $194 · $2,328/yr
Listing history 20 events
-
2026-06-21days on market $349,900 Active 24 DOM
-
2026-06-18days on market $349,900 Active 21 DOM
-
2026-06-17days on market $349,900 Active 20 DOM
-
2026-06-16days on market $349,900 Active 19 DOM
-
2026-06-15days on market $349,900 Active 18 DOM
-
2026-06-14days on market $349,900 Active 16 DOM
-
2026-06-13days on market $349,900 Active 15 DOM
-
2026-06-10days on market $349,900 Active 13 DOM
-
2026-06-09days on market $349,900 Active 12 DOM
-
2026-06-08days on market $349,900 Active 11 DOM
-
2026-06-07days on market $349,900 Active 10 DOM
-
2026-06-03days on market $349,900 Active 6 DOM
-
2026-06-02days on market $349,900 Active 5 DOM
-
2026-06-01days on market $349,900 Active 4 DOM
-
2026-05-31days on market $349,900 Active 3 DOM
-
2026-05-30days on market $349,900 Active 2 DOM
-
2026-05-28$349,900 Active
-
2021-04-14soldstatus $257,397
-
2008-07-03soldstatus $155,000
-
2007-09-27soldstatus $40,000
ⓘ Source: listings_history table (triggers on properties + properties_extension) + one-shot
backfill from property_details.listing_events for pre-trigger history.
Tax reassessment forecast PA · Partial reset (capped growth)
- Current annual tax
- $3,677 · $306/mo
- Projected year-2 tax
- $4,603 · $384/mo
- Expected delta
- +$926/yr (+$77/mo · 25.2%)
ⓘ Screening estimate from a state-policy table — verify with the county assessor before closing.
Climate risk First Street
- Flood 1/10 Low FEMA zone X (unshaded) · 0% chance over 30 yrs
- Wildfire 1/10 Low
- Heat 2/10 Low 7 d/yr ≥91°F today · 16 d/yr by 30 yrs out
- Wind 2/10 Low 3% chance of damaging wind over 30 yrs
- Air quality 2/10 Low 1 unhealthy d/yr today · 2 by 30 yrs out
Nearby sold comps map
Loading sold comps map…
Walkable amenities ~0.75 mi
Loading nearby amenities…
Taxation est. · year 1
- Rental income
- $27,833
- − Mortgage interest
- −$19,600
- − Property taxes
- −$3,677
- − Insurance
- −$1,750
- − Repairs & maintenance
- −$2,227
- − Management
- −$2,227
- − HOA
- −$2,328
- − Depreciation
- −$10,179
- Taxable loss
- −$14,154
- Est. tax savings @ 24.0%
- +$3,397
- After-tax cash flow
- $-4,389/yr
For passive investors: Depreciation is non-cash, so a rental often shows a tax loss while cash-flowing — sheltering income. Rental losses are passive: they offset passive income freely, and up to $25,000/yr can offset ordinary (W-2) income if you actively participate and your MAGI is under $100k (phasing out to $0 by $150k); unused losses carry forward. On sale, claimed depreciation is recaptured at up to 25%, and gains may owe capital-gains tax (a 1031 exchange can defer both). Figures are a year-1 estimate at your 24.0% rate — not tax advice; consult a CPA.
Schools (NCES district)
- District
- Western Wayne SD
- NCES district ID
- 4226070
- Math proficiency
- 39% ▼ -12.00%
- Reading proficiency
- 63% ▼ -6.00%
- Median HH income
- $51,358
- Composite
- 43.65/100
- National rank
- #2964
- State rank
- #165 of 539 in PA
Livability — Lake
No livability data for this city. (Only ~50 U.S. cities are tracked.)
Census & demographics
- Census place
- The Hideout, PA
- Population (ZIP)
- 13,225
Population outlook (Wayne County) Hauer SSP2
- Today (2025)
- 47,924 people
- By 2030
- 46,191 · -3.6%
- By 2040
- 42,815 · -10.7%
- By 2050
- 39,873 · -16.8%
- By 2075
- 34,556 · -27.9%
- By 2100
- 28,358 · -40.8%
Race, ethnicity, and origin ACS 2023
- Neighborhood character
- Predominantly White (95%)
- Race & ethnicity
- White 95% Two or more races 3% Hispanic / Latino 2%
- Common ancestry
- Romanian 9% Scotch-Irish 2% Iranian 2%
- Foreign-born
- 4%
- Languages at home
- 95% English-only · French/Haitian/Cajun 2% Russian/Polish/Slavic 1% Spanish 1%
Political lean MEDSL · Wayne
- 2024 margin
- Solid R (+37.1) · D 31.1% · R 68.2%
- 2008→2024 swing
- -24.8pp toward R · 2008: -12.3pp · 2024: -37.1pp
- All cycles
- 2024: R+37.1 2020: R+33.6 2016: R+39.7 2012: R+20.9 2008: R+12.3
Not yet ingested
- Civics
- —
Market trends
- HPI YoY
- ▲ 47.95%
- Current HPI
- 331.9645
- Rent YoY
- —
- Metro
- —
- State GDP YoY
- ▲ 1.68%
- F500 in state
- 34
Industry mix (Fortune 500 HQ in PA)
| Industry | F500 HQs | Revenue |
|---|---|---|
| Healthcare | 2 | $309B |
|
||
| Insurance | 2 | $27B |
|
||
| Telecommunications / Media | 1 | $124B |
|
||
| Industrial Distribution | 1 | $22B |
|
||
| Financial Services | 1 | $20B |
|
||
| Chemicals / Materials | 1 | $18B |
|
||
Price history
+774.8% since first listed4 events — show timeline
- 2026-05-28 Listed $349,900 PWMLS
- 2021-04-14 Sold (Public Records) $257,397 Public Records
- 2008-07-03 Sold (Public Records) $155,000 Public Records
- 2007-09-27 Sold (Public Records) $40,000 Public Records
Property tax history
+4.0%/yrLatest (2026): $3,677 · +3.0% YoY. Source: county tax records.
Cash-flow waterfall
monthlySold comps — $/sqft
last 12 mo · ≤1 miLoading sold comps…