2313 Dahler Ln · Woodland, CA
Flood risk No data
- FEMA flood zone
- —
- Chance of flooding over 30 yrs
- —
- Est. flood insurance / yr
- —
Fire risk No data
- Est. fire insurance / yr
- —
Heat risk No data
- Hot days now (above threshold)
- —
- Hot days in 30 yrs
- —
Wind risk No data
- Chance of severe wind over 30 yrs
- —
Air-quality risk No data
- Unhealthy air days now
- —
- Unhealthy air days in 30 yrs
- —
Risk factors via First Street. Map © Google.
Why this score? — see what drove the D- grade
The composite is a weighted blend of 9 inputs, each scored 0–100. Each bar is that input's sub-score; the figure is the points it added to the 100-point composite (weight × sub-score).
- ARV discount +15.0/15.0
- Cash flow +7.5/30.0
- Schools +4.0/10.0
- Rent growth +3.9/5.0
- Livability +3.4/5.0
- Condition / age +2.5/5.0
- DSCR +1.6/10.0
- 1% rule +0.8/10.0
- Appreciation +0.0/10.0
$574,240
🖨 Deal sheet 📄 Offer letter ✓ Due diligence
Listing remarks MLS
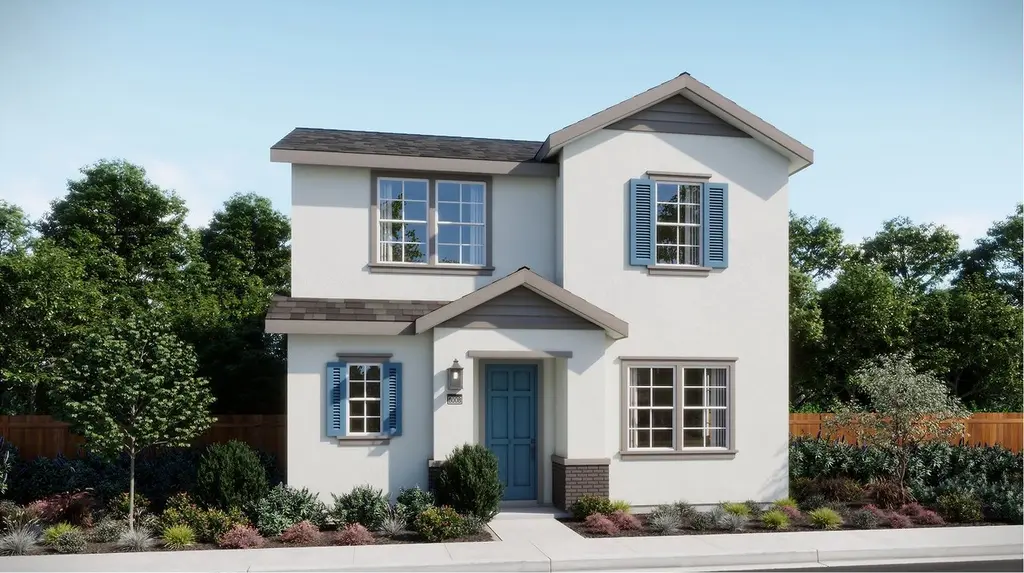
This new two-story home was designed with modern lifestyles in mind. An open-concept layout on the first floor maximizes interior space. On the second floor, a versatile loft provides a convenient shared living area easily accessible from two bedrooms and a luxurious owner's suite, complete with a spa-inspired bathroom and generous walk-in closet.
Key facts
- Walk-in closet
- Versatile loft
- Open-concept layout
Tags
Neighborhood map
What this means for you Summary
Snapshot
- This is a 3-bed/2.5-bath single-family listed at $574k.
Deal economics
- At list price, monthly cash flow is $-718 ($-9k/yr) — negative.
- To cash-flow at today's rent, offer at most $447k (22.1% below list).
- To meet the 1% rule (rent ≥ 1% of price), the offer needs to be $334k (41.8% below list).
- Recommended offer: $334k (41.8% below list) — sets the bar for 1% rule.
- Cap rate 4.8% vs local median 3.4% in Woodland — top-decile yield for the area; either an underpriced asset or a hidden risk that comps aren't pricing in. Stress-test before assuming the spread holds.
Location & tenants
- Location reads 67/100 on livability (#314 in CA) — a middle-class / working-renter tenant base. Strengths: employment A, housing A; Watch: amenities C-, schools F, cost of living F.
- Woodland Joint Unified (suburban): math 34% / reading 58% proficiency, ranked #171 of 517 in CA (top 33%) — families likely to look elsewhere, expect single-tenant / working-renter base with shorter leases.
- Market conditions: Rents rising fast (+5.4%/yr); 96 active listings in the ZIP; 3 comparable units currently listed for rent nearby; rentals at typical pace (median 15d on market — plan ~3-4 weeks tenant-placement turnaround); solid renter incomes; 721 units permitted in Yolo County in 2024 (260 in 5+ unit buildings).
- This rent runs 38% of the median local income ($107k/yr) — at the standard rent-burdened threshold; future hikes will face affordability resistance.
Forward outlook
- Local home prices are declining (-3.0%/yr); year-one equity from $4k of loan paydown is wiped out by about $17k of value loss. Plan a longer hold.
- Yolo County population projected at +31% by 2050 — long-run rental-demand tailwind backs the buy-and-hold thesis.
Negotiation context
- It's been on market 111 days — a 9% lower offer ($523k) is reasonable based on typical stale-listing flexibility.
Questions for the listing agent
- What do current leases actually rent for vs. the listed asking? Can we see a recent rent roll and the last 12 months of T-12 income?
- It's been on market 111 days. Have you received any prior offers? Is the seller open to a 42% concession, seller financing, or rate buy-down credit?
- Why hasn't it sold? Are there any deal-killer items the seller is aware of (foundation, flood, title, zoning, code violations)?
- Is there a deadline driving the sale (1031 exchange, divorce, estate, relocation)? That informs how much negotiation room exists.
- Schools are F-rated, which usually means shorter tenancies and higher turnover. Who's the typical renter profile here, and what's been the actual vacancy rate?
- The area grade is low — what's the realistic commute time and amenity access for the typical tenant pool here? Any planned neighborhood developments (good or bad) we should know about?
- What's the average days-on-market for RENTAL listings here right now (not sales)? A rising rental-DOM trend means longer vacancies and softer asking-rent achievability than the comps imply.
- What's the recent tenant-quality profile in this submarket — average credit score on applications, eviction rate, late-payment / NSF rate, and stable-employment percentage? A property-management company in the area should have these aggregated.
- How much new for-sale + rental construction is in the pipeline within 1–3 miles? Heavy new supply typically softens prices + rents 12–24 months out; constrained supply supports both.
Investment metrics
- 1% rule
- 0.58% ✗
- Cap rate
- 4.79%
- Cash-on-cash
- -5.36%
- DSCR
- 0.76
- GRM
- 14.3
CMA / ARV
- ARV (median comp)
- $725,632
- List price
- $574,240
- Delta
- -20.86%
- Verdict
- UNDERPRICED
- Comps
- 20 within 1.0 mi
Show comp detail 12 sales within ~0.75 mi
| Address | Dist | Beds/Ba | Sqft | Sold | Price | $/sf | Match |
|---|---|---|---|---|---|---|---|
| 2316 Dahler Ln | 0.02mi | 3/2.5 | 1,943 (0%) | 3mo | $512,000 | $264 | 97 |
| 2336 Dahler Ct | 0.05mi | 3/2.5 | 1,943 (0%) | 2mo | $530,000 | $273 | 96 |
| 2554 Chamberlain Ct | 0.08mi | 3/2.0 | 1,945 (+0%) | 6mo | $640,000 | $329 | 89 |
| 2340 Kaufman Ct | 0.06mi | 4/3.0 (+1) | 2,117 (+9%) | 1mo | $557,490 | $263 | 74 |
| 2340 Dahler Ct | 0.06mi | 4/3.0 (+1) | 2,117 (+9%) | 3mo | $565,000 | $267 | 73 |
| 1920 Campos Ave | 0.55mi | 3/2.0 | 1,975 (+2%) | 3mo | $650,000 | $329 | 68 |
| 2671 S Mack Way | 0.58mi | 3/2.0 | 1,975 (+2%) | 3mo | $626,000 | $317 | 66 |
| 2784 Shoemaker Ct | 0.63mi | 3/2.0 | 1,975 (+2%) | 2mo | $615,000 | $311 | 64 |
| 2000 Banks Pl | 0.53mi | 3/3.0 | 2,119 (+9%) | 3mo | $660,000 | $311 | 56 |
| 2100 Soza Pl | 0.71mi | 4/3.0 (+1) | 1,856 (-4%) | 1mo | $645,000 | $348 | 52 |
| 1832 Dunlap Pl | 0.57mi | 3/2.0 | 1,688 (-13%) | 4mo | $605,000 | $358 | 46 |
| 1817 Brubaker St | 0.56mi | 4/3.5 (+1) | 2,216 (+14%) | 3mo | $650,000 | $293 | 39 |
Match score weights: distance 35% · size 25% · config 20% · recency 20%. Top-matched comps best support the ARV.
Projected returns pro-forma
-3.0% appreciation · 5.4% rent growth · sell at horizon
- IRR
- -23.4%
- Equity multiple
- 0.19×
- Total profit
- $-130,864
- Equity at exit
- $85,621
- IRR
- -13.8%
- Equity multiple
- 0.14×
- Total profit
- $-138,581
- Equity at exit
- $49,650
Cash invested: $160,787 (down + closing). Projections, not guarantees.
Landlord ↔ Tenant lean methodology
- Overall (STATE)
- 18 Strongly Tenant-Friendly
- State California
- 18 Strongly Tenant-Friendly · D+13
- County
- — inherits STATE
- City
- — inherits STATE
ZIP-level market 95776
- Home prices YoY
- -30.2%
- Rents YoY
- 5.4%
- Active inventory
- 96
- Price-to-rent
- 14.3×
Monthly cashflow live
- Estimated rent
- $3,340 medium interval (Pro) →
- Mortgage (P&I)
- −$3,011
- Tax from tax record
- −$106 /mo · $1,277/yr
- Insurance
- −$239
- HOA
- −$0
- Vacancy / Maint / Mgmt
- −$701
- Net cashflow
- $-718
Break-even live
UW: 25.0% down · 7.5% · 30yr · 1.5% tax · 5.0% vac · 8.0% maint · 8.0% mgmt
Financing live
Cash to close
- Down payment
- $143,560
- Closing costs
- $17,227
- Reserves months
- —
- Total cash needed
- —
Loan-product check · same deal, 3 products live
Conventional
25% down · 7.5% · 30yr
- Down + closing
- —
- Monthly P&I
- —
- Monthly cashflow
- —
- DSCR
- —
- Eligible?
- —
Personal DTI + credit; lowest rate.
DSCR
20% down · 8.5% · 30yr
- Down + closing
- —
- Monthly P&I
- —
- Monthly cashflow
- —
- DSCR
- —
- Eligible?
- —
No personal income docs; deal must DSCR.
Hard money
10% down · 12.0% · 12mo
- Down + closing
- —
- Monthly P&I
- —
- Monthly cashflow
- —
- DSCR
- —
- Eligible?
- —
Short-term bridge; refi at stabilization.
Rent comps 3 comps
| Address | Beds | Baths | Sqft | Rent | $/sqft | DOM | Units | Dist |
|---|---|---|---|---|---|---|---|---|
| 2123 Sieber Dr Woodland, CA | 4.0 | 2.5 | 1760 | $2,900 | $1.65 | 14d | 1 | 0.50mi |
| 2123 Sieber Dr Woodland, CA | 4.0 | 3.0 | 1760 | $3,000 | $1.70 | 17d | 1 | 0.50mi |
| 2509 Allen Cir Woodland, CA | 3.0 | 2.5 | 2043 | $3,850 | $1.88 | 4d | 1 | 0.86mi |
Listing history 15 events
-
2026-06-18days on market $574,240 Active 111 DOM
-
2026-06-17days on market $574,240 Active 110 DOM
-
2026-06-16days on market $574,240 Active 109 DOM
-
2026-06-15days on market $574,240 Active 108 DOM
-
2026-06-13days on market $574,240 Active 106 DOM
-
2026-06-09days on market $574,240 Active 102 DOM
-
2026-06-08days on market $574,240 Active 101 DOM
-
2026-06-07days on market $574,240 Active 100 DOM
-
2026-06-05days on market $574,240 Active 97 DOM
-
2026-06-03days on market $574,240 Active 96 DOM
-
2026-06-02days on market $574,240 Active 95 DOM
-
2026-06-01days on market $574,240 Active 94 DOM
-
2026-05-31days on market $574,240 Active 93 DOM
-
2026-02-27$574,240 Active 349-char remark
Show marketing remark (349 chars)
This new two-story home was designed with modern lifestyles in mind. An open-concept layout on the first floor maximizes interior space. On the second floor, a versatile loft provides a convenient shared living area easily accessible from two bedrooms and a luxurious owner's suite, complete with a spa-inspired bathroom and generous walk-in closet.
-
2026-01-09soldstatus $595,500
ⓘ Source: listings_history table (triggers on properties + properties_extension) + one-shot
backfill from property_details.listing_events for pre-trigger history.
Tax reassessment forecast CA · Resets to sale price
- Current annual tax
- $1,277 · $106/mo
- Projected year-2 tax
- $4,364 · $364/mo
- Expected delta
- +$3,087/yr (+$257/mo · 241.7%)
ⓘ Screening estimate from a state-policy table — verify with the county assessor before closing.
Nearby sold comps map
Loading sold comps map…
Walkable amenities ~0.75 mi
Loading nearby amenities…
Taxation est. · year 1
- Rental income
- $40,083
- − Mortgage interest
- −$32,166
- − Property taxes
- −$1,277
- − Insurance
- −$2,871
- − Repairs & maintenance
- −$3,207
- − Management
- −$3,207
- − Depreciation
- −$16,705
- Taxable loss
- −$19,350
- Est. tax savings @ 24.0%
- +$4,644
- After-tax cash flow
- $-3,975/yr
For passive investors: Depreciation is non-cash, so a rental often shows a tax loss while cash-flowing — sheltering income. Rental losses are passive: they offset passive income freely, and up to $25,000/yr can offset ordinary (W-2) income if you actively participate and your MAGI is under $100k (phasing out to $0 by $150k); unused losses carry forward. On sale, claimed depreciation is recaptured at up to 25%, and gains may owe capital-gains tax (a 1031 exchange can defer both). Figures are a year-1 estimate at your 24.0% rate — not tax advice; consult a CPA.
Schools (NCES district)
- District
- Woodland Joint Unified
- NCES district ID
- 0643080
- Math proficiency
- 34% ▲ 6.00%
- Reading proficiency
- 58% ▲ 15.00%
- Median HH income
- $57,556
- Composite
- 40.1/100
- National rank
- #3803
- State rank
- #171 of 517 in CA
Livability — Woodland
- Score
- 67/100
- State rank
- #314
- US rank
- #10682
Category grades
Schools grade is shown separately in the Schools card above.
Census & demographics
- Census place
- Woodland, CA
- County
- Yolo County · 212,115 people
- City population
- 66,420
- Metro
- Sacramento-Roseville-Folsom, CA
- Population (ZIP)
- 28,718
- Household income
- $106,698
- Rent vs Own
- Severe rent burden
- 654.0
Population outlook (Yolo County) Hauer SSP2
- Today (2025)
- 242,183 people
- By 2030
- 257,662 · +6.4%
- By 2040
- 288,050 · +18.9%
- By 2050
- 318,202 · +31.4%
- By 2075
- 392,736 · +62.2%
- By 2100
- 438,150 · +80.9%
Race, ethnicity, and origin ACS 2023
- Neighborhood character
- Diverse neighborhood (Simpson 0.67)
- Race & ethnicity
- Hispanic / Latino 46% White 32% Two or more races 20% Asian 13% Black 2%
- Hispanic origin (detail)
- Mexican 43%
- Common ancestry
- Italian 3% Scotch-Irish 2% Lithuanian 1%
- Foreign-born
- 25% · Canada, China, South Korea
- Languages at home
- 57% English-only · Spanish 31% Other Indo-European 7% Chinese 2%
Political lean MEDSL · Yolo
- 2024 margin
- Solid D (+36.2) · D 66.3% · R 30.1% · Other 3.6%
- 2008→2024 swing
- 0.0pp no change · 2008: 36.2pp · 2024: 36.2pp
- All cycles
- 2024: D+36.2 2020: D+41.4 2016: D+42.0 2012: D+33.2 2008: D+36.2
Not yet ingested
- Civics
- —
Market trends
- HPI YoY
- ▼ -119.41%
- Current HPI
- 276.202
- Rent YoY
- ▲ 5.40%
- Metro
- Sacramento-Roseville-Folsom, CA
- State GDP YoY
- ▲ 3.21%
- F500 in state
- 116
Industry mix (Fortune 500 HQ in CA)
| Industry | F500 HQs | Revenue |
|---|---|---|
| Technology | 27 | $1,492B |
|
||
| Financial Services | 3 | $174B |
|
||
| Retail | 3 | $44B |
|
||
| Insurance | 3 | $26B |
|
||
| Media / Entertainment | 2 | $115B |
|
||
| Pharmaceuticals / Biotech | 2 | $62B |
|
||
Price history
-3.6% since first listed2 events — show timeline
- 2026-02-27 Listed $574,240 Zillow
- 2026-01-09 Sold (Public Records) $595,500 Public Records
Cash-flow waterfall
monthlySold comps — $/sqft
last 12 mo · ≤1 miLoading sold comps…