 Fourplex
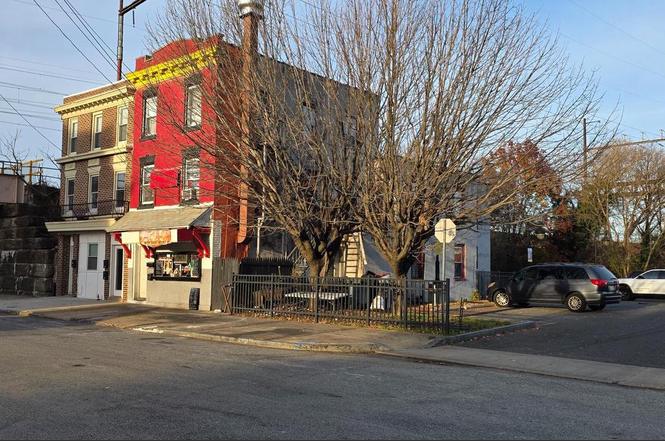
525 Welsh St · Chester, PA
Flood risk 4/10 · Minor
- FEMA flood zone
- X (unshaded)
- Chance of flooding over 30 yrs
- 0.13%
- Est. flood insurance / yr
- $507 – $1,088
Fire risk 1/10 · Minimal
- Est. fire insurance / yr
- $511 – $949
Heat risk 7/10 · Major
- Hot days now (above 105°F)
- 7 days/yr
- Hot days in 30 yrs
- 15 days/yr
Wind risk 6/10 · Moderate
- Chance of severe wind over 30 yrs
- 27.0%
Air-quality risk 4/10 · Minor
- Unhealthy air days now
- 4 days/yr
- Unhealthy air days in 30 yrs
- 7 days/yr
Risk factors via First Street. Map © Google.
Why this score? — see what drove the B- grade
The composite is a weighted blend of 9 inputs, each scored 0–100. Each bar is that input's sub-score; the figure is the points it added to the 100-point composite (weight × sub-score).
- Cash flow +30.0/30.0
- 1% rule +10.0/10.0
- DSCR +10.0/10.0
- ARV discount +7.5/15.0
- Rent growth +4.2/5.0
- Livability +3.7/5.0
- Condition / age +2.5/5.0
- Schools +0.8/10.0
- Appreciation +0.0/10.0
$275,000
🖨 Deal sheet 📄 Offer letter ✓ Due diligence
Multi-family units
County records classify this as Multi-Family (2-4 Unit). Listing-text estimate: 4 units. confirmed
Listing remarks
Investment Opportunity Deal: 4-Unit Apartment and storefront in Chester Overview: This 4-unit apartment and storefront building in Chester presents an exceptional investment opportunity with strong income potential. Fully rented and generating monthly cashflow. This property is perfect for savvy investors looking to enhance their portfolio. Key Features: Consistent Cash Flow: With all units currently occupied, you can start collecting income right away, ensuring immediate cash flow from day one. Prime Location: Situated in a desirable area, this property benefits from high demand for rental units, making it an attractive option for tenants and investors alike. Diverse Rental Income: The
Key facts
- Built 1905
- Listed 19 days
Property features AI
Finance
- Financial info: Total of 4 units in the building; Improvement assessed value listed; Land assessed value listed; Tax assessed value and annual tax reported; Assessment year reported
Exterior
- Utilities: Public water; Public septic; Natural gas service
- Home design: Fee simple ownership; Estimated year built
- Construction: Concrete perimeter foundation; Above grade and below grade structures
- Exterior features: Lot dimensions approximately 20 x 139 feet; No tidal water on property
Interior
- Bedrooms: 4 single-room units
- Heating & cooling: Baseboard hot water heating; Radiator heating; Natural gas fuel for heating and hot water
- Interior features: End of row/townhouse structure
Neighborhood map
What this means for you Summary
Snapshot
- This is a 4 × 3-bed/2.0-bath units multifamily listed at $275k.
Deal economics
- At list price, monthly cash flow is $3k ($37k/yr) — positive. Per door: $765/mo.
- The deal already cash-flows at list — no discount required.
- Meets the 1% rule at list price ($6k rent vs $275k).
- Recommended offer: $271k (1.5% below list) — sets the bar for market timing.
- Cap rate 19.6% vs local median 7.5% in Chester — top-decile yield for the area; either an underpriced asset or a hidden risk that comps aren't pricing in. Stress-test before assuming the spread holds.
Location & tenants
- Location reads 73/100 on livability (#540 in PA) — a middle-class / working-renter tenant base. Strengths: amenities A+, commute A+, cost of living A+; Watch: schools F, crime F, employment F.
- Chester-Upland SD (suburban): math 4% / reading 17% proficiency, ranked #533 of 539 in PA (top 99%) — low school quality limits family demand, transient renter base, plan for 1-2y turnover; 81% free/reduced lunch — lower-income household profile, screen leases tightly.
- Market conditions: Rents rising fast (+6.9%/yr); 138 active listings in the ZIP; 40 comparable units currently listed for rent nearby; rentals at typical pace (median 24d on market — plan ~3-4 weeks tenant-placement turnaround); 42% of comp listings sitting > 30 days — soft ceiling on asking rent; lower-income renter base — watch delinquency; 299 units permitted in Delaware County in 2024 (5 in 5+ unit buildings).
- At $6,279/mo this rent would consume 183% of the median local household income ($41k/yr) (locally 2668% of renters already pay >50% of income on rent) — very limited rent-growth headroom before tenants either downsize or default.
Forward outlook
- Local home prices are declining (-3.0%/yr); year-one equity from $2k of loan paydown is wiped out by about $8k of value loss. Plan a longer hold.
- At projected returns (-3.0% appreciation + 6.9% rent growth), your $77k cash investment doubles in ~3 years — after that, you're playing with house money.
Negotiation context
- It's been on market 19 days — a 2% lower offer ($271k) is reasonable based on typical stale-listing flexibility.
- 5 sale attempts since 15y ago; this cycle's ask has dropped $25k (8%) from the opening price — seller is motivated, your offer sets the floor, not the list.
Risks & watch-outs
- Watch-outs: built in 1905 — expect roof / HVAC / electrical / plumbing capex.
- Climate carrying-cost: major wind risk, 27% chance of damaging wind over 30y; extreme-heat days projected 7→15/yr by 2055 (HVAC capex compounding) — expect insurance premiums to compound above CPI over the hold.
Questions for the listing agent
- Can we see the unit-by-unit rent roll, current vacancy, and any below-market leases? What's the average tenancy length?
- What capital expenditures (roof, boiler, parking lot, exteriors) have been made in the last 5 years, and what's planned in the next 2?
- Built in 1905 — when were the roof, HVAC, electrical panel, plumbing, and water heater last replaced?
- Is there a deadline driving the sale (1031 exchange, divorce, estate, relocation)? That informs how much negotiation room exists.
- Schools are F-rated, which usually means shorter tenancies and higher turnover. Who's the typical renter profile here, and what's been the actual vacancy rate?
- Crime grade is F in this area — have there been break-ins, vandalism, or insurance claims at this property in the last 3 years? What carrier currently insures it and at what premium?
- What's the average days-on-market for RENTAL listings here right now (not sales)? A rising rental-DOM trend means longer vacancies and softer asking-rent achievability than the comps imply.
- What's the recent tenant-quality profile in this submarket — average credit score on applications, eviction rate, late-payment / NSF rate, and stable-employment percentage? A property-management company in the area should have these aggregated.
- How much new apartment / multifamily construction is in the pipeline within 1–3 miles? Heavy new supply (>2% of stock underway) typically softens rents 12–24 months out; light construction supports rent growth.
Investment metrics
- 1% rule
- 2.28% ✓
- Cap rate
- 19.65%
- Cash-on-cash
- 47.69%
- DSCR
- 3.12
- GRM
- 3.6
CMA / ARV
No comps found within radius.
Show comp detail 12 sales within ~0.75 mi
| Address | Dist | Beds/Ba | Sqft | Sold | Price | $/sf | Match |
|---|---|---|---|---|---|---|---|
| 225 E 4th St | 0.16mi | 4/— | 1,504 | 9mo | $77,000 | $51 | 73 |
| 323 W 7th St | 0.45mi | 5/— | 2,885 | 1mo | $280,000 | $97 | 66 |
| 523 Concord Ave | 0.41mi | 8/— | 3,000 | 7mo | $400,000 | $133 | 63 |
| 619 Fulton St | 0.48mi | 3/— | 1,716 | 7mo | $205,000 | $119 | 59 |
| 428 Penn St | 0.32mi | 2/— | 1,680 | 17mo | $160,800 | $96 | 58 |
| 332 Kerlin St | 0.65mi | 4/— | 1,784 | 2mo | $69,900 | $39 | 55 |
| 610 E 9th St | 0.50mi | 6/— | 1,760 | 13mo | $193,500 | $110 | 54 |
| 608 E 9th St | 0.50mi | 5/— | 1,776 | 15mo | $193,500 | $109 | 52 |
| 1117 Upland St | 0.47mi | 4/— | 1,296 | 17mo | $190,000 | $147 | 52 |
| 329 Rose St | 0.45mi | 2/2.0 | 1,777 | 19mo | $169,900 | $96 | 51 |
| 927 Morton Ave | 0.56mi | 5/— | 2,184 | 19mo | $59,000 | $27 | 45 |
| 1127 Kerlin St | 0.75mi | 3/— | 1,768 | 17mo | $155,000 | $88 | 38 |
Match score weights: distance 35% · size 25% · config 20% · recency 20%. Top-matched comps best support the ARV.
Projected returns pro-forma
-3.0% appreciation · 6.88% rent growth · sell at horizon
- IRR
- 49.5%
- Equity multiple
- 3.28×
- Total profit
- $175,890
- Equity at exit
- $41,003
- IRR
- 56.6%
- Equity multiple
- 7.72×
- Total profit
- $517,712
- Equity at exit
- $23,777
Cash invested: $77,000 (down + closing). Projections, not guarantees.
Landlord ↔ Tenant lean methodology
- Overall (STATE)
- 62 Landlord-Friendly
- State Pennsylvania
- 62 Landlord-Friendly · EVEN
- County
- — inherits STATE
- City
- — inherits STATE
ZIP-level market 19013
- Rents YoY
- 6.9%
- Active inventory
- 138
- Price-to-rent
- 14.6×
Monthly cashflow live
- Estimated rent
- $6,279 high interval (Pro) →
- Mortgage (P&I)
- −$1,442
- Tax est. 1.5%
- −$344 /mo · $4,125/yr
- Insurance
- −$115
- HOA
- −$0
- Vacancy / Maint / Mgmt
- −$1,319
- Net cashflow
- $3,060
Break-even live
4-unit breakdown (identical units grouped — click to expand)
| Units | Beds | Baths | Est. rent |
|---|---|---|---|
| 4× units | 3 | 2 | $6,280 |
| #1 | 3 | 2 | $1,570 |
| #2 | 3 | 2 | $1,570 |
| #3 | 3 | 2 | $1,570 |
| #4 | 3 | 2 | $1,570 |
| Total (4 units) | $6,279 | ||
UW: 25.0% down · 7.5% · 30yr · 1.5% tax · 5.0% vac · 8.0% maint · 8.0% mgmt
Financing live
Cash to close
- Down payment
- $68,750
- Closing costs
- $8,250
- Reserves months
- —
- Total cash needed
- —
Loan-product check · same deal, 3 products live
Conventional
25% down · 7.5% · 30yr
- Down + closing
- —
- Monthly P&I
- —
- Monthly cashflow
- —
- DSCR
- —
- Eligible?
- —
Personal DTI + credit; lowest rate.
DSCR
20% down · 8.5% · 30yr
- Down + closing
- —
- Monthly P&I
- —
- Monthly cashflow
- —
- DSCR
- —
- Eligible?
- —
No personal income docs; deal must DSCR.
Hard money
10% down · 12.0% · 12mo
- Down + closing
- —
- Monthly P&I
- —
- Monthly cashflow
- —
- DSCR
- —
- Eligible?
- —
Short-term bridge; refi at stabilization.
Rent comps 40 comps
| Address | Beds | Baths | Sqft | Rent | $/sqft | DOM | Units | Dist |
|---|---|---|---|---|---|---|---|---|
| 814 Upland St Chester, PA | 3.0 | 1.0 | 1344 | $1,525 | $1.13 | 7d | 1 | 0.27mi |
| 428 Penn St Unit 1 Chester, PA | 1.0 | 1.0 | 1680 | $1,295 | $0.77 | 17d | 1 | 0.35mi |
| 210 W 5th St Unit 1a Chester, PA | 1.0 | 2.0 | 1400 | $1,400 | $1.00 | 43d | 1 | 0.36mi |
| 418 Penn St Chester, PA | 3.0 | 1.0 | 1250 | $1,350 | $1.08 | 43d | 1 | 0.36mi |
| 519 E 9th St Unit 1F Chester, PA | 1.0 | 1.0 | 550 | $1,050 | $1.91 | 24d | 1 | 0.39mi |
| 535 Moya St Chester, PA | 2.0 | 1.0 | 624 | $1,200 | $1.92 | 43d | 1 | 0.44mi |
| 523 Concord Ave Unit 2R Chester, PA | 1.0 | 1.0 | 700 | $1,050 | $1.50 | 43d | 1 | 0.44mi |
| 610 E 9th St Apt 2 Claymont, DE | 3.0 | 1.0 | 1760 | $1,300 | $0.74 | 43d | 1 | 0.46mi |
| 608 E 9th St Unit 2 Chester, PA | 2.0 | 1.0 | 1776 | $1,400 | $0.79 | 43d | 1 | 0.46mi |
| 608 E 9th St Unit 2 Chester, PA | 2.0 | 1.0 | — | $1,400 | — | 17d | 1 | 0.46mi |
| 336 W 8th St Apt D Chester, PA | 1.0 | 1.0 | — | $1,215 | — | 12d | 1 | 0.53mi |
| 1470 Providence Ave Chester, PA | 2.0 | 1.0 | — | $1,250 | — | 43d | 1 | 0.68mi |
| 901 W 8th St Chester, PA | 1.0 | 1.5 | 836 | $1,500 | $1.79 | 43d | 1 | 0.80mi |
| 1211 Johnson St Chester, PA | 3.0 | 1.0 | 882 | $1,500 | $1.70 | 2d | 1 | 0.81mi |
| 1100 Remington St Chester, PA | 3.0 | 1.0 | — | $1,515 | — | 43d | 1 | 0.81mi |
| 1111 Morton Ave Unit B Chester, PA | 1.0 | 1.0 | — | $1,100 | — | 43d | 1 | 0.83mi |
| 1124 Thomas St Chester, PA | 3.0 | 1.0 | 1046 | $1,200 | $1.15 | 24d | 1 | 0.85mi |
| 1118 Brown St Unit 318 Chester, PA | 3.0 | 1.0 | 1092 | $1,900 | $1.74 | 14d | 1 | 0.85mi |
| 24 E 18th St Unit 1st fl Chester, PA | 1.0 | 1.0 | 600 | $1,065 | $1.77 | 5d | 1 | 0.88mi |
| 330 W 21st St Chester, PA | 3.0 | 1.0 | 1152 | $1,500 | $1.30 | 43d | 1 | 0.89mi |
| 1206 Thomas St Chester, PA | 3.0 | 1.0 | 833 | $1,399 | $1.68 | 24d | 1 | 0.91mi |
| 2013 Edgmont Ave Chester, PA | 3.0 | 1.0 | — | $1,600 | — | 20d | 1 | 0.99mi |
| 1406 Morton Ave Chester, PA | 3.0 | 1.0 | — | $1,500 | — | 43d | 1 | 1.01mi |
| 726 E 18th St Chester, PA | 3.0 | 1.5 | 1584 | $2,200 | $1.39 | 14d | 1 | 1.02mi |
| 13 E 21st St Unit A Chester, PA | 2.0 | 1.0 | 900 | $1,250 | $1.39 | 43d | 1 | 1.02mi |
| 2219 Madison St Unit B Chester, PA | 2.0 | 1.0 | 800 | $1,000 | $1.25 | 43d | 1 | 1.15mi |
| 2015 Hyatt St Chester, PA | 3.0 | 1.0 | 988 | $1,950 | $1.97 | 10d | 1 | 1.16mi |
| 209 W Parkway Ave Apt B Chester, PA | 2.0 | 1.0 | — | $1,415 | — | 43d | 1 | 1.19mi |
| 1312 E 13th St Crum Lynne, PA | 3.0 | 1.0 | 1280 | $1,940 | $1.52 | 18d | 1 | 1.21mi |
| 206 W Parkway Ave Chester, PA | 2.0 | 1.0 | 1666 | $1,450 | $0.87 | 24d | 1 | 1.22mi |
| 936 Simpson St Crum Lynne, PA | 2.0 | 1.0 | — | $1,350 | — | 14d | 1 | 1.22mi |
| 1 Church St Brookhaven, PA | 1.0 | 1.0 | — | $650 | — | 24d | 1 | 1.23mi |
| 920 E 21st St Unit 2 Chester, PA | 1.0 | 1.0 | 563 | $1,000 | $1.78 | 11d | 1 | 1.26mi |
| 920 E 21st St Unit 16 Chester, PA | 1.0 | 1.0 | — | $1,000 | — | 43d | 1 | 1.26mi |
| 920 E 21st St Unit 1BR Chester, PA | 1.0 | 1.0 | 650 | $1,000 | $1.54 | 24d | 1 | 1.26mi |
| 2614 Cisco Ct Unit A Brookhaven, PA | 2.0 | 1.0 | — | $1,600 | — | 43d | 1 | 1.29mi |
| 25 W Parkway Ave Chester, PA | 3.0 | 1.0 | 1324 | $1,600 | $1.21 | 5d | 1 | 1.29mi |
| 1000 MacDade Blvd Chester, PA | 1.0 | 1.0 | — | $1,100 | — | 5d | 1 | 1.30mi |
| 314 E 24th St Chester, PA | 2.0 | 1.0–1.5 | 800 | $1,500 | $1.88 | 4d | 13 | 1.30mi |
| 500 E 24th St Chester, PA | 1.0–2.0 | 1.0 | — | $1,150 | — | 4d | 2 | 1.31mi |
Listing history 15 events
-
2026-06-18days on market $275,000 Active 19 DOM
-
2026-06-17days on market $275,000 Active 18 DOM
-
2026-06-16days on market $275,000 Active 17 DOM
-
2026-06-15days on market $275,000 Active 16 DOM
-
2026-06-13days on market $275,000 Active 14 DOM
-
2026-06-13days on market $275,000 Active 13 DOM
-
2026-06-09days on market $275,000 Active 10 DOM
-
2026-06-08days on market $275,000 Active 9 DOM
-
2026-06-07days on market $275,000 Active 8 DOM
-
2026-06-04days on market $275,000 Active 5 DOM
-
2026-06-03days on market $275,000 Active 4 DOM
-
2026-06-02days on market $275,000 Active 3 DOM
-
2026-06-01days on market $275,000 Active 2 DOM
-
2026-05-31remarks 699-char remark
-
2026-05-31$275,000 Active 1 DOM
ⓘ Source: listings_history table (triggers on properties + properties_extension) + one-shot
backfill from property_details.listing_events for pre-trigger history.
Climate risk First Street
- Flood 4/10 Moderate FEMA zone X (unshaded) · 13% chance over 30 yrs
- Wildfire 1/10 Low
- Heat 7/10 Severe 7 d/yr ≥105°F today · 15 d/yr by 30 yrs out
- Wind 6/10 Major 27% chance of damaging wind over 30 yrs
- Air quality 4/10 Moderate 4 unhealthy d/yr today · 7 by 30 yrs out
Nearby sold comps map
Loading sold comps map…
Walkable amenities ~0.75 mi
Loading nearby amenities…
Taxation est. · year 1
- Rental income
- $75,348
- − Mortgage interest
- −$15,404
- − Property taxes
- −$4,125
- − Insurance
- −$1,375
- − Repairs & maintenance
- −$6,028
- − Management
- −$6,028
- − Depreciation
- −$8,000
- Taxable income
- $34,388
- Est. tax owed @ 24.0%
- −$8,253
- After-tax cash flow
- $28,466/yr
For passive investors: Depreciation is non-cash, so a rental often shows a tax loss while cash-flowing — sheltering income. Rental losses are passive: they offset passive income freely, and up to $25,000/yr can offset ordinary (W-2) income if you actively participate and your MAGI is under $100k (phasing out to $0 by $150k); unused losses carry forward. On sale, claimed depreciation is recaptured at up to 25%, and gains may owe capital-gains tax (a 1031 exchange can defer both). Figures are a year-1 estimate at your 24.0% rate — not tax advice; consult a CPA.
Schools (NCES district)
- District
- Chester-Upland SD
- NCES district ID
- 4205860
- Math proficiency
- 4% ▼ -3.00%
- Reading proficiency
- 17% ▼ -6.00%
- Median HH income
- $29,790
- Composite
- 8.05/100
- National rank
- #9918
- State rank
- #533 of 539 in PA
Livability — Chester
- Score
- 73/100
- State rank
- #540
- US rank
- #5053
Category grades
Schools grade is shown separately in the Schools card above.
Census & demographics
- Census place
- Chester, PA
- County
- Delaware County · 399,863 people
- City population
- 35,064
- Metro
- Philadelphia-Camden-Wilmington, PA-NJ-DE-MD
- Population (ZIP)
- 35,064
- Household income
- $41,261
- Rent vs Own
- Severe rent burden
- 2668.0
Population outlook (Delaware County) Hauer SSP2
- Today (2025)
- 577,490 people
- By 2030
- 581,243 · +0.6%
- By 2040
- 584,700 · +1.2%
- By 2050
- 586,581 · +1.6%
- By 2075
- 598,706 · +3.7%
- By 2100
- 590,823 · +2.3%
Race, ethnicity, and origin ACS 2023
- Neighborhood character
- Predominantly Black (71%)
- Race & ethnicity
- Black 71% White 14% Hispanic / Latino 9% Two or more races 4%
- Hispanic origin (detail)
- Puerto Rican 6%
- Common ancestry
- Romanian 2%
- Foreign-born
- 4% · Canada
- Languages at home
- 92% English-only · Spanish 6%
Political lean MEDSL · Delaware
- 2024 margin
- Strong D (+23.7) · D 61.4% · R 37.6% · Other 1.0%
- 2008→2024 swing
- +2.3pp toward D · 2008: 21.4pp · 2024: 23.7pp
- All cycles
- 2024: D+23.7 2020: D+26.7 2016: D+22.0 2012: D+21.8 2008: D+21.4
Not yet ingested
- Civics
- —
Market trends
- HPI YoY
- ▼ -149.69%
- Current HPI
- 219.5173
- Rent YoY
- ▲ 6.88%
- Metro
- Philadelphia-Camden-Wilmington, PA-NJ-DE-MD
- State GDP YoY
- ▲ 1.68%
- F500 in state
- 34
Industry mix (Fortune 500 HQ in PA)
| Industry | F500 HQs | Revenue |
|---|---|---|
| Healthcare | 2 | $309B |
|
||
| Insurance | 2 | $27B |
|
||
| Telecommunications / Media | 1 | $124B |
|
||
| Industrial Distribution | 1 | $22B |
|
||
| Financial Services | 1 | $20B |
|
||
| Chemicals / Materials | 1 | $18B |
|
||
Price history
+12.2% since first listed11 events — show timeline
- 2026-05-31 Price Changed $275,000 BRIGHT MLS
- 2026-05-31 Relisted — BRIGHT MLS
- 2026-03-25 Listing Removed — BRIGHT MLS
- 2026-03-25 Relisted — BRIGHT MLS
- 2026-02-09 Listing Removed — BRIGHT MLS
- 2026-02-09 Listed $300,000 BRIGHT MLS
- 2024-06-30 Listing Removed — BRIGHT MLS
- 2024-03-05 Price Changed $300,000 BRIGHT MLS
- 2024-01-10 Listed $325,000 BRIGHT MLS
- 2011-09-30 Listing Removed — BRIGHT MLS
- 2011-03-29 Listed $245,000 BRIGHT MLS
Cash-flow waterfall
monthlySold comps — $/sqft
last 12 mo · ≤1 miLoading sold comps…