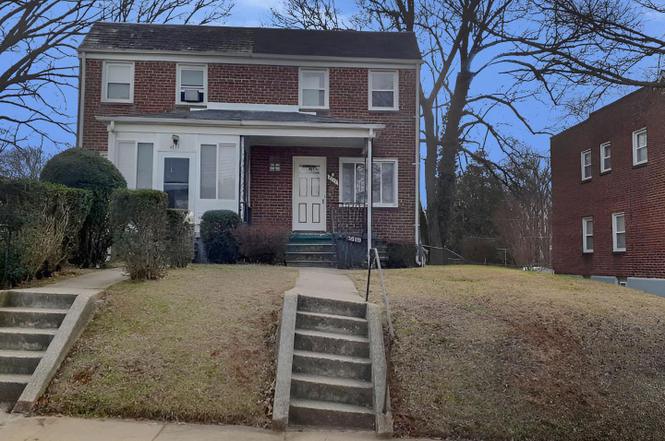
5619 Wesley Ave · Baltimore, MD
Flood risk 1/10 · Minimal
- FEMA flood zone
- X (unshaded)
- Chance of flooding over 30 yrs
- 0.0%
- Est. flood insurance / yr
- $473 – $860
Fire risk 1/10 · Minimal
- Est. fire insurance / yr
- $755 – $1,403
Heat risk 6/10 · Moderate
- Hot days now (above 103°F)
- 7 days/yr
- Hot days in 30 yrs
- 15 days/yr
Wind risk 4/10 · Minor
- Chance of severe wind over 30 yrs
- 21.0%
Air-quality risk 3/10 · Minor
- Unhealthy air days now
- 3 days/yr
- Unhealthy air days in 30 yrs
- 4 days/yr
Risk factors via First Street. Map © Google.
Why this score? — see what drove the C+ grade
The composite is a weighted blend of 9 inputs, each scored 0–100. Each bar is that input's sub-score; the figure is the points it added to the 100-point composite (weight × sub-score).
- Cash flow +18.2/30.0
- ARV discount +13.2/15.0
- Appreciation +9.8/10.0
- DSCR +5.7/10.0
- 1% rule +5.5/10.0
- Rent growth +3.8/5.0
- Livability +3.8/5.0
- Condition / age +2.5/5.0
- Schools +1.0/10.0
$162,000
🖨 Deal sheet 📄 Offer letter ✓ Due diligence
Listing remarks
Welcome to 5619 Wesley Avenue, a charming 3-bedroom, 1.5-bath brick rowhouse in the desirable Howard Park neighborhood. This home features approximately 1,024 sq ft of living space, a partially finished basement, off-street parking, and a private backyard perfect for outdoor enjoyment. The property offers central heating and A/C for year-round comfort and is conveniently located near public transit, shopping, and major routes. Offers will be entertained after the property has been exposed on the MLS for 7 calendar days. Don’t miss this opportunity to own a well-maintained home in a sought-after Baltimore location.
Key facts
- Central heating
- Private backyard
- A/c
Tags
Neighborhood map
What this means for you Summary
Snapshot
- This is a 3-bed/1.0-bath townhouse listed at $162k.
Deal economics
- At list price, monthly cash flow is $146 ($2k/yr) — positive.
- The deal already cash-flows at list — no discount required.
- Meets the 1% rule at list price ($2k rent vs $162k).
- Recommended offer: $157k (3.0% below list) — sets the bar for market timing.
- Cap rate 7.4% vs local median 6.0% in Baltimore — meaningfully above typical; check what's discounted (condition, days-on-market, listing class) to confirm the premium yield is real.
Location & tenants
- Location reads 76/100 on livability (#90 in MD, #3,396 nationally) — a middle-class / working-renter tenant base. Strengths: amenities A+, commute A+, housing A+; Watch: schools D, crime F.
- Baltimore City Public Schools (urban): math 7% / reading 16% proficiency, ranked #24 of 24 in MD (top 100%) — low school quality limits family demand, transient renter base, plan for 1-2y turnover; 79% free/reduced lunch — lower-income household profile, screen leases tightly.
- Market conditions: Rents rising fast (+5.2%/yr); 126 active listings in the ZIP; 28 comparable units currently listed for rent nearby; rentals at typical pace (median 24d on market — plan ~3-4 weeks tenant-placement turnaround); 43% of comp listings sitting > 30 days — soft ceiling on asking rent; 1,273 units permitted in Baltimore city in 2024 (1,104 in 5+ unit buildings).
- This rent runs 30% of the median local income ($67k/yr) — at the standard rent-burdened threshold; future hikes will face affordability resistance.
Forward outlook
- In year one you build about $17k of equity ($1k loan paydown + $15k appreciation (9.5% local appreciation)).
- Baltimore County population projected to shrink 4% by 2050 — rents likely to lag national; underwrite the cash flow, not the appreciation.
- At projected returns (9.5% appreciation + 5.2% rent growth), your $45k cash investment doubles in ~3 years — after that, you're playing with house money.
- By year 3, paydown + projected appreciation supports a ~$42k cash-out refi (75% LTV) — recoverable capital for the next deal without selling this one.
Negotiation context
- It's been on market 40 days — a 3% lower offer ($157k) is reasonable based on typical stale-listing flexibility.
Risks & watch-outs
- Watch-outs: built in 1956 — expect roof / HVAC / electrical / plumbing capex.
- Climate carrying-cost: extreme-heat days projected 7→15/yr by 2055 (HVAC capex compounding) — expect insurance premiums to compound above CPI over the hold.
Questions for the listing agent
- It's been on market 40 days. Have you received any prior offers? Is the seller open to a 3% concession, seller financing, or rate buy-down credit?
- Built in 1956 — when were the roof, HVAC, electrical panel, plumbing, and water heater last replaced?
- Is there a deadline driving the sale (1031 exchange, divorce, estate, relocation)? That informs how much negotiation room exists.
- Schools are D-rated, which usually means shorter tenancies and higher turnover. Who's the typical renter profile here, and what's been the actual vacancy rate?
- Crime grade is F in this area — have there been break-ins, vandalism, or insurance claims at this property in the last 3 years? What carrier currently insures it and at what premium?
- What's the average days-on-market for RENTAL listings here right now (not sales)? A rising rental-DOM trend means longer vacancies and softer asking-rent achievability than the comps imply.
- What's the recent tenant-quality profile in this submarket — average credit score on applications, eviction rate, late-payment / NSF rate, and stable-employment percentage? A property-management company in the area should have these aggregated.
- How much new for-sale + rental construction is in the pipeline within 1–3 miles? Heavy new supply typically softens prices + rents 12–24 months out; constrained supply supports both.
Investment metrics
- 1% rule
- 1.05% ✓
- Cap rate
- 7.37%
- Cash-on-cash
- 3.86%
- DSCR
- 1.17
- GRM
- 8.0
CMA / ARV
- ARV (on-the-fly)
- $185,344
- Comps found
- 3
Show comp detail 3 sales within ~0.75 mi
| Address | Dist | Beds/Ba | Sqft | Sold | Price | $/sf | Match |
|---|---|---|---|---|---|---|---|
| 5616 Fernpark Ave | 0.03mi | 3/1.5 | 1,024 (0%) | 2mo | $190,000 | $186 | 95 |
| 3710 Bowers Ave | 0.42mi | 3/1.5 | 1,080 (+6%) | 14mo | $195,000 | $181 | 58 |
| 5628 Groveland Ave | 0.68mi | 2/2.0 (-1) | 1,116 (+9%) | 20mo | $120,000 | $108 | 28 |
Match score weights: distance 35% · size 25% · config 20% · recency 20%. Top-matched comps best support the ARV.
Projected returns pro-forma
9.5% appreciation · 5.23% rent growth · sell at horizon
- IRR
- 27.0%
- Equity multiple
- 3.12×
- Total profit
- $95,969
- Equity at exit
- $140,066
- IRR
- 24.5%
- Equity multiple
- 7.23×
- Total profit
- $282,767
- Equity at exit
- $296,017
Cash invested: $45,360 (down + closing). Projections, not guarantees.
Landlord ↔ Tenant lean methodology
- Overall (CITY)
- 12 Strongly Tenant-Friendly
- State Maryland
- 27 Tenant-Leaning · D+14
- County
- — inherits STATE
- City Baltimore
- 12 Strongly Tenant-Friendly · D+58
ZIP-level market 21207
- Home prices YoY
- 1.1%
- Rents YoY
- 5.2%
- Active inventory
- 126
- Price-to-rent
- 8.0×
Monthly cashflow live
- Estimated rent
- $1,697 high interval (Pro) →
- Mortgage (P&I)
- −$850
- Tax from tax record
- −$278 /mo · $3,335/yr
- Insurance
- −$68
- HOA
- −$0
- Vacancy / Maint / Mgmt
- −$356
- Net cashflow
- $146
Break-even live
UW: 25.0% down · 7.5% · 30yr · 1.5% tax · 5.0% vac · 8.0% maint · 8.0% mgmt
Financing live
Cash to close
- Down payment
- $40,500
- Closing costs
- $4,860
- Reserves months
- —
- Total cash needed
- —
Loan-product check · same deal, 3 products live
Conventional
25% down · 7.5% · 30yr
- Down + closing
- —
- Monthly P&I
- —
- Monthly cashflow
- —
- DSCR
- —
- Eligible?
- —
Personal DTI + credit; lowest rate.
DSCR
20% down · 8.5% · 30yr
- Down + closing
- —
- Monthly P&I
- —
- Monthly cashflow
- —
- DSCR
- —
- Eligible?
- —
No personal income docs; deal must DSCR.
Hard money
10% down · 12.0% · 12mo
- Down + closing
- —
- Monthly P&I
- —
- Monthly cashflow
- —
- DSCR
- —
- Eligible?
- —
Short-term bridge; refi at stabilization.
Rent comps 28 comps
| Address | Beds | Baths | Sqft | Rent | $/sqft | DOM | Units | Dist |
|---|---|---|---|---|---|---|---|---|
| 3601 Parkview Ave Gwynn Oak, MD | 2.0 | 1.0 | 849 | $1,412 | $1.66 | 3d | 6 | 0.25mi |
| 5533 Gwynn Oak Ave Fl 1 Gwynn Oak, MD | 2.0 | 1.0 | 1080 | $1,600 | $1.48 | 43d | 1 | 0.39mi |
| 3807 Bowers Ave Gwynn Oak, MD | 3.0 | 1.5 | 1152 | $2,200 | $1.91 | 43d | 1 | 0.47mi |
| 6226 Robin Hill Rd Gwynn Oak, MD | 3.0 | 1.5 | 1140 | $2,850 | $2.50 | 16d | 1 | 0.53mi |
| 5009 Norwood Ave Gwynn Oak, MD | 2.0 | 1.0 | 800 | $1,150 | $1.44 | 43d | 1 | 0.60mi |
| 3601 Howard Park Ave Unit 2 Baltimore, MD | 3.0 | 1.0 | 1000 | $1,650 | $1.65 | 43d | 1 | 0.65mi |
| 3727 Milford Ave Gwynn Oak, MD | 3.0 | 1.0 | 900 | $1,450 | $1.61 | 43d | 1 | 0.67mi |
| 4016 N Rogers Ave Baltimore, MD | 2.0 | 1.0 | 717 | $1,195 | $1.67 | 43d | 1 | 0.68mi |
| 4998 W Forest Park Ave Baltimore, MD | 3.0 | 1.0–2.0 | 790 | $1,875 | $2.37 | 14d | 15 | 0.83mi |
| 3617 Mohawk Ave Baltimore, MD | 2.0 | 1.0 | 1000 | $1,595 | $1.59 | 43d | 1 | 0.97mi |
| 3615 Mohawk Ave Gwynn Oak, MD | 2.0 | 1.0 | 1000 | $1,610 | $1.61 | 43d | 1 | 0.97mi |
| 6463 Woodgreen Cir Gwynn Oak, MD | 3.0 | 2.5 | 1230 | $1,900 | $1.54 | 17d | 1 | 0.99mi |
| 2 Mountbatten Ct Gwynn Oak, MD | 3.0 | 2.0 | 1000 | $2,200 | $2.20 | 3d | 1 | 1.12mi |
| 6330 Windsor Mill Rd Woodlawn, MD | 3.0 | 1.0 | 1200 | $1,600 | $1.33 | 43d | 1 | 1.16mi |
| 4738 Wakefield Rd Baltimore, MD | 2.0 | 1.0 | 884 | $1,200 | $1.36 | 24d | 1 | 1.22mi |
| 3101 Windsor Blvd Gwynn Oak, MD | 1.0–2.0 | 1.0–2.0 | 843 | $1,755 | $2.08 | 1d | 55 | 1.23mi |
| 1 Janper Ct Baltimore, MD | 2.0 | 1.5 | 950 | $1,500 | $1.58 | 3d | 1 | 1.23mi |
| 1 Duke of Windsor Ct Gwynn Oak, MD | 1.0–3.0 | 1.0–2.0 | 775 | $1,984 | $2.56 | 3d | 20 | 1.24mi |
| 4309 Norfolk Ave Unit 1st Floor Baltimore, MD | 2.0 | 1.0 | 1470 | $1,500 | $1.02 | 11d | 1 | 1.30mi |
| 2008 Woodlawn Dr Woodlawn, MD | 1.0–2.0 | 1.0–2.0 | 685 | $1,719 | $2.51 | 3d | 14 | 1.31mi |
| 4010 Fernhill Ave Unit 2 Baltimore, MD | 2.0 | 1.0 | 1100 | $1,500 | $1.36 | 43d | 1 | 1.31mi |
| 6 Brubar Ct Gwynn Oak, MD | 3.0 | 2.0 | 1011 | $1,630 | $1.61 | 44d | 1 | 1.33mi |
| 6 Brubar Ct Gwynn Oak, MD | 2.0 | 2.0 | 887 | $1,415 | $1.60 | 17d | 1 | 1.33mi |
| 3915 Liberty Heights Ave Gwynn Oak, MD | 1.0–2.0 | 1.0–2.0 | 680 | $1,345 | $1.98 | 12d | 5 | 1.39mi |
| 4515 Fairfax Rd Baltimore, MD | 2.0 | 1.0 | 700 | $1,250 | $1.79 | 24d | 1 | 1.43mi |
| 3908 Groveland Ave Apt F Baltimore, MD | 2.0 | 1.0 | 815 | $1,695 | $2.08 | 43d | 1 | 1.45mi |
| 3600 Garrison Blvd Apt T1 Baltimore, MD | 2.0 | 1.0 | 800 | $1,125 | $1.41 | 3d | 1 | 1.48mi |
| 3600 Garrison Blvd Unit T2 Baltimore, MD | 2.0 | 1.0 | 750 | $1,149 | $1.53 | 24d | 1 | 1.48mi |
Listing history 5 events
-
2026-02-24status Pending
-
2026-01-15$162,000 Active
-
2025-11-10historical
-
2025-06-02historical
-
2021-08-20soldstatus $364,000
ⓘ Source: listings_history table (triggers on properties + properties_extension) + one-shot
backfill from property_details.listing_events for pre-trigger history.
Tax reassessment forecast MD · Partial reset (capped growth)
- Current annual tax
- $3,335 · $278/mo
- Projected year-2 tax
- $3,335 · $278/mo
- Expected delta
- $0/yr ($0/mo · 0.0%)
ⓘ Screening estimate from a state-policy table — verify with the county assessor before closing.
Climate risk First Street
- Flood 1/10 Low FEMA zone X (unshaded) · 0% chance over 30 yrs
- Wildfire 1/10 Low
- Heat 6/10 Major 7 d/yr ≥103°F today · 15 d/yr by 30 yrs out
- Wind 4/10 Moderate 21% chance of damaging wind over 30 yrs
- Air quality 3/10 Moderate 3 unhealthy d/yr today · 4 by 30 yrs out
Nearby sold comps map
Loading sold comps map…
Walkable amenities ~0.75 mi
Loading nearby amenities…
Taxation est. · year 1
- Rental income
- $20,369
- − Mortgage interest
- −$9,075
- − Property taxes
- −$3,335
- − Insurance
- −$810
- − Repairs & maintenance
- −$1,630
- − Management
- −$1,630
- − Depreciation
- −$4,713
- Taxable loss
- −$822
- Est. tax savings @ 24.0%
- +$197
- After-tax cash flow
- $1,949/yr
For passive investors: Depreciation is non-cash, so a rental often shows a tax loss while cash-flowing — sheltering income. Rental losses are passive: they offset passive income freely, and up to $25,000/yr can offset ordinary (W-2) income if you actively participate and your MAGI is under $100k (phasing out to $0 by $150k); unused losses carry forward. On sale, claimed depreciation is recaptured at up to 25%, and gains may owe capital-gains tax (a 1031 exchange can defer both). Figures are a year-1 estimate at your 24.0% rate — not tax advice; consult a CPA.
Schools (NCES district)
- District
- Baltimore City Public Schools
- NCES district ID
- 2400090
- Math proficiency
- 7% ▼ -9.00%
- Reading proficiency
- 16% ▼ -5.00%
- Median HH income
- $42,108
- Composite
- 10.08/100
- National rank
- #9805
- State rank
- #24 of 24 in MD
Livability — Baltimore
- Score
- 76/100
- State rank
- #90
- US rank
- #3396
Category grades
Schools grade is shown separately in the Schools card above.
Census & demographics
- Census place
- Baltimore, MD
- County
- Baltimore County · 769,527 people
- City population
- 588,727
- Metro
- Baltimore-Columbia-Towson, MD
- Population (ZIP)
- 47,099
- Household income
- $67,060
- Rent vs Own
- Severe rent burden
- 2139.0
Population outlook (Baltimore County) Hauer SSP2
- Today (2025)
- 624,249 people
- By 2030
- 621,541 · -0.4%
- By 2040
- 609,756 · -2.3%
- By 2050
- 597,249 · -4.3%
- By 2075
- 552,236 · -11.5%
- By 2100
- 513,934 · -17.7%
Race, ethnicity, and origin ACS 2023
- Neighborhood character
- Predominantly Black (78%)
- Race & ethnicity
- Black 78% White 8% Hispanic / Latino 7% Two or more races 5% Asian 3%
- Hispanic origin (detail)
- Puerto Rican 1%
- Common ancestry
- Swedish 1%
- Foreign-born
- 13% · Canada, Philippines, South Korea
- Languages at home
- 86% English-only · Spanish 4% French/Haitian/Cajun 1% Other Asian/Pacific 1%
Political lean MEDSL · Baltimore
- 2024 margin
- Solid D (+73.0) · D 85.2% · R 12.2% · Other 2.6%
- 2008→2024 swing
- -2.5pp toward R · 2008: 75.5pp · 2024: 73.0pp
- All cycles
- 2024: D+73.0 2020: D+76.6 2016: D+74.6 2012: D+76.4 2008: D+75.5
Not yet ingested
- Civics
- —
Market trends
- HPI YoY
- ▲ 9.50%
- Current HPI
- 843.63
- Rent YoY
- ▲ 5.23%
- Metro
- Baltimore-Columbia-Towson, MD
- State GDP YoY
- ▲ 2.97%
- F500 in state
- 12
Industry mix (Fortune 500 HQ in MD)
| Industry | F500 HQs | Revenue |
|---|---|---|
| Aerospace / Defense | 1 | $71B |
|
||
| Utilities | 1 | $25B |
|
||
| Hotels | 1 | $24B |
|
||
| Consumer Goods | 1 | $7B |
|
||
| Real Estate | 1 | $6B |
|
||
| Chemicals | 1 | $2B |
|
||
Price history
-55.5% since first listed5 events — show timeline
- 2026-02-24 Pending — BRIGHT MLS
- 2026-01-15 Listed $162,000 BRIGHT MLS
- 2025-11-10 Listing Removed — BRIGHT MLS
- 2025-06-02 Coming Soon — BRIGHT MLS
- 2021-08-20 Sold (Public Records) $364,000 Public Records
Property tax history
+1.8%/yrLatest (2025): $3,335 · +20.1% YoY. Source: county tax records.
Cash-flow waterfall
monthlySold comps — $/sqft
last 12 mo · ≤1 miLoading sold comps…