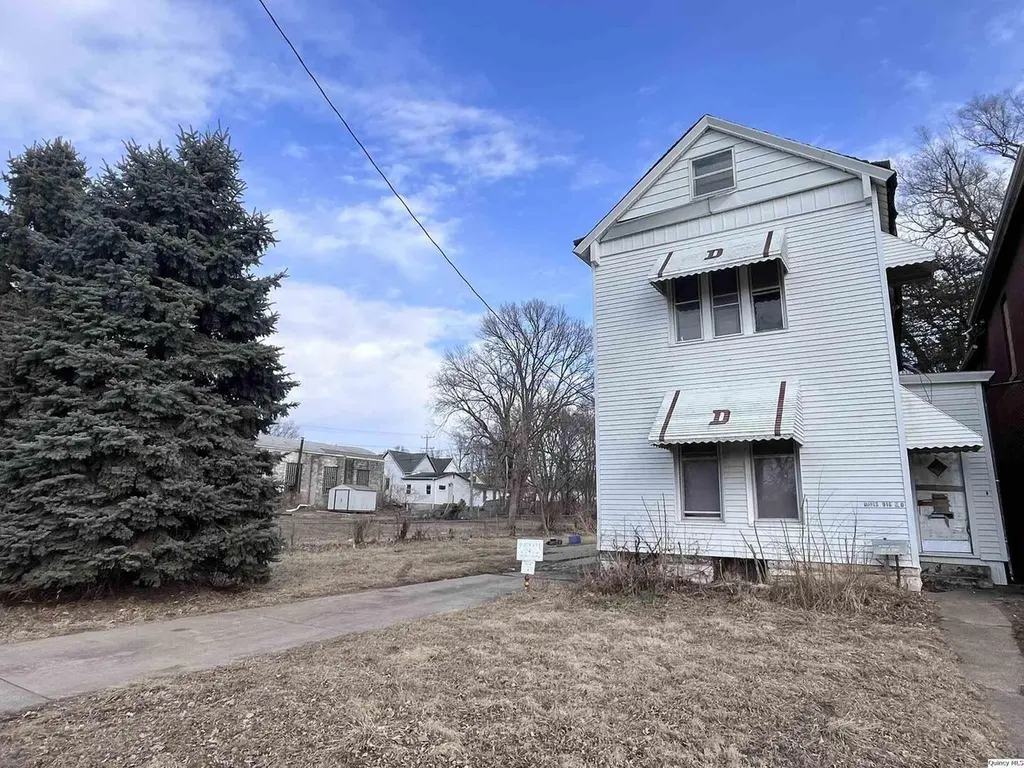
916 & 922 N 8th St · Quincy, IL
Flood risk 4/10 · Minor
- FEMA flood zone
- X (unshaded)
- Chance of flooding over 30 yrs
- 0.2%
- Est. flood insurance / yr
- $473 – $860
Fire risk 1/10 · Minimal
- Est. fire insurance / yr
- $804 – $1,492
Heat risk 3/10 · Minor
- Hot days now (above 107°F)
- 7 days/yr
- Hot days in 30 yrs
- 17 days/yr
Wind risk 2/10 · Minimal
- Chance of severe wind over 30 yrs
- —
Air-quality risk 2/10 · Minimal
- Unhealthy air days now
- 1 days/yr
- Unhealthy air days in 30 yrs
- 1 days/yr
Risk factors via First Street. Map © Google.
Why this score? — see what drove the D+ grade
The composite is a weighted blend of 9 inputs, each scored 0–100. Each bar is that input's sub-score; the figure is the points it added to the 100-point composite (weight × sub-score).
- Cash flow +15.0/30.0
- ARV discount +7.5/15.0
- 1% rule +5.0/10.0
- DSCR +5.0/10.0
- Rent growth +5.0/5.0
- Livability +3.4/5.0
- Condition / age +2.5/5.0
- Schools +2.2/10.0
- Appreciation +0.0/10.0
$27,500
🖨 Deal sheet (PDF) 📄 Offer letter ✓ Due diligence
Listing remarks MLS
Attention Investors & Flippers: Dual Property Opportunity! Here's a chance to snag two properties with tons of potential! First property at 916 N. 8th St. is a 2,022 sq. ft. two-story home with a 24x42 two-car detached garage. Home needs work, but that means opportunity! Everything inside home conveys to the new owner, home will not be cleaned out prior to closing. Water heater is disconnected. Furnace is inoperable. Second property at 922 N. 8th St. is a vacant lot with an oversized one-car garage with workshop, lot size is 46.5x224 and Parcel# is 23-5-0937-000-00. If you're looking for your next project, this is it! Build, develop, or renovate - your call! Properties being sold "As-Is".
Key facts
- 0.39 acre lot
- 3 garage spots
- Built 1897
Neighborhood map
What this means for you Summary
Snapshot
- This is a 3-bed/1.5-bath single-family listed at $28k.
Deal economics
- At list price, monthly cash flow is $2k ($19k/yr) — positive.
- The deal already cash-flows at list — no discount required.
- Meets the 1% rule at list price ($2k rent vs $28k).
- Recommended offer: $24k (12.0% below list) — sets the bar for market timing.
- Cap rate 75.4% vs local median 4.3% in Quincy — top-decile yield for the area; either an underpriced asset or a hidden risk that comps aren't pricing in. Stress-test before assuming the spread holds.
Location & tenants
- Location reads 67/100 on livability (#506 in IL) — a middle-class / working-renter tenant base. Strengths: cost of living A+, housing A+; Watch: crime D, employment D, amenities D-.
- Quincy SD 172 (town): math 24% / reading 27% proficiency, ranked #328 of 620 in IL (top 53%) — low school quality limits family demand, transient renter base, plan for 1-2y turnover.
- Zoned schools: Dr. Abby Fox Rooney Elem Sch (math 25% / reading 25%, grade F, #842 of 2,056 statewide, top 41%, 496 students, 0% FRL); Quincy Jr High School (math 25% / reading 30%, grade F, #295 of 665 statewide, top 45%, 1,348 students, 0% FRL); Quincy Sr High School (math 21% / reading 28%, grade F, #256 of 693 statewide, top 44%, 1,924 students, 0% FRL) — zoned schools average 0% FRL vs 48% district-wide (48 pts lower); this property's tenant base skews higher-income than the district average.
- Market conditions: Rents rising fast (+10.8%/yr); 180 active listings in the ZIP; 2 comparable units currently listed for rent nearby; 68 units permitted in Adams County in 2024 (0 in 5+ unit buildings).
- At $2,218/mo this rent would consume 51% of the median local household income ($52k/yr) (locally 1238% of renters already pay >50% of income on rent) — very limited rent-growth headroom before tenants either downsize or default.
Forward outlook
- Local home prices are declining (-3.0%/yr); year-one equity from $190 of loan paydown is wiped out by about $825 of value loss. Plan a longer hold.
- Adams County population projected at -14% by 2050 — secular population decline; favor cash flow + early exit over multi-decade hold.
- At projected returns (-3.0% appreciation + 8.0% rent growth), your $8k cash investment doubles in ~1 year — after that, you're playing with house money.
Negotiation context
- It's been on market 123 days — a 12% lower offer ($24k) is reasonable based on typical stale-listing flexibility.
Risks & watch-outs
- Watch-outs: built in 1897 — expect roof / HVAC / electrical / plumbing capex.
Questions for the listing agent
- It's been on market 123 days. Have you received any prior offers? Is the seller open to a 12% concession, seller financing, or rate buy-down credit?
- Built in 1897 — when were the roof, HVAC, electrical panel, plumbing, and water heater last replaced?
- Why hasn't it sold? Are there any deal-killer items the seller is aware of (foundation, flood, title, zoning, code violations)?
- Is there a deadline driving the sale (1031 exchange, divorce, estate, relocation)? That informs how much negotiation room exists.
- Schools are D-rated, which usually means shorter tenancies and higher turnover. Who's the typical renter profile here, and what's been the actual vacancy rate?
- Crime grade is D in this area — have there been break-ins, vandalism, or insurance claims at this property in the last 3 years? What carrier currently insures it and at what premium?
- The area grade is low — what's the realistic commute time and amenity access for the typical tenant pool here? Any planned neighborhood developments (good or bad) we should know about?
- What's the average days-on-market for RENTAL listings here right now (not sales)? A rising rental-DOM trend means longer vacancies and softer asking-rent achievability than the comps imply.
- What's the recent tenant-quality profile in this submarket — average credit score on applications, eviction rate, late-payment / NSF rate, and stable-employment percentage? A property-management company in the area should have these aggregated.
- How much new for-sale + rental construction is in the pipeline within 1–3 miles? Heavy new supply typically softens prices + rents 12–24 months out; constrained supply supports both.
Investment metrics
- 1% rule
- 8.07% ✓
- Cap rate
- 75.44%
- Cash-on-cash
- 246.95%
- DSCR
- 11.99
- GRM
- 1.0
CMA / ARV
- ARV (median comp)
- $98,269
- List price
- $27,500
- Delta
- -72.02%
- Verdict
- UNDERPRICED
- Comps
- 20 within 1.0 mi
Show comp detail 12 sales within ~0.75 mi
| Address | Dist | Beds/Ba | Sqft | Sold | Price | $/sf | Match |
|---|---|---|---|---|---|---|---|
| 1120 N 8th St | 0.18mi | 4/1.5 (+1) | 2,051 (+1%) | 10mo | $42,000 | $20 | 76 |
| 1330 N 6th St | 0.41mi | 3/2.0 | 1,908 (-6%) | 0mo | $132,000 | $69 | 69 |
| 710 N 12th St | 0.41mi | 3/1.5 | 2,203 (+9%) | 10mo | $49,000 | $22 | 58 |
| 1026 N 15th St | 0.60mi | 2/2.0 (-1) | 1,992 (-2%) | 7mo | $162,000 | $81 | 56 |
| 832 N 11th St | 0.27mi | 2/1.5 (-1) | 1,780 (-12%) | 8mo | $85,000 | $48 | 56 |
| 703 N 13th St | 0.45mi | 3/2.0 | 2,180 (+8%) | 11mo | $106,000 | $49 | 54 |
| 1421 N 7th St | 0.47mi | 3/2.0 | 1,795 (-11%) | 7mo | $124,600 | $69 | 52 |
| 1321 Locust St | 0.74mi | 3/2.0 | 1,980 (-2%) | 12mo | $174,100 | $88 | 50 |
| 325 Cherry St | 0.41mi | 2/1.0 (-1) | 1,734 (-14%) | 0mo | $15,000 | $9 | 50 |
| 1513 Spruce St | 0.71mi | 3/2.0 | 1,850 (-8%) | 2mo | $62,000 | $34 | 50 |
| 615 N 8th | 0.26mi | 4/2.0 (+1) | 1,735 (-14%) | 11mo | $14,500 | $8 | 48 |
| 1319 N 12th St | 0.48mi | 2/1.0 (-1) | 1,766 (-13%) | 9mo | $115,000 | $65 | 42 |
Match score weights: distance 35% · size 25% · config 20% · recency 20%. Top-matched comps best support the ARV.
Projected returns pro-forma
-3.0% appreciation · 8.0% rent growth · sell at horizon
- IRR
- —
- Equity multiple
- 15.05×
- Total profit
- $108,211
- Equity at exit
- $4,100
- IRR
- —
- Equity multiple
- 37.05×
- Total profit
- $277,621
- Equity at exit
- $2,378
Cash invested: $7,700 (down + closing). Projections, not guarantees.
Landlord ↔ Tenant lean methodology
- Overall (STATE)
- 43 Moderately Tenant-Leaning
- State Illinois
- 43 Moderately Tenant-Leaning · D+7
- County
- — inherits STATE
- City
- — inherits STATE
ZIP-level market 62301
- Rents YoY
- 10.8%
- Active inventory
- 180
- Price-to-rent
- 1.0×
Monthly cashflow live
- Estimated rent
- $2,218 medium interval (Pro) →
- Mortgage (P&I)
- −$144
- Tax from tax record
- −$12 /mo · $146/yr
- Insurance
- −$11
- HOA
- −$0
- Vacancy / Maint / Mgmt
- −$466
- Net cashflow
- $1,585
Break-even live
Sensitivity live
| Price | -10% $1,600 | -5% $1,592 | +0% $1,585 | +5% $1,577 | +10% $1,569 |
|---|---|---|---|---|---|
| Rent | -10% $1,409 | -5% $1,497 | +0% $1,585 | +5% $1,672 | +10% $1,760 |
| Rate | -1.0pp $1,598 | -0.5pp $1,592 | base $1,585 | +0.5pp $1,577 | +1.0pp $1,570 |
UW: 25.0% down · 7.5% · 30yr · 1.5% tax · 5.0% vac · 8.0% maint · 8.0% mgmt
Financing live
Cash to close
- Down payment
- $6,875
- Closing costs
- $825
- Reserves months
- —
- Total cash needed
- —
Loan-product check · same deal, 3 products live
Conventional
25% down · 7.5% · 30yr
- Down + closing
- —
- Monthly P&I
- —
- Monthly cashflow
- —
- DSCR
- —
- Eligible?
- —
Personal DTI + credit; lowest rate.
DSCR
20% down · 8.5% · 30yr
- Down + closing
- —
- Monthly P&I
- —
- Monthly cashflow
- —
- DSCR
- —
- Eligible?
- —
No personal income docs; deal must DSCR.
Hard money
10% down · 12.0% · 12mo
- Down + closing
- —
- Monthly P&I
- —
- Monthly cashflow
- —
- DSCR
- —
- Eligible?
- —
Short-term bridge; refi at stabilization.
Rent comps 2 comps
| Address | Beds | Baths | Sqft | Rent | $/sqft | DOM | Units | Dist |
|---|---|---|---|---|---|---|---|---|
| 201 S 8th St Quincy, IL | 2.0 | 2.5 | 1785 | $1,800 | $1.01 | 45d | 1 | 0.79mi |
| 116 N 3rd St Quincy, IL | 1.0–4.0 | 1.0–2.0 | 1950 | $4,333 | $2.22 | 45d | 12 | 0.79mi |
Listing history 17 events
-
2026-06-19days on market $27,500 Active 123 DOM
-
2026-06-18days on market $27,500 Active 122 DOM
-
2026-06-17days on market $27,500 Active 121 DOM
-
2026-06-16days on market $27,500 Active 120 DOM
-
2026-06-15days on market $27,500 Active 119 DOM
-
2026-06-14days on market $27,500 Active 117 DOM
-
2026-06-12days on market $27,500 Active 116 DOM
-
2026-06-09days on market $27,500 Active 113 DOM
-
2026-06-08days on market $27,500 Active 112 DOM
-
2026-06-07days on market $27,500 Active 111 DOM
-
2026-06-03days on market $27,500 Active 107 DOM
-
2026-06-02days on market $27,500 Active 106 DOM
-
2026-06-01days on market $27,500 Active 105 DOM
-
2026-05-31days on market $27,500 Active 104 DOM
-
2026-05-30days on market $27,500 Active 103 DOM
-
2026-03-11price $29,900 711-char remark
Show marketing remark (711 chars)
Attention Investors & Flippers: Dual Property Opportunity! Here's a chance to snag two properties with tons of potential! First property at 916 N. 8th St. is a 2,022 sq. ft. two-story home with a 24x42 two-car detached garage. Home needs work, but that means opportunity! Everything inside home conveys to the new owner, home will not be cleaned out prior to closing. Water heater is disconnected. Furnace is inoperable. Second property at 922 N. 8th St. is a vacant lot with an oversized one-car garage with workshop, lot size is 46.5x224 and Parcel# is 23-5-0937-000-00. If you're looking for your next project, this is it! Build, develop, or renovate - your call! Properties being sold "As-Is".
-
2026-02-12$35,000 Active 711-char remark
Show marketing remark (711 chars)
Attention Investors & Flippers: Dual Property Opportunity! Here's a chance to snag two properties with tons of potential! First property at 916 N. 8th St. is a 2,022 sq. ft. two-story home with a 24x42 two-car detached garage. Home needs work, but that means opportunity! Everything inside home conveys to the new owner, home will not be cleaned out prior to closing. Water heater is disconnected. Furnace is inoperable. Second property at 922 N. 8th St. is a vacant lot with an oversized one-car garage with workshop, lot size is 46.5x224 and Parcel# is 23-5-0937-000-00. If you're looking for your next project, this is it! Build, develop, or renovate - your call! Properties being sold "As-Is".
ⓘ Source: listings_history table (triggers on properties + properties_extension) + one-shot
backfill from property_details.listing_events for pre-trigger history.
Tax reassessment forecast IL · Partial reset (capped growth)
- Current annual tax
- $146 · $12/mo
- Projected year-2 tax
- $385 · $32/mo
- Expected delta
- +$239/yr (+$20/mo · 164.4%)
ⓘ Screening estimate from a state-policy table — verify with the county assessor before closing.
Climate risk First Street
- Flood 4/10 Moderate FEMA zone X (unshaded) · 20% chance over 30 yrs
- Wildfire 1/10 Low
- Heat 3/10 Moderate 7 d/yr ≥107°F today · 17 d/yr by 30 yrs out
- Wind 2/10 Low
- Air quality 2/10 Low 1 unhealthy d/yr today · 1 by 30 yrs out
Nearby sold comps map
Loading sold comps map…
Walkable amenities ~0.75 mi
Loading nearby amenities…
Taxation est. · year 1
- Rental income
- $26,619
- − Mortgage interest
- −$1,540
- − Property taxes
- −$146
- − Insurance
- −$138
- − Repairs & maintenance
- −$2,130
- − Management
- −$2,130
- − Depreciation
- −$800
- Taxable income
- $19,736
- Est. tax owed @ 24.0%
- −$4,737
- After-tax cash flow
- $14,279/yr
For passive investors: Depreciation is non-cash, so a rental often shows a tax loss while cash-flowing — sheltering income. Rental losses are passive: they offset passive income freely, and up to $25,000/yr can offset ordinary (W-2) income if you actively participate and your MAGI is under $100k (phasing out to $0 by $150k); unused losses carry forward. On sale, claimed depreciation is recaptured at up to 25%, and gains may owe capital-gains tax (a 1031 exchange can defer both). Figures are a year-1 estimate at your 24.0% rate — not tax advice; consult a CPA.
Schools (NCES district)
- District
- Quincy SD 172
- NCES district ID
- 1733000
- Math proficiency
- 24% ▬ 0.00%
- Reading proficiency
- 27% ▬ 0.00%
- Median HH income
- $44,132
- Composite
- 21.91/100
- National rank
- #8229
- State rank
- #328 of 620 in IL
Livability — Quincy
- Score
- 67/100
- State rank
- #506
- US rank
- #10458
Category grades
Schools grade is shown separately in the Schools card above.
Census & demographics
- Census place
- Quincy, IL
- County
- Adams County · 30,746 people
- City population
- 30,746
- Metro
- Quincy, IL-MO
- Population (ZIP)
- 30,746
- Household income
- $52,055
- Rent vs Own
- Severe rent burden
- 1238.0
Population outlook (Adams County) Hauer SSP2
- Today (2025)
- 65,795 people
- By 2030
- 64,436 · -2.1%
- By 2040
- 61,007 · -7.3%
- By 2050
- 56,851 · -13.6%
- By 2075
- 46,424 · -29.4%
- By 2100
- 34,305 · -47.9%
Race, ethnicity, and origin ACS 2023
- Neighborhood character
- Predominantly White (84%)
- Race & ethnicity
- White 84% Two or more races 7% Black 6% Hispanic / Latino 3% Asian 1%
- Common ancestry
- Slovak 2% Iranian 1% Lithuanian 1%
- Foreign-born
- 2% · Canada
- Languages at home
- 96% English-only · Spanish 2%
Political lean MEDSL · Adams
- 2024 margin
- Solid R (+47.4) · D 25.6% · R 73.0% · Other 1.5%
- 2008→2024 swing
- -25.0pp toward R · 2008: -22.4pp · 2024: -47.4pp
- All cycles
- 2024: R+47.4 2020: R+46.5 2016: R+47.5 2012: R+35.2 2008: R+22.4
Not yet ingested
- Civics
- —
Market trends
- HPI YoY
- ▼ -121.44%
- Current HPI
- 131.7344
- Rent YoY
- ▲ 10.78%
- Metro
- Quincy, IL-MO
- State GDP YoY
- ▲ 1.59%
- F500 in state
- 60
Industry mix (Fortune 500 HQ in IL)
| Industry | F500 HQs | Revenue |
|---|---|---|
| Insurance | 4 | $201B |
|
||
| Consumer Goods | 4 | $87B |
|
||
| Industrial Machinery | 3 | $64B |
|
||
| Healthcare | 2 | $55B |
|
||
| Retail / Pharmacy | 1 | $148B |
|
||
| Agriculture / Food | 1 | $86B |
|
||
Price history
-14.6% since first listed2 events — show timeline
- 2026-03-11 Price Changed $29,900 MRED as Distributed by MLS Grid
- 2026-02-12 Listed $35,000 MRED as Distributed by MLS Grid
Property tax history
-11.7%/yrLatest (2023): $146 · +5.4% YoY. Source: county tax records.
Cash-flow waterfall
monthlySold comps — $/sqft
last 12 mo · ≤1 miLoading sold comps…