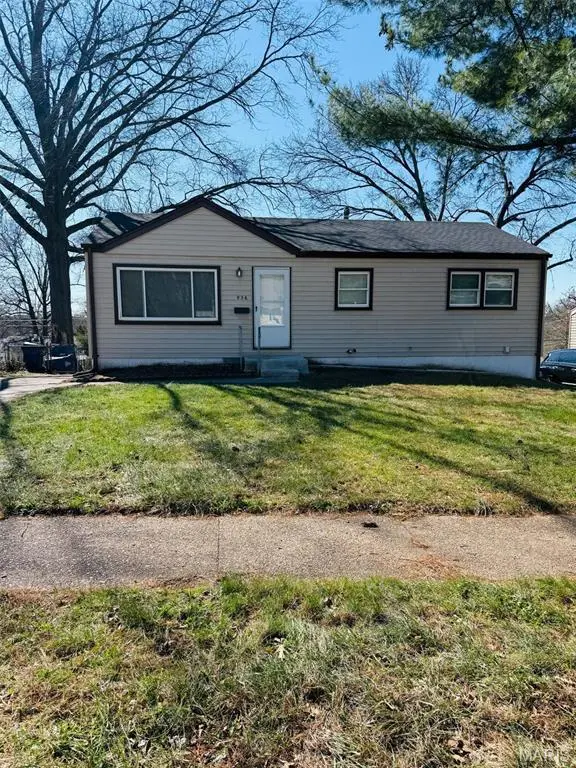
936 Highmont · Ferguson, MO
Flood risk 1/10 · Minimal
- FEMA flood zone
- X (unshaded)
- Chance of flooding over 30 yrs
- 0.0%
- Est. flood insurance / yr
- $473 – $860
Fire risk 1/10 · Minimal
- Est. fire insurance / yr
- $1,054 – $1,958
Heat risk 5/10 · Moderate
- Hot days now (above 106°F)
- 7 days/yr
- Hot days in 30 yrs
- 21 days/yr
Wind risk 2/10 · Minimal
- Chance of severe wind over 30 yrs
- 1.0%
Air-quality risk 4/10 · Minor
- Unhealthy air days now
- 4 days/yr
- Unhealthy air days in 30 yrs
- 5 days/yr
Risk factors via First Street. Map © Google.
Why this score? — see what drove the C- grade
The composite is a weighted blend of 9 inputs, each scored 0–100. Each bar is that input's sub-score; the figure is the points it added to the 100-point composite (weight × sub-score).
- Cash flow +26.1/30.0
- DSCR +8.8/10.0
- 1% rule +6.2/10.0
- Rent growth +4.8/5.0
- Livability +2.9/5.0
- Condition / age +2.5/5.0
- Schools +1.2/10.0
- ARV discount +0.0/15.0
- Appreciation +0.0/10.0
$124,900
🖨 Deal sheet 📄 Offer letter ✓ Due diligence
Listing remarks
Warning, you may fall in love at first sight! This adorable 3 bedroom home has been updated from top to bottom and is ready to impress! From the fully remodeled kitchen and bathroom to the warm hardwood floors and sleek luxury vinyl plank, every corner has been given a fresh new glow-up. The living room brings the charm with exposed faux beams, while the dining space off the kitchen makes everyday meals feel just a little more special. Need extra room? The partially finished walk-out basement comes with a bonus sleeping room, making it the perfect hideaway for guests, hobbies, or your next movie-night lounge. Cute, cozy, and packed with personality. .. This one is ready to steal the spotlig
Key facts
- Remodeled bathroom
- Luxury vinyl plank
- Warm hardwood floors
Tags
Property features AI
Finance
- Other: Lot dimensions approximately 60 x 125 ft
- Financial info: Lease not considered; No second mortgage indicated
Exterior
- Parking: Off-street parking
- Utilities: Public water; Public sewer; Electricity connected (Ameren); Natural gas connected
- Home design: Single-family residence; One story
- Construction: Vinyl siding; Built prior to or listed in public records; Basement (full)
- Exterior features: Back yard; Front yard; Chain link fencing
Interior
- Kitchen: Dishwasher; Free-standing gas range; Refrigerator
- Bedrooms: Three bedrooms on the main level
- Flooring: Hardwood
- Bathrooms: One full bathroom on the main level
- Heating & cooling: Forced-air heating (natural gas); Central air conditioning (electric)
- Interior features: Dishwasher; Free-standing gas range; Refrigerator; Gas water heater; Hardwood floors; Basement with concrete construction, partially finished areas and a sleeping area, interior entry and walk-out access
- Laundry & utility: Laundry in basement
Neighborhood map
What this means for you Summary
Snapshot
- This is a 3-bed/1.0-bath single-family listed at $125k.
Deal economics
- At list price, monthly cash flow is $314 ($4k/yr) — positive.
- The deal already cash-flows at list — no discount required.
- Meets the 1% rule at list price ($1k rent vs $125k).
Location & tenants
- Location reads 58/100 on livability (#586 in MO) — a working-class tenant base; expect higher turnover. Strengths: cost of living A+, housing B+; Watch: health & safety C-, crime F, amenities F.
- Ferguson-Florissant R-II (suburban): math 7% / reading 20% proficiency, ranked #311 of 324 in MO (top 96%) — low school quality limits family demand, transient renter base, plan for 1-2y turnover; 70% free/reduced lunch — lower-income household profile, screen leases tightly.
- Zoned schools: Griffith Elementary (math 3% / reading 9%, grade F, #1,069 of 1,115 statewide, top 96%, 282 students, 99% FRL); Mccluer High (math 0% / reading 17%, grade F, #511 of 521 statewide, top 98%, 1,181 students, 100% FRL) — zoned schools average 99% FRL vs 70% district-wide (30 pts higher); higher-poverty schools than district average — tighter screening recommended.
- Market conditions: Rents rising fast (+9.0%/yr); 162 active listings in the ZIP; 40 comparable units currently listed for rent nearby; rentals lingering (median 44d on market — plan ~5-8 weeks vacancy on turnover, expect pricing pressure); 58% of comp listings sitting > 30 days — soft ceiling on asking rent; 920 units permitted in St. Louis County in 2024 (250 in 5+ unit buildings).
- This rent runs 32% of the median local income ($52k/yr) — at the standard rent-burdened threshold; future hikes will face affordability resistance.
Forward outlook
- Local home prices are declining (-3.0%/yr); year-one equity from $864 of loan paydown is wiped out by about $4k of value loss. Plan a longer hold.
- At projected returns (-3.0% appreciation + 8.0% rent growth), your $35k cash investment doubles in ~8 years — after that, you're playing with house money.
Negotiation context
- Only 2 days on market — expect competitive offers; lowballing is unlikely to land.
- 4 sale attempts with the ask held roughly flat each time — persistent listings suggest the price (not the market) is what's stuck; bring a comps-based counter.
- Current owner paid $28k; list at $125k implies a 346% gain — meaningful room to come down on a strong offer.
Risks & watch-outs
- Watch-outs: built in 1953 — expect roof / HVAC / electrical / plumbing capex.
- Climate carrying-cost: extreme-heat days projected 7→21/yr by 2055 (HVAC capex compounding) — expect insurance premiums to compound above CPI over the hold.
Questions for the listing agent
- Built in 1953 — when were the roof, HVAC, electrical panel, plumbing, and water heater last replaced?
- Is there a deadline driving the sale (1031 exchange, divorce, estate, relocation)? That informs how much negotiation room exists.
- Schools are F-rated, which usually means shorter tenancies and higher turnover. Who's the typical renter profile here, and what's been the actual vacancy rate?
- Crime grade is F in this area — have there been break-ins, vandalism, or insurance claims at this property in the last 3 years? What carrier currently insures it and at what premium?
- What's the average days-on-market for RENTAL listings here right now (not sales)? A rising rental-DOM trend means longer vacancies and softer asking-rent achievability than the comps imply.
- What's the recent tenant-quality profile in this submarket — average credit score on applications, eviction rate, late-payment / NSF rate, and stable-employment percentage? A property-management company in the area should have these aggregated.
- How much new for-sale + rental construction is in the pipeline within 1–3 miles? Heavy new supply typically softens prices + rents 12–24 months out; constrained supply supports both.
Investment metrics
- 1% rule
- 1.12% ✓
- Cap rate
- 9.31%
- Cash-on-cash
- 10.78%
- DSCR
- 1.48
- GRM
- 7.4
CMA / ARV
- ARV (on-the-fly)
- $87,360
- Comps found
- 12
Show comp detail 12 sales within ~0.75 mi
| Address | Dist | Beds/Ba | Sqft | Sold | Price | $/sf | Match |
|---|---|---|---|---|---|---|---|
| 227 Meadowcrest Dr | 0.09mi | 3/1.0 | 960 (0%) | 3mo | $129,900 | $135 | 93 |
| 277 Dashwood Dr | 0.21mi | 3/1.0 | 960 (0%) | 2mo | $74,900 | $78 | 89 |
| 296 Meadowcrest Dr | 0.24mi | 3/1.0 | 960 (0%) | 2mo | $109,900 | $114 | 87 |
| 247 S Hartnett Ave Unit 1/2 | 0.17mi | 2/1.0 (-1) | 902 (-6%) | 2mo | $75,000 | $83 | 76 |
| 125 Forestwood Dr | 0.27mi | 3/1.0 | 1,032 (+8%) | 3mo | $77,900 | $75 | 72 |
| 941 Highmont Dr | 0.03mi | 2/1.0 (-1) | 840 (-12%) | 3mo | $105,900 | $126 | 70 |
| 914 Highmont Dr | 0.05mi | 2/1.0 (-1) | 816 (-15%) | 1mo | $92,400 | $113 | 66 |
| 100 Florwood Ct | 0.53mi | 3/1.0 | 1,004 (+5%) | 3mo | $79,900 | $80 | 65 |
| 610 Superior Dr | 0.72mi | 3/1.0 | 900 (-6%) | 3mo | $139,000 | $154 | 54 |
| 324 Gage Dr | 0.66mi | 2/1.0 (-1) | 875 (-9%) | 1mo | $68,000 | $78 | 49 |
| 35 Lee Ave | 0.62mi | 2/1.0 (-1) | 1,066 (+11%) | 2mo | $65,000 | $61 | 46 |
| 4 S Dellwood Ave | 0.57mi | 2/1.0 (-1) | 1,086 (+13%) | 2mo | $98,900 | $91 | 45 |
Match score weights: distance 35% · size 25% · config 20% · recency 20%. Top-matched comps best support the ARV.
Projected returns pro-forma
-3.0% appreciation · 8.0% rent growth · sell at horizon
- IRR
- 5.0%
- Equity multiple
- 1.20×
- Total profit
- $7,163
- Equity at exit
- $18,623
- IRR
- 18.4%
- Equity multiple
- 2.88×
- Total profit
- $65,674
- Equity at exit
- $10,799
Cash invested: $34,972 (down + closing). Projections, not guarantees.
Landlord ↔ Tenant lean methodology
- Overall (STATE)
- 81 Strongly Landlord-Friendly
- State Missouri
- 81 Strongly Landlord-Friendly · R+10
- County
- — inherits STATE
- City
- — inherits STATE
ZIP-level market 63135
- Rents YoY
- 9.0%
- Active inventory
- 162
- Price-to-rent
- 7.4×
Monthly cashflow live
- Estimated rent
- $1,404 high interval (Pro) →
- Mortgage (P&I)
- −$655
- Tax from tax record
- −$88 /mo · $1,053/yr
- Insurance
- −$52
- HOA
- −$0
- Vacancy / Maint / Mgmt
- −$295
- Net cashflow
- $314
Break-even live
UW: 25.0% down · 7.5% · 30yr · 1.5% tax · 5.0% vac · 8.0% maint · 8.0% mgmt
Financing live
Cash to close
- Down payment
- $31,225
- Closing costs
- $3,747
- Reserves months
- —
- Total cash needed
- —
Loan-product check · same deal, 3 products live
Conventional
25% down · 7.5% · 30yr
- Down + closing
- —
- Monthly P&I
- —
- Monthly cashflow
- —
- DSCR
- —
- Eligible?
- —
Personal DTI + credit; lowest rate.
DSCR
20% down · 8.5% · 30yr
- Down + closing
- —
- Monthly P&I
- —
- Monthly cashflow
- —
- DSCR
- —
- Eligible?
- —
No personal income docs; deal must DSCR.
Hard money
10% down · 12.0% · 12mo
- Down + closing
- —
- Monthly P&I
- —
- Monthly cashflow
- —
- DSCR
- —
- Eligible?
- —
Short-term bridge; refi at stabilization.
Rent comps 40 comps
| Address | Beds | Baths | Sqft | Rent | $/sqft | DOM | Units | Dist |
|---|---|---|---|---|---|---|---|---|
| 227 Meadowcrest Dr Saint Louis, MO | 3.0 | 1.0 | 960 | $1,500 | $1.56 | 43d | 1 | 0.06mi |
| 945 Edgehill Dr Saint Louis, MO | 3.0 | 1.0 | 1110 | $1,575 | $1.42 | 43d | 1 | 0.10mi |
| 249 S Hartnett Ave Saint Louis, MO | 3.0 | 1.0 | 960 | $1,220 | $1.27 | 23d | 1 | 0.16mi |
| 296 Meadowcrest Dr Saint Louis, MO | 3.0 | 1.0 | 960 | $1,550 | $1.61 | 14d | 1 | 0.22mi |
| 104 Fenwick Dr Saint Louis, MO | 3.0 | 1.0 | 960 | $1,250 | $1.30 | 23d | 1 | 0.24mi |
| 307 Coppinger Dr Saint Louis, MO | 3.0 | 1.0 | 960 | $1,095 | $1.14 | 17d | 1 | 0.52mi |
| 338 La Motte Ln Saint Louis, MO | 2.0 | 1.0 | 904 | $1,150 | $1.27 | 43d | 1 | 0.58mi |
| 110 Paul Ave Saint Louis, MO | 3.0 | 1.0 | 875 | $1,050 | $1.20 | 7d | 1 | 0.59mi |
| 502 Averill Ave Saint Louis, MO | 2.0 | 1.0 | 840 | $1,250 | $1.49 | 43d | 1 | 0.62mi |
| 6180 Emerald Ave Saint Louis, MO | 2.0 | 1.0 | 729 | $1,300 | $1.78 | 43d | 1 | 0.63mi |
| 415 Ames Pl Saint Louis, MO | 3.0 | 1.0 | 816 | $1,400 | $1.72 | 43d | 1 | 0.64mi |
| 6188 Dupree Ave Saint Louis, MO | 3.0 | 1.5 | 972 | $1,300 | $1.34 | 43d | 1 | 0.66mi |
| 401 Millman Dr Saint Louis, MO | 3.0 | 1.0 | 1008 | $1,450 | $1.44 | 16d | 1 | 0.69mi |
| 12 Lee Ave Saint Louis, MO | 2.0 | 1.0 | 832 | $1,080 | $1.30 | 7d | 1 | 0.69mi |
| 419 S Florissant Rd Ferguson, MO | 2.0 | 1.0 | 1100 | $1,200 | $1.09 | 43d | 1 | 0.71mi |
| 26 Arbor Village Ct Ferguson, MO | 1.0–2.0 | 1.0 | 714 | $950 | $1.33 | 23d | 1 | 0.72mi |
| 650 Robert Ave Ferguson, MO | 3.0 | 1.0 | 816 | $1,224 | $1.50 | 43d | 1 | 0.75mi |
| 920 Hutton Pl Saint Louis, MO | 3.0 | 1.0 | 912 | $1,195 | $1.31 | 43d | 1 | 0.77mi |
| 617 Tesmore Pl Saint Louis, MO | 2.0 | 1.0 | 877 | $1,200 | $1.37 | 43d | 1 | 0.81mi |
| 1550 Northwinds Estates Dr St. Louis, MO | 1.0–2.0 | 1.0–1.5 | 877 | $1,050 | $1.20 | 43d | 1 | 0.83mi |
| 9717 Dennis Dr Saint Louis, MO | 3.0 | 1.0 | 1056 | $1,323 | $1.25 | 43d | 1 | 0.84mi |
| 9845 Dennis Dr Saint Louis, MO | 3.0 | 1.0 | 960 | $1,550 | $1.61 | 12d | 1 | 0.85mi |
| 9850 Dennis Dr Saint Louis, MO | 2.0 | 1.0 | 1032 | $1,175 | $1.14 | 43d | 1 | 0.88mi |
| 222 Randolph Ave Saint Louis, MO | 2.0 | 1.0 | 964 | $1,400 | $1.45 | 7d | 1 | 0.90mi |
| 7733 Brand Ave Saint Louis, MO | 2.0 | 1.0 | 656 | $1,090 | $1.66 | 23d | 1 | 0.92mi |
| 246 Louisa Ave Saint Louis, MO | 3.0 | 1.0 | 1036 | $1,600 | $1.54 | 43d | 1 | 0.95mi |
| 9750 Lorna Ln Saint Louis, MO | 3.0 | 1.0 | 1032 | $1,100 | $1.07 | 43d | 1 | 0.96mi |
| 223 Wiegel Dr Saint Louis, MO | 3.0 | 1.0 | 864 | $1,560 | $1.81 | 12d | 1 | 0.97mi |
| 9725 Medford Dr Saint Louis, MO | 3.0 | 1.0 | 912 | $1,485 | $1.63 | 43d | 1 | 1.00mi |
| 9868 Lorna Ln Saint Louis, MO | 3.0 | 1.0 | 1032 | $1,175 | $1.14 | 43d | 1 | 1.01mi |
| 9839 Medford Dr Saint Louis, MO | 3.0 | 1.0 | 912 | $1,095 | $1.20 | 43d | 1 | 1.01mi |
| 9840 Medford Dr Saint Louis, MO | 3.0 | 1.0 | 912 | $1,095 | $1.20 | 43d | 1 | 1.04mi |
| 801 Thomas Ave Saint Louis, MO | 3.0 | 1.0 | 864 | $1,350 | $1.56 | 43d | 1 | 1.11mi |
| 1733 Kappel Ave Saint Louis, MO | 3.0 | 1.0 | 912 | $1,250 | $1.37 | 23d | 1 | 1.12mi |
| 5925 Brand Ave Saint Louis, MO | 3.0 | 1.0 | 951 | $1,200 | $1.26 | 43d | 1 | 1.13mi |
| 5900 Sheriton Dr Saint Louis, MO | 3.0 | 1.0 | 864 | $1,050 | $1.22 | 23d | 1 | 1.14mi |
| 5830 Bermuda Dr Unit 34C St. Louis, MO | 2.0 | 1.0 | 850 | $895 | $1.05 | 43d | 1 | 1.16mi |
| 5830 Bermuda Dr Unit 30B St. Louis, MO | 2.0 | 1.0 | 900 | $895 | $0.99 | 23d | 1 | 1.16mi |
| 1654 Mowbry Ln Saint Louis, MO | 3.0 | 1.0 | 936 | $1,300 | $1.39 | 23d | 1 | 1.16mi |
| 601 Carson Rd Saint Louis, MO | 2.0 | 1.0 | 743 | $950 | $1.28 | 23d | 1 | 1.18mi |
Listing history 12 events
-
2026-05-13status Pending
-
2026-05-11$124,900 Active
-
2026-04-23price $129,900
-
2026-04-15$139,900 Active
-
2026-04-03$1,495
-
2026-04-03historical $1,495
-
2026-03-19$1,495
-
2016-06-02soldstatus $28,000
-
2016-06-02soldstatus $35,000
-
2012-01-24soldstatus $26,000
-
2012-01-24soldstatus $30,000
-
1991-01-01soldstatus
ⓘ Source: listings_history table (triggers on properties + properties_extension) + one-shot
backfill from property_details.listing_events for pre-trigger history.
Tax reassessment forecast MO · Resets to sale price
- Current annual tax
- $1,053 · $88/mo
- Projected year-2 tax
- $1,212 · $101/mo
- Expected delta
- +$158/yr (+$13/mo · 15.0%)
ⓘ Screening estimate from a state-policy table — verify with the county assessor before closing.
Climate risk First Street
- Flood 1/10 Low FEMA zone X (unshaded) · 0% chance over 30 yrs
- Wildfire 1/10 Low
- Heat 5/10 Major 7 d/yr ≥106°F today · 21 d/yr by 30 yrs out
- Wind 2/10 Low 100% chance of damaging wind over 30 yrs
- Air quality 4/10 Moderate 4 unhealthy d/yr today · 5 by 30 yrs out
Nearby sold comps map
Loading sold comps map…
Walkable amenities ~0.75 mi
Loading nearby amenities…
Taxation est. · year 1
- Rental income
- $16,844
- − Mortgage interest
- −$6,996
- − Property taxes
- −$1,053
- − Insurance
- −$624
- − Repairs & maintenance
- −$1,348
- − Management
- −$1,348
- − Depreciation
- −$3,633
- Taxable income
- $1,841
- Est. tax owed @ 24.0%
- −$442
- After-tax cash flow
- $3,327/yr
For passive investors: Depreciation is non-cash, so a rental often shows a tax loss while cash-flowing — sheltering income. Rental losses are passive: they offset passive income freely, and up to $25,000/yr can offset ordinary (W-2) income if you actively participate and your MAGI is under $100k (phasing out to $0 by $150k); unused losses carry forward. On sale, claimed depreciation is recaptured at up to 25%, and gains may owe capital-gains tax (a 1031 exchange can defer both). Figures are a year-1 estimate at your 24.0% rate — not tax advice; consult a CPA.
Schools (NCES district)
- District
- Ferguson-Florissant R-II
- NCES district ID
- 2912010
- Math proficiency
- 7% ▼ -9.00%
- Reading proficiency
- 20% ▼ -6.00%
- Median HH income
- $44,610
- Composite
- 11.96/100
- National rank
- #9666
- State rank
- #311 of 324 in MO
Livability — Ferguson
- Score
- 58/100
- State rank
- #586
- US rank
- #20809
Category grades
Schools grade is shown separately in the Schools card above.
Census & demographics
- Census place
- Ferguson, MO
- County
- Saint Louis County · 888,823 people
- City population
- 18,381
- Metro
- St. Louis, MO-IL
- Population (ZIP)
- 18,381
- Household income
- $52,328
- Rent vs Own
- Severe rent burden
- 957.0
Population outlook (St. Louis County) Hauer SSP2
- Today (2025)
- 1,025,227 people
- By 2030
- 1,028,023 · +0.3%
- By 2040
- 1,020,940 · -0.4%
- By 2050
- 1,007,280 · -1.8%
- By 2075
- 987,277 · -3.7%
- By 2100
- 921,984 · -10.1%
Race, ethnicity, and origin ACS 2023
- Neighborhood character
- Predominantly Black (66%)
- Race & ethnicity
- Black 66% White 28% Two or more races 3% Hispanic / Latino 2%
- Common ancestry
- Lithuanian 1% Iranian 1% Romanian 1%
- Foreign-born
- 1% · Canada
- Languages at home
- 95% English-only · Spanish 4%
Political lean MEDSL · St. Louis
- 2024 margin
- Strong D (+23.4) · D 60.8% · R 37.4% · Other 1.7%
- 2008→2024 swing
- +3.5pp toward D · 2008: 19.9pp · 2024: 23.4pp
- All cycles
- 2024: D+23.4 2020: D+24.0 2016: D+16.2 2012: D+13.7 2008: D+19.9
Not yet ingested
- Civics
- —
Market trends
- HPI YoY
- ▼ -152.56%
- Current HPI
- 138.6781
- Rent YoY
- ▲ 9.03%
- Metro
- St. Louis, MO-IL
- State GDP YoY
- ▲ 1.84%
- F500 in state
- 20
Industry mix (Fortune 500 HQ in MO)
| Industry | F500 HQs | Revenue |
|---|---|---|
| Healthcare | 1 | $163B |
|
||
| Insurance | 1 | $21B |
|
||
| Industrial Technology | 1 | $17B |
|
||
| Retail | 1 | $16B |
|
||
| Industrial Distribution | 1 | $10B |
|
||
| Utilities | 1 | $9B |
|
||
Price history
+380.4% since first listed12 events — show timeline
- 2026-05-13 Pending — MARIS as Distributed by MLS Grid
- 2026-05-11 Listed $124,900 MARIS as Distributed by MLS Grid
- 2026-04-23 Price Changed $129,900 MARIS as Distributed by MLS Grid
- 2026-04-15 Listed $139,900 MARIS as Distributed by MLS Grid
- 2026-04-03 Listed for Rent $1,495 MARIS
- 2026-04-03 Rental Removed $1,495 APPFOLIO
- 2026-03-19 Listed for Rent $1,495 APPFOLIO
- 2016-06-02 Sold (Public Records) $35,000 Public Records
- 2016-06-02 Sold (Public Records) $28,000 Public Records
- 2012-01-24 Sold (Public Records) $30,000 Public Records
- 2012-01-24 Sold (Public Records) $26,000 Public Records
- 1991-01-01 Sold (Public Records) — Public Records
Property tax history
+0.1%/yrLatest (2022): $1,053 · +3.3% YoY. Source: county tax records.
Cash-flow waterfall
monthlySold comps — $/sqft
last 12 mo · ≤1 miLoading sold comps…