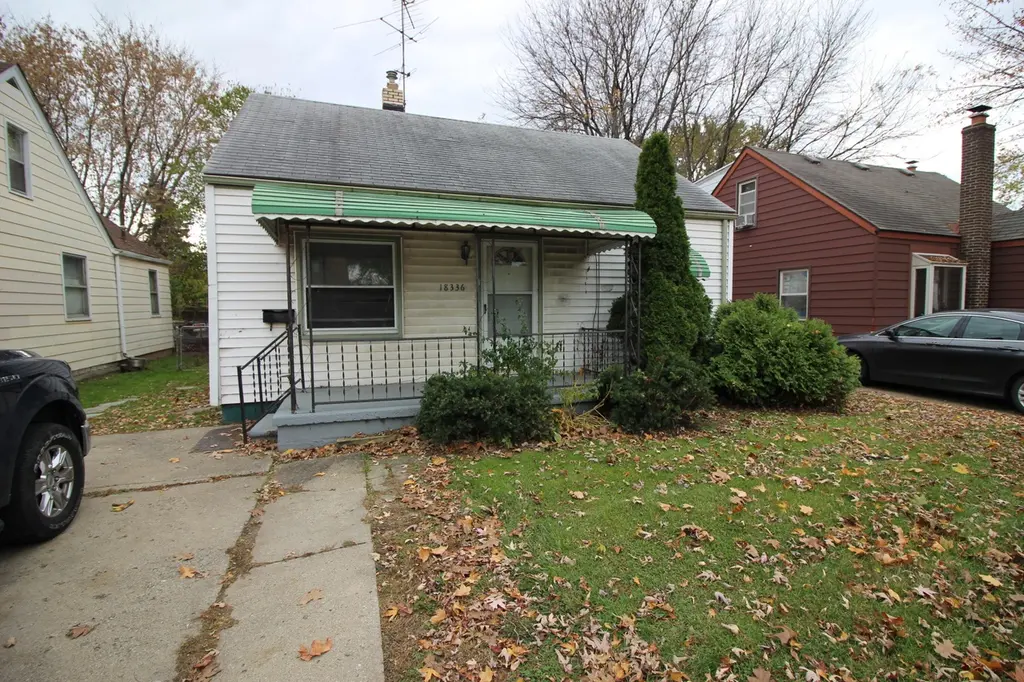
18336 E 12 Mile Rd · Roseville, MI
Flood risk 1/10 · Minimal
- FEMA flood zone
- X (unshaded)
- Chance of flooding over 30 yrs
- 0.0%
- Est. flood insurance / yr
- $507 – $1,088
Fire risk 1/10 · Minimal
- Est. fire insurance / yr
- $784 – $1,456
Heat risk 3/10 · Minor
- Hot days now (above 96°F)
- 7 days/yr
- Hot days in 30 yrs
- 15 days/yr
Wind risk 1/10 · Minimal
- Chance of severe wind over 30 yrs
- —
Air-quality risk 4/10 · Minor
- Unhealthy air days now
- 4 days/yr
- Unhealthy air days in 30 yrs
- 5 days/yr
Risk factors via First Street. Map © Google.
Why this score? — see what drove the C+ grade
The composite is a weighted blend of 9 inputs, each scored 0–100. Each bar is that input's sub-score; the figure is the points it added to the 100-point composite (weight × sub-score).
- Cash flow +24.4/30.0
- ARV discount +13.5/15.0
- DSCR +7.9/10.0
- 1% rule +6.9/10.0
- Livability +3.6/5.0
- Rent growth +2.6/5.0
- Condition / age +2.5/5.0
- Schools +1.5/10.0
- Appreciation +0.0/10.0
$125,000
🖨 Deal sheet 📄 Offer letter ✓ Due diligence
Listing remarks MLS
TENANT OCCUPIED!Very cozy 3 Bedroom Bungalow home with 1 bathroom. Utility room with washer and dryer hook ups. Fenced in back yard. No basement and No garage. Photos are from before tenant move in. Tenant since 2020, currently month to month paying $1,210.
Key facts
- 4,792 sq ft lot
- Built 1950
- Listed 7 days
Property features AI
Finance
- Other:
- Financial info:
- HOA & community:
Exterior
- Parking:
- Security:
- Utilities: Public water
- Home design: Single family residence; Residential property; Built in 1950
- Construction: Vinyl siding
- Exterior features: 0.11-acre lot
Interior
- Kitchen:
- Bedrooms:
- Flooring:
- Bathrooms: 1 full bathroom
- Heating & cooling: Forced air heating; Has heating
- Interior features: 5 total rooms; Crawl space basement
- Laundry & utility:
Neighborhood map
What this means for you Summary
Snapshot
- This is a 2-bed/1.0-bath single-family listed at $125k.
Deal economics
- At list price, monthly cash flow is $253 ($3k/yr) — positive.
- The deal already cash-flows at list — no discount required.
- Meets the 1% rule at list price ($1k rent vs $125k).
- Cap rate 8.7% vs local median 6.0% in Roseville — top-decile yield for the area; either an underpriced asset or a hidden risk that comps aren't pricing in. Stress-test before assuming the spread holds.
Location & tenants
- Location reads 72/100 on livability (#258 in MI) — a middle-class / working-renter tenant base. Strengths: commute A+, cost of living A+, housing A+; Watch: health & safety D+, employment D, schools F.
- Roseville Community Schools (suburban): math 11% / reading 24% proficiency, ranked #483 of 540 in MI (top 89%) — low school quality limits family demand, transient renter base, plan for 1-2y turnover; 60% free/reduced lunch — lower-income household profile, screen leases tightly.
- Market conditions: Rents flat; 265 active listings in the ZIP; 40 comparable units currently listed for rent nearby; rentals at typical pace (median 15d on market — plan ~3-4 weeks tenant-placement turnaround); 1,321 units permitted in Macomb County in 2024 (86 in 5+ unit buildings).
Forward outlook
- Local home prices are declining (-3.0%/yr); year-one equity from $864 of loan paydown is wiped out by about $4k of value loss. Plan a longer hold.
- Macomb County population projected at +9% by 2050 — modest demand growth; plan on rents tracking national, not racing it.
Negotiation context
- Only 7 days on market — expect competitive offers; lowballing is unlikely to land.
- 10 sale attempts since 21y ago with the ask held roughly flat each time — persistent listings suggest the price (not the market) is what's stuck; bring a comps-based counter.
Risks & watch-outs
- Watch-outs: built in 1950 — expect roof / HVAC / electrical / plumbing capex.
Questions for the listing agent
- Built in 1950 — when were the roof, HVAC, electrical panel, plumbing, and water heater last replaced?
- Is there a deadline driving the sale (1031 exchange, divorce, estate, relocation)? That informs how much negotiation room exists.
- Schools are F-rated, which usually means shorter tenancies and higher turnover. Who's the typical renter profile here, and what's been the actual vacancy rate?
- Crime grade is F in this area — have there been break-ins, vandalism, or insurance claims at this property in the last 3 years? What carrier currently insures it and at what premium?
- What's the average days-on-market for RENTAL listings here right now (not sales)? A rising rental-DOM trend means longer vacancies and softer asking-rent achievability than the comps imply.
- What's the recent tenant-quality profile in this submarket — average credit score on applications, eviction rate, late-payment / NSF rate, and stable-employment percentage? A property-management company in the area should have these aggregated.
- How much new for-sale + rental construction is in the pipeline within 1–3 miles? Heavy new supply typically softens prices + rents 12–24 months out; constrained supply supports both.
Investment metrics
- 1% rule
- 1.19% ✓
- Cap rate
- 8.72%
- Cash-on-cash
- 8.68%
- DSCR
- 1.39
- GRM
- 7.0
CMA / ARV
- ARV (median comp)
- $144,258
- List price
- $125,000
- Delta
- -13.35%
- Verdict
- UNDERPRICED
- Comps
- 20 within 1.0 mi
Show comp detail 12 sales within ~0.75 mi
| Address | Dist | Beds/Ba | Sqft | Sold | Price | $/sf | Match |
|---|---|---|---|---|---|---|---|
| 18336 E 12 Mile Rd | 0.00mi | 3/1.0 (+1) | 1,008 (0%) | 1mo | $112,500 | $112 | 94 |
| 28319 Waverly St | 0.67mi | 2/1.0 | 1,000 (-1%) | 5mo | $142,200 | $142 | 63 |
| 18634 Common Rd | 0.52mi | 3/1.0 (+1) | 975 (-3%) | 4mo | $148,000 | $152 | 62 |
| 28441 Jahns Dr | 0.38mi | 3/1.0 (+1) | 1,092 (+8%) | 2mo | $145,000 | $133 | 62 |
| 28075 Asmus St | 0.62mi | 3/1.0 (+1) | 1,021 (+1%) | 5mo | $138,500 | $136 | 60 |
| 27861 Bohnhoff St | 0.63mi | 2/1.0 | 936 (-7%) | 3mo | $85,000 | $91 | 56 |
| 27830 Van Howe St | 0.70mi | 3/1.0 (+1) | 960 (-5%) | 3mo | $159,900 | $167 | 52 |
| 28059 Schram St | 0.54mi | 3/1.0 (+1) | 1,119 (+11%) | 3mo | $135,000 | $121 | 49 |
| 28042 Maple St | 0.65mi | 2/1.0 | 900 (-11%) | 4mo | $71,020 | $79 | 48 |
| 29920 Pinehurst St | 0.57mi | 3/1.0 (+1) | 1,128 (+12%) | 2mo | $159,000 | $141 | 47 |
| 17468 Ivanhoe St | 0.74mi | 3/1.0 (+1) | 936 (-7%) | 3mo | $96,500 | $103 | 46 |
| 17835 Tennyson St | 0.69mi | 3/1.0 (+1) | 907 (-10%) | 3mo | $130,000 | $143 | 43 |
Match score weights: distance 35% · size 25% · config 20% · recency 20%. Top-matched comps best support the ARV.
Projected returns pro-forma
-3.0% appreciation · 0.39% rent growth · sell at horizon
- IRR
- -6.2%
- Equity multiple
- 0.77×
- Total profit
- $-7,880
- Equity at exit
- $18,638
- IRR
- -0.3%
- Equity multiple
- 0.98×
- Total profit
- $-703
- Equity at exit
- $10,808
Cash invested: $35,000 (down + closing). Projections, not guarantees.
Landlord ↔ Tenant lean methodology
- Overall (STATE)
- 62 Landlord-Friendly
- State Michigan
- 62 Landlord-Friendly · EVEN
- County
- — inherits STATE
- City
- — inherits STATE
ZIP-level market 48066
- Rents YoY
- 0.4%
- Active inventory
- 265
- Price-to-rent
- 7.0×
Monthly cashflow live
- Estimated rent
- $1,490 high interval (Pro) →
- Mortgage (P&I)
- −$656
- Tax from tax record
- −$216 /mo · $2,595/yr
- Insurance
- −$52
- HOA
- −$0
- Vacancy / Maint / Mgmt
- −$313
- Net cashflow
- $253
Break-even live
UW: 25.0% down · 7.5% · 30yr · 1.5% tax · 5.0% vac · 8.0% maint · 8.0% mgmt
Financing live
Cash to close
- Down payment
- $31,250
- Closing costs
- $3,750
- Reserves months
- —
- Total cash needed
- —
Loan-product check · same deal, 3 products live
Conventional
25% down · 7.5% · 30yr
- Down + closing
- —
- Monthly P&I
- —
- Monthly cashflow
- —
- DSCR
- —
- Eligible?
- —
Personal DTI + credit; lowest rate.
DSCR
20% down · 8.5% · 30yr
- Down + closing
- —
- Monthly P&I
- —
- Monthly cashflow
- —
- DSCR
- —
- Eligible?
- —
No personal income docs; deal must DSCR.
Hard money
10% down · 12.0% · 12mo
- Down + closing
- —
- Monthly P&I
- —
- Monthly cashflow
- —
- DSCR
- —
- Eligible?
- —
Short-term bridge; refi at stabilization.
Rent comps 40 comps
| Address | Beds | Baths | Sqft | Rent | $/sqft | DOM | Units | Dist |
|---|---|---|---|---|---|---|---|---|
| 18410 Tranquil St Roseville, MI | 3.0 | 1.0 | 1140 | $1,800 | $1.58 | 14d | 1 | 0.13mi |
| 18410 Tranquil St Roseville, MI | 3.0 | 1.0 | 1140 | $1,800 | $1.58 | 43d | 1 | 0.13mi |
| 28744 Maple St Roseville, MI | 3.0 | 1.0 | 1050 | $1,295 | $1.23 | 43d | 1 | 0.49mi |
| 19236 Florida St Roseville, MI | 2.0 | 1.0 | 1160 | $1,700 | $1.47 | 1d | 1 | 0.52mi |
| 18423 Sharon Ln Unit 1032353P Roseville, MI | 1.0 | 1.0 | 742 | $3,458 | $4.66 | 14d | 1 | 0.58mi |
| 18365 Sharon Ln Unit 1032367P Roseville, MI | 1.0 | 1.0 | 796 | $3,573 | $4.49 | 14d | 1 | 0.58mi |
| 18451 Sharon Ln Unit 1032334P Roseville, MI | 1.0 | 1.0 | 742 | $3,932 | $5.30 | 14d | 1 | 0.59mi |
| 18389 Sharon Ln Unit 1032350P Roseville, MI | 1.0 | 1.0 | 742 | $3,470 | $4.68 | 16d | 1 | 0.59mi |
| 18377 Sharon Ln Unit 1032361P Roseville, MI | 1.0 | 1.0 | 742 | $4,242 | $5.72 | 43d | 1 | 0.59mi |
| 18377 Sharon Ln Unit 1032363P Roseville, MI | 1.0 | 1.0 | 742 | $4,015 | $5.41 | 14d | 1 | 0.59mi |
| 18459 Sharon Ln Unit 1032344P Roseville, MI | 1.0 | 1.0 | 742 | $3,035 | $4.09 | 12d | 1 | 0.59mi |
| 18423 Sharon Ln Unit 1032349P Roseville, MI | 1.0 | 1.0 | 742 | $3,210 | $4.33 | 1d | 1 | 0.59mi |
| 18431 Sharon Ln Unit 1032346P Roseville, MI | 1.0 | 1.0 | 742 | $3,695 | $4.98 | 14d | 1 | 0.59mi |
| 18443 Sharon Ln Unit 1032345P Roseville, MI | 1.0 | 1.0 | 742 | $3,286 | $4.43 | 1d | 1 | 0.59mi |
| 18447 Sharon Ln Unit 1032337P Roseville, MI | 1.0 | 1.0 | 742 | $3,468 | $4.67 | 16d | 1 | 0.59mi |
| 27850 Gratiot Ave Unit 1032354P Roseville, MI | 1.0 | 1.0 | 742 | $3,590 | $4.84 | 1d | 1 | 0.60mi |
| 18355 Mesle St Unit 1032347P Roseville, MI | 1.0 | 1.0 | 742 | $3,878 | $5.23 | 12d | 1 | 0.62mi |
| 18340 Mesle St Unit 1032351P Roseville, MI | 1.0 | 1.0 | 742 | $3,167 | $4.27 | 10d | 1 | 0.65mi |
| 18308 Mesle St Unit 1032362P Roseville, MI | 1.0 | 1.0 | 742 | $3,072 | $4.14 | 4d | 1 | 0.65mi |
| 18635 Meier St Unit : Back Roseville, MI | 2.0 | 1.0 | 900 | $1,100 | $1.22 | 24d | 1 | 0.69mi |
| 27881 O Neil Roseville, MI | 3.0 | 1.0 | 1300 | $1,300 | $1.00 | 24d | 1 | 0.76mi |
| 17405 Ivanhoe St Roseville, MI | 3.0 | 1.0 | 969 | $1,600 | $1.65 | 43d | 1 | 0.78mi |
| 27415 Gratiot Ave Unit 1 Roseville, MI | 1.0 | 1.0 | 1050 | $1,250 | $1.19 | 17d | 1 | 0.83mi |
| 17392 Tennyson St Roseville, MI | 3.0 | 1.0 | 900 | $1,649 | $1.83 | 2d | 1 | 0.85mi |
| 27547 O Neil Roseville, MI | 3.0 | 1.0 | 1014 | $1,350 | $1.33 | 4d | 1 | 0.89mi |
| 30512 Oakridge Manor Dr Roseville, MI | 2.0 | 1.5 | 1002 | $1,350 | $1.35 | 24d | 1 | 0.91mi |
| 28232 Floral St Unit 1032343P Roseville, MI | 3.0 | 1.0 | 1496 | $6,605 | $4.42 | 12d | 1 | 0.95mi |
| 16651 Twelve Mile Rd Roseville, MI | 2.0–3.0 | 1.5 | 957 | $1,325 | $1.38 | 1d | 1 | 1.02mi |
| 19040 E 13 Mile Rd Roseville, MI | 3.0 | 1.0 | 1008 | $1,550 | $1.54 | 1d | 1 | 1.03mi |
| 17491 Allen St Unit 17491 Allen Roseville, MI | 1.0 | 1.0 | 900 | $1,050 | $1.17 | 4d | 1 | 1.03mi |
| 27067 Lawnwood St Roseville, MI | 3.0 | 1.0 | 960 | $1,500 | $1.56 | 43d | 1 | 1.04mi |
| 30773 Hidden Pines Ln Roseville, MI | 2.0 | 2.0 | 1142 | $1,500 | $1.31 | 43d | 1 | 1.07mi |
| 30583 Hidden Pines Ln Roseville, MI | 2.0 | 2.0 | 1100 | $1,250 | $1.14 | 16d | 1 | 1.08mi |
| 30657 Hidden Pines Ln Roseville, MI | 2.0 | 2.0 | 1174 | $1,650 | $1.41 | 19d | 1 | 1.08mi |
| 17134 E Thirteen Mile Rd Roseville, MI | 1.0–2.0 | 1.0 | 825 | $1,269 | $1.54 | 1d | 16 | 1.08mi |
| 16579 12 Mile Rd Unit 16579 Roseville, MI | 2.0 | 1.0 | 850 | $1,275 | $1.50 | 43d | 1 | 1.11mi |
| 16577 12 Mile Rd Roseville, MI | 2.0 | 1.0 | 850 | $1,275 | $1.50 | 43d | 1 | 1.11mi |
| 16425 12 Mile Rd Roseville, MI | 2.0 | 1.0 | 800 | $1,100 | $1.38 | 21d | 1 | 1.14mi |
| 17455 Wildwood St Roseville, MI | 1.0 | 1.0 | 800 | $975 | $1.22 | 24d | 1 | 1.25mi |
| 16944 E 11 Mile Rd Unit C2 Roseville, MI | 2.0 | 1.0 | 900 | $1,295 | $1.44 | 24d | 1 | 1.30mi |
Listing history 24 events
-
2026-05-04status Pending 257-char remark
Show marketing remark (257 chars)
TENANT OCCUPIED!Very cozy 3 Bedroom Bungalow home with 1 bathroom. Utility room with washer and dryer hook ups. Fenced in back yard. No basement and No garage. Photos are from before tenant move in. Tenant since 2020, currently month to month paying $1,210.
-
2026-05-04status Pending
Show marketing remark (257 chars)
TENANT OCCUPIED!Very cozy 3 Bedroom Bungalow home with 1 bathroom. Utility room with washer and dryer hook ups. Fenced in back yard. No basement and No garage. Photos are from before tenant move in. Tenant since 2020, currently month to month paying $1,210.
-
2026-04-27$125,000 Active 257-char remark
Show marketing remark (257 chars)
TENANT OCCUPIED!Very cozy 3 Bedroom Bungalow home with 1 bathroom. Utility room with washer and dryer hook ups. Fenced in back yard. No basement and No garage. Photos are from before tenant move in. Tenant since 2020, currently month to month paying $1,210.
-
2026-04-27$125,000 Active
Show marketing remark (257 chars)
TENANT OCCUPIED!Very cozy 3 Bedroom Bungalow home with 1 bathroom. Utility room with washer and dryer hook ups. Fenced in back yard. No basement and No garage. Photos are from before tenant move in. Tenant since 2020, currently month to month paying $1,210.
-
2014-10-24soldstatus $650
-
2014-09-19historical
-
2014-08-26$750
-
2014-04-22soldstatus $21,500
-
2014-04-22soldstatus $21,500
-
2014-04-21historical
-
2014-03-13$24,900
-
2014-03-13$24,900
-
2008-07-17soldstatus $21,550
-
2008-07-17soldstatus $21,550
-
2008-05-27$20,500
-
2008-05-27historical
-
2008-05-15historical
-
2008-05-12$20,500
-
2008-05-12$20,500
-
2006-07-31soldstatus $86,000
-
2006-03-15historical
-
2005-08-20$96,000
ⓘ Source: listings_history table (triggers on properties + properties_extension) + one-shot
backfill from property_details.listing_events for pre-trigger history.
Tax reassessment forecast MI · Partial reset (capped growth)
- Current annual tax
- $2,595 · $216/mo
- Projected year-2 tax
- $2,595 · $216/mo
- Expected delta
- $0/yr ($0/mo · 0.0%)
ⓘ Screening estimate from a state-policy table — verify with the county assessor before closing.
Climate risk First Street
- Flood 1/10 Low FEMA zone X (unshaded) · 0% chance over 30 yrs
- Wildfire 1/10 Low
- Heat 3/10 Moderate 7 d/yr ≥96°F today · 15 d/yr by 30 yrs out
- Wind 1/10 Low
- Air quality 4/10 Moderate 4 unhealthy d/yr today · 5 by 30 yrs out
Nearby sold comps map
Loading sold comps map…
Walkable amenities ~0.75 mi
Loading nearby amenities…
Taxation est. · year 1
- Rental income
- $17,880
- − Mortgage interest
- −$7,002
- − Property taxes
- −$2,595
- − Insurance
- −$625
- − Repairs & maintenance
- −$1,430
- − Management
- −$1,430
- − Depreciation
- −$3,636
- Taxable income
- $1,161
- Est. tax owed @ 24.0%
- −$279
- After-tax cash flow
- $2,760/yr
For passive investors: Depreciation is non-cash, so a rental often shows a tax loss while cash-flowing — sheltering income. Rental losses are passive: they offset passive income freely, and up to $25,000/yr can offset ordinary (W-2) income if you actively participate and your MAGI is under $100k (phasing out to $0 by $150k); unused losses carry forward. On sale, claimed depreciation is recaptured at up to 25%, and gains may owe capital-gains tax (a 1031 exchange can defer both). Figures are a year-1 estimate at your 24.0% rate — not tax advice; consult a CPA.
Schools (NCES district)
- District
- Roseville Community Schools
- NCES district ID
- 2630210
- Math proficiency
- 11% ▼ -8.00%
- Reading proficiency
- 24% ▼ -7.00%
- Median HH income
- $41,590
- Composite
- 14.98/100
- National rank
- #9363
- State rank
- #483 of 540 in MI
Livability — Roseville
- Score
- 72/100
- State rank
- #258
- US rank
- #6400
Category grades
Schools grade is shown separately in the Schools card above.
Census & demographics
- Census place
- Roseville, MI
- County
- Macomb County · 638,552 people
- City population
- 47,123
- Metro
- Detroit-Warren-Dearborn, MI
- Population (ZIP)
- 47,123
- Household income
- $62,182
- Rent vs Own
- Severe rent burden
- 1712.0
Population outlook (Macomb County) Hauer SSP2
- Today (2025)
- 925,296 people
- By 2030
- 948,226 · +2.5%
- By 2040
- 983,961 · +6.3%
- By 2050
- 1,010,200 · +9.2%
- By 2075
- 1,076,222 · +16.3%
- By 2100
- 1,077,065 · +16.4%
Race, ethnicity, and origin ACS 2023
- Neighborhood character
- Predominantly White (65%)
- Race & ethnicity
- White 65% Black 23% Two or more races 7% Hispanic / Latino 4% Asian 2%
- Common ancestry
- Romanian 12% Lithuanian 4% Slovak 2%
- Foreign-born
- 5% · Canada
- Languages at home
- 93% English-only · Spanish 2% Russian/Polish/Slavic 1% Other Indo-European 1%
Political lean MEDSL · Macomb
- 2024 margin
- R (+13.7) · D 42.2% · R 55.9% · Other 1.9%
- 2008→2024 swing
- -22.3pp toward R · 2008: 8.6pp · 2024: -13.7pp
- All cycles
- 2024: R+13.7 2020: R+8.1 2016: R+11.6 2012: D+4.0 2008: D+8.6
Not yet ingested
- Civics
- —
Market trends
- HPI YoY
- ▼ -232.95%
- Current HPI
- 217.4171
- Rent YoY
- ▲ 0.39%
- Metro
- Detroit-Warren-Dearborn, MI
- State GDP YoY
- ▲ 1.37%
- F500 in state
- 28
Industry mix (Fortune 500 HQ in MI)
| Industry | F500 HQs | Revenue |
|---|---|---|
| Automotive Parts | 3 | $48B |
|
||
| Automotive | 2 | $372B |
|
||
| Chemicals | 1 | $45B |
|
||
| Automotive Retail | 1 | $29B |
|
||
| Healthcare / Medical Devices | 1 | $23B |
|
||
| Automotive Technology | 1 | $20B |
|
||
Price history
+17.2% since first listed28 events — show timeline
- 2026-06-03 Sold (Public Records) $112,500 Public Records
- 2026-06-03 Sold (MLS) $112,500 REALCOMP
- 2026-06-03 Sold (MLS) $112,500 SW Michigan MLS
- 2026-06-03 Sold (MLS) $112,500 MiRealSource-MiMLS
- 2026-05-04 Pending — REALCOMP
- 2026-05-04 Pending — MiRealSource-MiMLS
- 2026-05-04 Pending — SW Michigan MLS
- 2026-04-27 Listed $125,000 REALCOMP
- 2026-04-27 Listed $125,000 SW Michigan MLS
- 2026-04-27 Listed $125,000 MiRealSource-MiMLS
- 2014-10-24 Sold (MLS) $650 MiRealSource-MiMLS
- 2014-09-19 Listing Removed — MiRealSource-MiMLS
- 2014-08-26 Listed $750 MiRealSource-MiMLS
- 2014-04-22 Sold (MLS) $21,500 REALCOMP
- 2014-04-22 Sold (MLS) $21,500 MiRealSource-MiMLS
- 2014-04-21 Listing Removed — MiRealSource-MiMLS
- 2014-03-13 Listed $24,900 REALCOMP
- 2014-03-13 Listed $24,900 MiRealSource-MiMLS
- 2008-07-17 Sold (MLS) $21,550 REALCOMP
- 2008-07-17 Sold (MLS) $21,550 MiRealSource-MiMLS
- 2008-05-27 Listing Removed — MiRealSource-MiMLS
- 2008-05-27 Listed $20,500 MiRealSource-MiMLS
- 2008-05-15 Listing Removed — REALCOMP
- 2008-05-12 Listed $20,500 REALCOMP
- 2008-05-12 Listed $20,500 REALCOMP
- 2006-07-31 Sold (Public Records) $86,000 Public Records
- 2006-03-15 Listing Removed — REALCOMP
- 2005-08-20 Listed $96,000 REALCOMP
Property tax history
+6.5%/yrLatest (2025): $2,595 · +4.0% YoY. Source: county tax records.
Cash-flow waterfall
monthlySold comps — $/sqft
last 12 mo · ≤1 miLoading sold comps…