 Multi-family
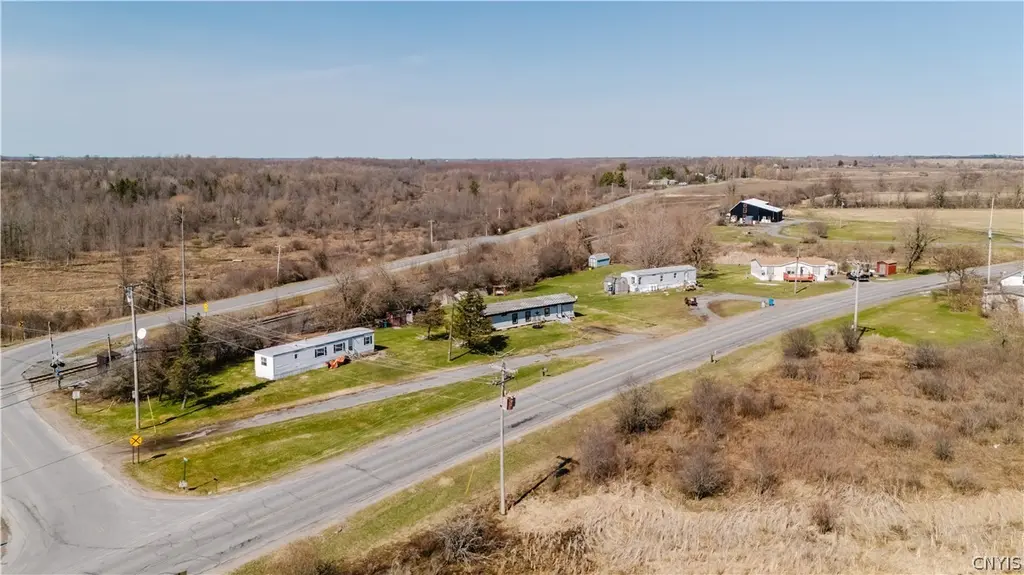
28671 Martin Rd N · Evans Mills, NY
Flood risk 1/10 · Minimal
- FEMA flood zone
- X (unshaded)
- Chance of flooding over 30 yrs
- 0.0%
- Est. flood insurance / yr
- $507 – $1,088
Fire risk 2/10 · Minimal
- Est. fire insurance / yr
- $691 – $1,283
Heat risk 2/10 · Minimal
- Hot days now (above 92°F)
- 7 days/yr
- Hot days in 30 yrs
- 15 days/yr
Wind risk 1/10 · Minimal
- Chance of severe wind over 30 yrs
- 1.0%
Air-quality risk 2/10 · Minimal
- Unhealthy air days now
- 1 days/yr
- Unhealthy air days in 30 yrs
- 1 days/yr
Risk factors via First Street. Map © Google.
Why this score? — see what drove the B+ grade
The composite is a weighted blend of 9 inputs, each scored 0–100. Each bar is that input's sub-score; the figure is the points it added to the 100-point composite (weight × sub-score).
- Cash flow +30.0/30.0
- 1% rule +10.0/10.0
- DSCR +10.0/10.0
- Appreciation +9.5/10.0
- ARV discount +7.5/15.0
- Schools +3.5/10.0
- Livability +2.9/5.0
- Rent growth +2.5/5.0
- Condition / age +1.0/5.0
$175,000
🖨 Deal sheet (PDF) 📄 Offer letter ✓ Due diligence
Multi-family units
County records classify this as Multi-Family (2-4 Unit). Listing-text estimate: 1 unit. estimate disagrees with records
Listing remarks
Investment opportunity just outside of Evans Mills! This 1.7-acre property is currently classified as a mobile home park and features four mobile homes on site. One unit is owned by the seller and is tenant-occupied, generating $650/month in rental income. The remaining three units are tenant-owned and each pay $360/month in lot rent, providing steady additional income. The seller-owned unit is positioned as the far-left home when facing the property. The property offers a solid layout with good space across the 1.7-acre lot and is conveniently located just minutes from Evans Mills, with easy access to local restaurants, schools, and Fort Drum. A great opportunity for investors looking to e
Key facts
- 1.7 acre lot
- 2 parking spots
- Built 2006
Property features AI
Finance
- Other: Lot size approximately 1.7 acres; lot dimensions 473 x 220
- Financial info: Property is a 4-unit multi-family; Units reported with rents: three units at $350 each, one unit at $650; Owner pays: other (see remarks); Rent includes: see remarks; Operating expenses: see remarks; Separate electric meters: 1
- HOA & community: No HOA details provided
Exterior
- Parking: Parking available with two or more spaces
- Security: No security details provided
- Utilities: Electricity available and connected; Septic tank; Well water
- Home design: Single-story building; Residential multi-use zoning; Resale condition
- Construction: Year built: existing; Construction materials: see remarks
- Exterior features: Leased propane tank; Irregular lot
Interior
- Kitchen: No kitchen appliance details provided
- Bedrooms: One unit listed with 2 bedrooms (unit-level data)
- Flooring: No flooring details provided
- Bathrooms: At least one full bathroom in a listed unit
- Heating & cooling: Gas forced-air heating
- Interior features: Crawl space basement; Propane water heater
- Laundry & utility: No laundry details provided
Neighborhood map
What this means for you Summary
Snapshot
- This is a 2-bed/1.0-bath multifamily listed at $175k. Condition is rated poor.
Deal economics
- At list price, monthly cash flow is $1k ($18k/yr) — positive.
- The deal already cash-flows at list — no discount required.
- Meets the 1% rule at list price ($3k rent vs $175k).
- Recommended offer: $164k (6.0% below list) — sets the bar for market timing.
Location & tenants
- Location reads 58/100 on livability (#1,069 in NY) — a working-class tenant base; expect higher turnover. Strengths: housing A-, cost of living B+; Watch: health & safety D, crime F, amenities F.
- Indian River Central School District (rural): math 33% / reading 50% proficiency, ranked #502 of 590 in NY (top 85%) — families likely to look elsewhere, expect single-tenant / working-renter base with shorter leases.
- Zoned schools: Evans Mills Primary School (math 37% / reading 54%, grade D-, #1,268 of 2,108 statewide, top 60%, 375 students, 60% FRL); Indian River Middle School (math 26% / reading 50%, grade F, #442 of 729 statewide, top 61%, 672 students, 60% FRL); Indian River High School (math 98% / reading 90%, grade A+, #124 of 1,100 statewide, top 12%, 781 students, 49% FRL) — zoned schools average 57% FRL vs 28% district-wide (29 pts higher); higher-poverty schools than district average — tighter screening recommended.
- Zoned-school proficiency averages 59% at this address vs 42% district-wide (+18 pts) — the actual schools serving this property are materially stronger than the Indian River Central School District average implies; a family-tenant draw the district grade alone would hide.
- Market conditions: 24 active listings in the ZIP; 196 units permitted in Jefferson County in 2024 (0 in 5+ unit buildings).
Forward outlook
- In year one you build about $17k of equity ($1k loan paydown + $16k appreciation (9.0% local appreciation)).
- Jefferson County population projected at -12% by 2050 — secular population decline; favor cash flow + early exit over multi-decade hold.
- At projected returns (9.0% appreciation + 3.0% rent growth), your $49k cash investment doubles in ~2 years — after that, you're playing with house money.
- By year 3, paydown + projected appreciation supports a ~$43k cash-out refi (75% LTV) — recoverable capital for the next deal without selling this one.
Negotiation context
- It's been on market 63 days — a 6% lower offer ($164k) is reasonable based on typical stale-listing flexibility.
Questions for the listing agent
- It's been on market 63 days. Have you received any prior offers? Is the seller open to a 6% concession, seller financing, or rate buy-down credit?
- Have any recent inspections been done? Can we get a copy of the seller's disclosures and any deferred-maintenance estimates?
- Why hasn't it sold? Are there any deal-killer items the seller is aware of (foundation, flood, title, zoning, code violations)?
- Is there a deadline driving the sale (1031 exchange, divorce, estate, relocation)? That informs how much negotiation room exists.
- Crime grade is F in this area — have there been break-ins, vandalism, or insurance claims at this property in the last 3 years? What carrier currently insures it and at what premium?
- What's the average days-on-market for RENTAL listings here right now (not sales)? A rising rental-DOM trend means longer vacancies and softer asking-rent achievability than the comps imply.
- What's the recent tenant-quality profile in this submarket — average credit score on applications, eviction rate, late-payment / NSF rate, and stable-employment percentage? A property-management company in the area should have these aggregated.
- How much new apartment / multifamily construction is in the pipeline within 1–3 miles? Heavy new supply (>2% of stock underway) typically softens rents 12–24 months out; light construction supports rent growth.
Investment metrics
- 1% rule
- 1.95% ✓
- Cap rate
- 16.50%
- Cash-on-cash
- 36.47%
- DSCR
- 2.62
- GRM
- 4.3
CMA / ARV
No comps found within radius.
Projected returns pro-forma
9.04% appreciation · 3.0% rent growth · sell at horizon
- IRR
- 51.0%
- Equity multiple
- 4.65×
- Total profit
- $178,839
- Equity at exit
- $145,555
- IRR
- 45.3%
- Equity multiple
- 10.18×
- Total profit
- $449,809
- Equity at exit
- $301,851
Cash invested: $49,000 (down + closing). Projections, not guarantees.
Landlord ↔ Tenant lean methodology
- Overall (STATE)
- 15 Strongly Tenant-Friendly
- State New York
- 15 Strongly Tenant-Friendly · D+10
- County
- — inherits STATE
- City
- — inherits STATE
ZIP-level market 13637
- Home prices YoY
- 2.3%
- Active inventory
- 24
- Price-to-rent
- 17.1×
Monthly cashflow live
- Estimated rent
- $3,416 medium interval (Pro) →
- Mortgage (P&I)
- −$918
- Tax est. 1.5%
- −$219 /mo · $2,625/yr
- Insurance
- −$73
- HOA
- −$0
- Vacancy / Maint / Mgmt
- −$717
- Net cashflow
- $1,489
Break-even live
Sensitivity live
| Price | -10% $1,610 | -5% $1,550 | +0% $1,489 | +5% $1,429 | +10% $1,368 |
|---|---|---|---|---|---|
| Rent | -10% $1,219 | -5% $1,354 | +0% $1,489 | +5% $1,624 | +10% $1,759 |
| Rate | -1.0pp $1,577 | -0.5pp $1,534 | base $1,489 | +0.5pp $1,444 | +1.0pp $1,398 |
4-unit breakdown (identical units grouped — click to expand)
| Units | Beds | Baths | Est. rent |
|---|---|---|---|
| 4× units | 1 | 1 | $3,416 |
| #1 | 1 | 1 | $854 |
| #2 | 1 | 1 | $854 |
| #3 | 1 | 1 | $854 |
| #4 | 1 | 1 | $854 |
| Total (4 units) | $3,416 | ||
UW: 25.0% down · 7.5% · 30yr · 1.5% tax · 5.0% vac · 8.0% maint · 8.0% mgmt
Financing live
Cash to close
- Down payment
- $43,750
- Closing costs
- $5,250
- Reserves months
- —
- Total cash needed
- —
Loan-product check · same deal, 3 products live
Conventional
25% down · 7.5% · 30yr
- Down + closing
- —
- Monthly P&I
- —
- Monthly cashflow
- —
- DSCR
- —
- Eligible?
- —
Personal DTI + credit; lowest rate.
DSCR
20% down · 8.5% · 30yr
- Down + closing
- —
- Monthly P&I
- —
- Monthly cashflow
- —
- DSCR
- —
- Eligible?
- —
No personal income docs; deal must DSCR.
Hard money
10% down · 12.0% · 12mo
- Down + closing
- —
- Monthly P&I
- —
- Monthly cashflow
- —
- DSCR
- —
- Eligible?
- —
Short-term bridge; refi at stabilization.
Listing history 17 events
-
2026-06-19days on market $175,000 Active 63 DOM
-
2026-06-18days on market $175,000 Active 62 DOM
-
2026-06-17days on market $175,000 Active 61 DOM
-
2026-06-16days on market $175,000 Active 60 DOM
-
2026-06-15days on market $175,000 Active 59 DOM
-
2026-06-14days on market $175,000 Active 57 DOM
-
2026-06-12days on market $175,000 Active 56 DOM
-
2026-06-09days on market $175,000 Active 53 DOM
-
2026-06-08days on market $175,000 Active 52 DOM
-
2026-06-07days on market $175,000 Active 51 DOM
-
2026-06-05days on market $175,000 Active 48 DOM
-
2026-06-03days on market $175,000 Active 47 DOM
-
2026-06-02days on market $175,000 Active 46 DOM
-
2026-06-01days on market $175,000 Active 45 DOM
-
2026-05-31days on market $175,000 Active 44 DOM
-
2026-05-30days on market $175,000 Active 43 DOM
-
2026-04-17$175,000 Active
ⓘ Source: listings_history table (triggers on properties + properties_extension) + one-shot
backfill from property_details.listing_events for pre-trigger history.
Climate risk First Street
- Flood 1/10 Low FEMA zone X (unshaded) · 0% chance over 30 yrs
- Wildfire 2/10 Low
- Heat 2/10 Low 7 d/yr ≥92°F today · 15 d/yr by 30 yrs out
- Wind 1/10 Low 100% chance of damaging wind over 30 yrs
- Air quality 2/10 Low 1 unhealthy d/yr today · 1 by 30 yrs out
Nearby sold comps map
Loading sold comps map…
Walkable amenities ~0.75 mi
Loading nearby amenities…
Taxation est. · year 1
- Rental income
- $40,992
- − Mortgage interest
- −$9,803
- − Property taxes
- −$2,625
- − Insurance
- −$875
- − Repairs & maintenance
- −$3,279
- − Management
- −$3,279
- − Depreciation
- −$5,091
- Taxable income
- $16,040
- Est. tax owed @ 24.0%
- −$3,850
- After-tax cash flow
- $14,022/yr
For passive investors: Depreciation is non-cash, so a rental often shows a tax loss while cash-flowing — sheltering income. Rental losses are passive: they offset passive income freely, and up to $25,000/yr can offset ordinary (W-2) income if you actively participate and your MAGI is under $100k (phasing out to $0 by $150k); unused losses carry forward. On sale, claimed depreciation is recaptured at up to 25%, and gains may owe capital-gains tax (a 1031 exchange can defer both). Figures are a year-1 estimate at your 24.0% rate — not tax advice; consult a CPA.
Condition & rehab AI · 11 photos
This property requires extensive repairs and renovations to improve its condition and increase its value. The roof, exterior siding, flooring, interior walls, and HVAC system are all in poor condition and require major repairs. The property also needs landscaping and routine maintenance to improve its curb appeal and overall appearance.
Repairs flagged
- Major roof — The roof appears to be old and weathered, requiring a full replacement.
- Major exterior siding — The exterior siding and paint are in poor condition, requiring a full replacement.
- Major flooring — The flooring appears to be old and worn, requiring a full replacement.
- Major interior walls — The interior walls appear to be in poor condition, requiring a full renovation.
- Major HVAC system — The HVAC system appears to be old and in need of maintenance or replacement.
Value-add opportunities
- Both roof replacement — A new roof will improve the overall appearance and increase the property's value.
- Both exterior siding and paint — A new exterior siding and paint job will improve the property's appearance and increase its value.
- Both flooring replacement — New flooring will improve the property's appearance and increase its value.
- Both HVAC system replacement — A new HVAC system will improve the property's comfort and increase its value.
- Both landscaping — A well-maintained landscape will improve the property's curb appeal and increase its value.
Renovation cost estimate screening
| Repair item | Severity | Est. cost |
|---|---|---|
| roof · The roof appears to be old and weathered, requiring a full replacement. | Major | $15,000–50,000 |
| exterior siding · The exterior siding and paint are in poor condition, requiring a full replacement. | Major | $15,000–50,000 |
| flooring · The flooring appears to be old and worn, requiring a full replacement. | Major | $15,000–50,000 |
| interior walls · The interior walls appear to be in poor condition, requiring a full renovation. | Major | $15,000–50,000 |
| HVAC system · The HVAC system appears to be old and in need of maintenance or replacement. | Major | $15,000–50,000 |
| Total estimated repair cost · 5 items | $75,000–250,000 |
Value-add ROI direction
- Both roof replacement — A new roof will improve the overall appearance and increase the property's value. ↑
- Both exterior siding and paint — A new exterior siding and paint job will improve the property's appearance and increase its value. ↑
- Both flooring replacement — New flooring will improve the property's appearance and increase its value. ↑
- Both HVAC system replacement — A new HVAC system will improve the property's comfort and increase its value. ↑
- Both landscaping — A well-maintained landscape will improve the property's curb appeal and increase its value. ↑
ⓘ Cost ranges are severity-bucket heuristics (US national rule-of-thumb). Get contractor quotes + a written scope before underwriting a rehab budget.
Schools (NCES district)
- District
- Indian River Central School District
- NCES district ID
- 3615300
- Math proficiency
- 33% ▼ -21.00%
- Reading proficiency
- 50% ▲ 1.00%
- Median HH income
- $45,599
- Composite
- 35.25/100
- National rank
- #4977
- State rank
- #502 of 590 in NY
Livability — Evans Mills
- Score
- 58/100
- State rank
- #1069
- US rank
- #21403
Category grades
Schools grade is shown separately in the Schools card above.
Census & demographics
- Population (ZIP)
- 5,280
Population outlook (Jefferson County) Hauer SSP2
- Today (2025)
- 111,748 people
- By 2030
- 109,370 · -2.1%
- By 2040
- 103,828 · -7.1%
- By 2050
- 98,523 · -11.8%
- By 2075
- 91,422 · -18.2%
- By 2100
- 78,214 · -30.0%
Race, ethnicity, and origin ACS 2023
- Neighborhood character
- Diverse neighborhood (Simpson 0.64)
- Race & ethnicity
- White 54% Hispanic / Latino 22% Two or more races 14% Black 12% Pacific Islander 3%
- Hispanic origin (detail)
- Mexican 7% Puerto Rican 3%
- Common ancestry
- Romanian 4% Lithuanian 2% Serbian 1%
- Foreign-born
- 11% · Canada, Jamaica
- Languages at home
- 79% English-only · Spanish 10% German/W. Germanic 3% French/Haitian/Cajun 3%
Political lean MEDSL · Jefferson
- 2024 margin
- Strong R (+23.6) · D 38.2% · R 61.8%
- 2008→2024 swing
- -18.3pp toward R · 2008: -5.3pp · 2024: -23.6pp
- All cycles
- 2024: R+23.6 2020: R+19.0 2016: R+22.4 2012: R+2.9 2008: R+5.3
Not yet ingested
- Civics
- —
Market trends
- HPI YoY
- ▲ 9.04%
- Current HPI
- 402.6102
- Rent YoY
- —
- Metro
- —
- State GDP YoY
- ▲ 2.60%
- F500 in state
- 92
Industry mix (Fortune 500 HQ in NY)
| Industry | F500 HQs | Revenue |
|---|---|---|
| Financial Services | 10 | $950B |
|
||
| Consumer Goods | 9 | $162B |
|
||
| Insurance | 4 | $225B |
|
||
| Telecommunications | 2 | $144B |
|
||
| Pharmaceuticals | 2 | $112B |
|
||
| Media / Entertainment | 2 | $69B |
|
||
Price history
1 event — show timeline
- 2026-04-17 Listed $175,000 CNYIS
Cash-flow waterfall
monthlySold comps — $/sqft
last 12 mo · ≤1 miLoading sold comps…