 Duplex
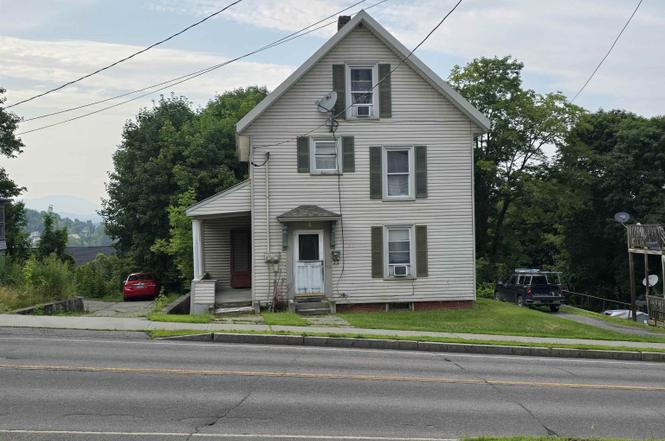
110 Pleasant St · Newport, VT
Flood risk 1/10 · Minimal
- FEMA flood zone
- X
- Chance of flooding over 30 yrs
- 0.0%
- Est. flood insurance / yr
- $473 – $860
Fire risk 1/10 · Minimal
- Est. fire insurance / yr
- $480 – $892
Heat risk 2/10 · Minimal
- Hot days now (above 90°F)
- 7 days/yr
- Hot days in 30 yrs
- 17 days/yr
Wind risk 2/10 · Minimal
- Chance of severe wind over 30 yrs
- 4.0%
Air-quality risk 2/10 · Minimal
- Unhealthy air days now
- 1 days/yr
- Unhealthy air days in 30 yrs
- 1 days/yr
Risk factors via First Street. Map © Google.
Why this score? — see what drove the C+ grade
The composite is a weighted blend of 9 inputs, each scored 0–100. Each bar is that input's sub-score; the figure is the points it added to the 100-point composite (weight × sub-score).
- Cash flow +26.3/30.0
- Appreciation +10.0/10.0
- DSCR +8.9/10.0
- 1% rule +6.3/10.0
- Schools +5.0/10.0
- Livability +3.0/5.0
- Rent growth +2.5/5.0
- Condition / age +2.5/5.0
- ARV discount +0.0/15.0
$199,500
🖨 Deal sheet (PDF) 📄 Offer letter ✓ Due diligence
Multi-family units
County records classify this as Multi-Family (2-4 Unit). Listing-text estimate: 2 units. confirmed
Listing remarks
Charming Duplex Downtown Newport. Don’t miss this great duplex located just steps from downtown Newport and Lake Memphremagog. Whether you’re investing or planning to live in one unit and rent the other, this property offers flexibility and value. • 1st Floor: Kitchen/dining area, full bath, large bedroom, and deck • 2nd Floor: Kitchen, dining room, living room, two bedrooms, and 1.5 baths Walk to local shops, dining, and waterfront amenities while enjoying all that Newport has to offer. Strong rental potential in a prime location.
Key facts
- Covered porch
- Steel roof
- Back deck
Tags
Property features AI
Exterior
- Parking: 1-car garage
- Utilities: Public sewer; Public water; Cable available; Telephone available; High-speed internet available
- Home design: Apartment building style; Existing structure; Built in 1860
- Construction: Metal roof; Vinyl siding; Built in 1860
- Exterior features: City lot in town; Gravel driveway; Metal roof; Vinyl siding; Tan exterior color; Paved, publicly maintained road frontage (67 ft)
Interior
- Kitchen: Includes domestic water heater
- Bedrooms: One 1-bedroom unit; One 2-bedroom unit
- Flooring: Combination of carpet, hardwood and vinyl flooring
- Bathrooms: Two full bathrooms total (one in each unit)
- Heating & cooling: Baseboard heating; Hot water heating; No central cooling
- Interior features: Basement with interior access; Basement has concrete floor and stairs to basement
- Laundry & utility: 100 amp electric service
Neighborhood map
What this means for you Summary
Snapshot
- This is a 2 × 3-bed/1.5-bath units multifamily listed at $200k.
Deal economics
- At list price, monthly cash flow is $518 ($6k/yr) — positive. Per door: $259/mo.
- The deal already cash-flows at list — no discount required.
- Meets the 1% rule at list price ($2k rent vs $200k).
- Recommended offer: $176k (12.0% below list) — sets the bar for market timing.
- Cap rate 9.4% vs local median 2.3% in Newport — top-decile yield for the area; either an underpriced asset or a hidden risk that comps aren't pricing in. Stress-test before assuming the spread holds.
Location & tenants
- Location reads 59/100 on livability (#99 in VT) — a working-class tenant base; expect higher turnover. Strengths: cost of living A+, housing A-; Watch: employment C-, crime F, amenities F.
- Zoned schools: Newport City Elementary School (math 32% / reading 32%, grade F, #129 of 192 statewide, top 70%, 313 students, 71% FRL).
- Market conditions: 47 active listings in the ZIP; 157 units permitted in Orleans County in 2024 (107 in 5+ unit buildings).
Forward outlook
- In year one you build about $21k of equity ($1k loan paydown + $20k appreciation (10.0% local appreciation)).
- Orleans County population projected at -19% by 2050 — secular population decline; favor cash flow + early exit over multi-decade hold.
- At projected returns (10.0% appreciation + 3.0% rent growth), your $56k cash investment doubles in ~2 years — after that, you're playing with house money.
- By year 2, paydown + projected appreciation supports a ~$34k cash-out refi (75% LTV) — recoverable capital for the next deal without selling this one.
Negotiation context
- It's been on market 341 days — a 12% lower offer ($176k) is reasonable based on typical stale-listing flexibility.
- Current owner paid $30k; list at $200k implies a 557% gain — meaningful room to come down on a strong offer.
Risks & watch-outs
- Watch-outs: built in 1860 — expect roof / HVAC / electrical / plumbing capex.
Questions for the listing agent
- It's been on market 341 days. Have you received any prior offers? Is the seller open to a 12% concession, seller financing, or rate buy-down credit?
- Can we see the unit-by-unit rent roll, current vacancy, and any below-market leases? What's the average tenancy length?
- What capital expenditures (roof, boiler, parking lot, exteriors) have been made in the last 5 years, and what's planned in the next 2?
- Built in 1860 — when were the roof, HVAC, electrical panel, plumbing, and water heater last replaced?
- Why hasn't it sold? Are there any deal-killer items the seller is aware of (foundation, flood, title, zoning, code violations)?
- Is there a deadline driving the sale (1031 exchange, divorce, estate, relocation)? That informs how much negotiation room exists.
- Schools are D-rated, which usually means shorter tenancies and higher turnover. Who's the typical renter profile here, and what's been the actual vacancy rate?
- Crime grade is F in this area — have there been break-ins, vandalism, or insurance claims at this property in the last 3 years? What carrier currently insures it and at what premium?
- What's the average days-on-market for RENTAL listings here right now (not sales)? A rising rental-DOM trend means longer vacancies and softer asking-rent achievability than the comps imply.
- What's the recent tenant-quality profile in this submarket — average credit score on applications, eviction rate, late-payment / NSF rate, and stable-employment percentage? A property-management company in the area should have these aggregated.
- How much new apartment / multifamily construction is in the pipeline within 1–3 miles? Heavy new supply (>2% of stock underway) typically softens rents 12–24 months out; light construction supports rent growth.
Investment metrics
- 1% rule
- 1.13% ✓
- Cap rate
- 9.41%
- Cash-on-cash
- 11.12%
- DSCR
- 1.49
- GRM
- 7.4
CMA / ARV
- ARV (on-the-fly)
- $159,236
- Comps found
- 2
Show comp detail 2 sales within ~0.75 mi
| Address | Dist | Beds/Ba | Sqft | Sold | Price | $/sf | Match |
|---|---|---|---|---|---|---|---|
| 56 Eastern Ave | 0.27mi | 3/2.0 | 2,058 (-0%) | 2mo | $150,000 | $73 | 83 |
| 212 Pleasant St | 0.11mi | 4/2.0 (+1) | 2,184 (+6%) | 9mo | $169,000 | $77 | 71 |
Match score weights: distance 35% · size 25% · config 20% · recency 20%. Top-matched comps best support the ARV.
Projected returns pro-forma
10.0% appreciation · 3.0% rent growth · sell at horizon
- IRR
- 32.4%
- Equity multiple
- 3.53×
- Total profit
- $141,595
- Equity at exit
- $179,725
- IRR
- 28.0%
- Equity multiple
- 8.00×
- Total profit
- $390,962
- Equity at exit
- $387,585
Cash invested: $55,860 (down + closing). Projections, not guarantees.
Landlord ↔ Tenant lean methodology
- Overall (STATE)
- 41 Moderately Tenant-Leaning
- State Vermont
- 41 Moderately Tenant-Leaning · D+15
- County
- — inherits STATE
- City
- — inherits STATE
ZIP-level market 05855
- Home prices YoY
- 8.7%
- Active inventory
- 47
- Price-to-rent
- 14.8×
Monthly cashflow live
- Estimated rent
- $2,251 medium interval (Pro) →
- Mortgage (P&I)
- −$1,046
- Tax from tax record
- −$131 /mo · $1,574/yr
- Insurance
- −$83
- HOA
- −$0
- Vacancy / Maint / Mgmt
- −$473
- Net cashflow
- $518
Break-even live
Sensitivity live
| Price | -10% $631 | -5% $574 | +0% $518 | +5% $461 | +10% $405 |
|---|---|---|---|---|---|
| Rent | -10% $340 | -5% $429 | +0% $518 | +5% $607 | +10% $696 |
| Rate | -1.0pp $618 | -0.5pp $569 | base $518 | +0.5pp $466 | +1.0pp $414 |
2-unit breakdown (identical units grouped — click to expand)
| Units | Beds | Baths | Est. rent |
|---|---|---|---|
| 2× units | 3 | 1.5 | $2,252 |
| #1 | 3 | 1.5 | $1,126 |
| #2 | 3 | 1.5 | $1,126 |
| Total (2 units) | $2,251 | ||
UW: 25.0% down · 7.5% · 30yr · 1.5% tax · 5.0% vac · 8.0% maint · 8.0% mgmt
Financing live
Cash to close
- Down payment
- $49,875
- Closing costs
- $5,985
- Reserves months
- —
- Total cash needed
- —
Loan-product check · same deal, 3 products live
Conventional
25% down · 7.5% · 30yr
- Down + closing
- —
- Monthly P&I
- —
- Monthly cashflow
- —
- DSCR
- —
- Eligible?
- —
Personal DTI + credit; lowest rate.
DSCR
20% down · 8.5% · 30yr
- Down + closing
- —
- Monthly P&I
- —
- Monthly cashflow
- —
- DSCR
- —
- Eligible?
- —
No personal income docs; deal must DSCR.
Hard money
10% down · 12.0% · 12mo
- Down + closing
- —
- Monthly P&I
- —
- Monthly cashflow
- —
- DSCR
- —
- Eligible?
- —
Short-term bridge; refi at stabilization.
Listing history 21 events
-
2026-06-21days on market $199,500 Active 341 DOM
-
2026-06-21days on market $199,500 Active 340 DOM
-
2026-06-18days on market $199,500 Active 338 DOM
-
2026-06-17days on market $199,500 Active 337 DOM
-
2026-06-16days on market $199,500 Active 336 DOM
-
2026-06-15days on market $199,500 Active 335 DOM
-
2026-06-15days on market $199,500 Active 334 DOM
-
2026-06-13days on market $199,500 Active 333 DOM
-
2026-06-12days on market $199,500 Active 332 DOM
-
2026-06-09days on market $199,500 Active 329 DOM
-
2026-06-08days on market $199,500 Active 328 DOM
-
2026-06-08days on market $199,500 Active 327 DOM
-
2026-06-07days on market $199,500 Active 326 DOM
-
2026-06-05days on market $199,500 Active 325 DOM
-
2026-06-03days on market $199,500 Active 323 DOM
-
2026-06-02days on market $199,500 Active 322 DOM
-
2026-06-01days on market $199,500 Active 321 DOM
-
2026-05-31days on market $199,500 Active 320 DOM
-
2025-08-13price $199,500
-
2025-07-14$219,000 Active
-
2004-06-15soldstatus $30,361
ⓘ Source: listings_history table (triggers on properties + properties_extension) + one-shot
backfill from property_details.listing_events for pre-trigger history.
Tax reassessment forecast VT · Partial reset (capped growth)
- Current annual tax
- $1,574 · $131/mo
- Projected year-2 tax
- $2,682 · $224/mo
- Expected delta
- +$1,108/yr (+$92/mo · 70.4%)
ⓘ Screening estimate from a state-policy table — verify with the county assessor before closing.
Climate risk First Street
- Flood 1/10 Low FEMA zone X · 0% chance over 30 yrs
- Wildfire 1/10 Low
- Heat 2/10 Low 7 d/yr ≥90°F today · 17 d/yr by 30 yrs out
- Wind 2/10 Low 4% chance of damaging wind over 30 yrs
- Air quality 2/10 Low 1 unhealthy d/yr today · 1 by 30 yrs out
Nearby sold comps map
Loading sold comps map…
Walkable amenities ~0.75 mi
Loading nearby amenities…
Taxation est. · year 1
- Rental income
- $27,012
- − Mortgage interest
- −$11,175
- − Property taxes
- −$1,574
- − Insurance
- −$998
- − Repairs & maintenance
- −$2,161
- − Management
- −$2,161
- − Depreciation
- −$5,804
- Taxable income
- $3,140
- Est. tax owed @ 24.0%
- −$754
- After-tax cash flow
- $5,460/yr
For passive investors: Depreciation is non-cash, so a rental often shows a tax loss while cash-flowing — sheltering income. Rental losses are passive: they offset passive income freely, and up to $25,000/yr can offset ordinary (W-2) income if you actively participate and your MAGI is under $100k (phasing out to $0 by $150k); unused losses carry forward. On sale, claimed depreciation is recaptured at up to 25%, and gains may owe capital-gains tax (a 1031 exchange can defer both). Figures are a year-1 estimate at your 24.0% rate — not tax advice; consult a CPA.
Schools (NCES district)
No district data.
Livability — Newport
- Score
- 59/100
- State rank
- #99
- US rank
- #20247
Category grades
Schools grade is shown separately in the Schools card above.
Census & demographics
- Census place
- Newport, VT
- Population (ZIP)
- 7,576
Population outlook (Orleans County) Hauer SSP2
- Today (2025)
- 26,222 people
- By 2030
- 25,399 · -3.1%
- By 2040
- 23,350 · -11.0%
- By 2050
- 21,232 · -19.0%
- By 2075
- 16,543 · -36.9%
- By 2100
- 11,566 · -55.9%
Race, ethnicity, and origin ACS 2023
- Neighborhood character
- Predominantly White (93%)
- Race & ethnicity
- White 93% Two or more races 4% Black 2%
- Common ancestry
- Lithuanian 5% Slovak 4% Romanian 2%
- Foreign-born
- 4% · Canada, China
- Languages at home
- 95% English-only · French/Haitian/Cajun 2% German/W. Germanic 1% Chinese 1%
Political lean MEDSL · Orleans
- 2024 margin
- Toss-up / Even · D 47.8% · R 49.4% · Other 2.8%
- 2008→2024 swing
- -29.1pp toward R · 2008: 27.5pp · 2024: -1.6pp
- All cycles
- 2024: R+1.6 2020: D+4.5 2016: D+0.2 2012: D+24.2 2008: D+27.5
Not yet ingested
- Civics
- —
Market trends
- HPI YoY
- ▲ 23.71%
- Current HPI
- 297.9538
- Rent YoY
- —
- Metro
- —
- State GDP YoY
- —
- F500 in state
- 0
Price history
+557.1% since first listed3 events — show timeline
- 2025-08-13 Price Changed $199,500 PrimeMLS
- 2025-07-14 Listed $219,000 PrimeMLS
- 2004-06-15 Sold (Public Records) $30,361 Public Records
Property tax history
-4.4%/yrLatest (2024): $1,574 · +8.7% YoY. Source: county tax records.
Cash-flow waterfall
monthlySold comps — $/sqft
last 12 mo · ≤1 miLoading sold comps…