3200 Sound Dr · Greenport West, NY
Flood risk 1/10 · Minimal
- FEMA flood zone
- X (unshaded)
- Chance of flooding over 30 yrs
- 0.0%
- Est. flood insurance / yr
- $473 – $860
Fire risk 1/10 · Minimal
- Est. fire insurance / yr
- $691 – $1,283
Heat risk 5/10 · Moderate
- Hot days now (above 90°F)
- 7 days/yr
- Hot days in 30 yrs
- 19 days/yr
Wind risk 8/10 · Major
- Chance of severe wind over 30 yrs
- 80.0%
Air-quality risk 3/10 · Minor
- Unhealthy air days now
- 3 days/yr
- Unhealthy air days in 30 yrs
- 4 days/yr
Risk factors via First Street. Map © Google.
Why this score? — see what drove the C+ grade
The composite is a weighted blend of 9 inputs, each scored 0–100. Each bar is that input's sub-score; the figure is the points it added to the 100-point composite (weight × sub-score).
- Cash flow +30.0/30.0
- DSCR +10.0/10.0
- 1% rule +7.9/10.0
- Schools +4.5/10.0
- Livability +2.9/5.0
- Rent growth +2.5/5.0
- Condition / age +2.5/5.0
- ARV discount +0.0/15.0
- Appreciation +0.0/10.0
$2,350,000
🖨 Deal sheet (PDF) 📄 Offer letter ✓ Due diligence
Listing remarks
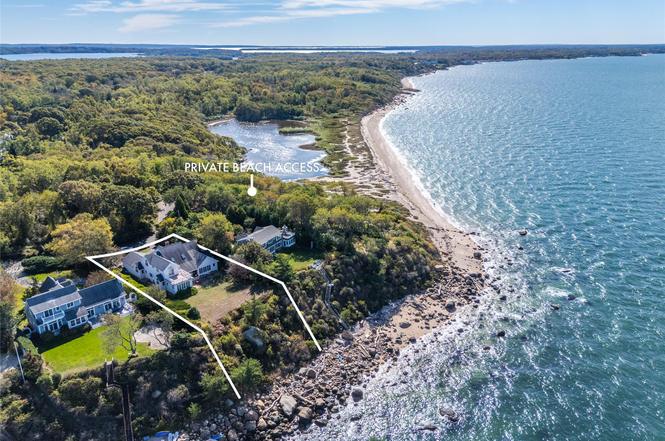
Set directly on the Long Island Sound, this waterfront home offers a rare opportunity to create something truly special in an exceptional location. Enjoy spectacular sunsets and water views from this gracious residence featuring 4 bedrooms and 3 full baths, including a primary suite on the first floor. The open floor plan is anchored by a spacious great room with a wood-burning fireplace, ideal for relaxed coastal living and entertaining. A full basement with high ceilings provides excellent potential for additional finished living space. Additional highlights include a generator, roof replaced in 2015, and deeded beach rights with beach access just a stone’s throw away. With vision a
Key facts
- Water views
- Waterfront home
- Primary suite
Tags
Neighborhood map
What this means for you Summary
Snapshot
- This is a 4-bed/3.0-bath single-family listed at $2.35M.
Deal economics
- At list price, monthly cash flow is $9k ($112k/yr) — positive.
- The deal already cash-flows at list — no discount required.
- Meets the 1% rule at list price ($30k rent vs $2.35M).
- Recommended offer: $2.28M (3.0% below list) — sets the bar for market timing.
- Cap rate 11.1% vs local median 8.1% in Greenport West — top-decile yield for the area; either an underpriced asset or a hidden risk that comps aren't pricing in. Stress-test before assuming the spread holds.
Location & tenants
- Location reads 58/100 on livability (#1,073 in NY) — a working-class tenant base; expect higher turnover. Strengths: crime A+, employment A+; Watch: amenities F, commute F, cost of living F.
- Greenport Union Free School District (town): math 55% / reading 45% proficiency, ranked #450 of 755 in NY (top 60%) — acceptable for families but not a draw, mixed tenant base, ~2y average lease.
- Zoned schools: Greenport Elementary School (math 47% / reading 62%, grade C, #908 of 2,108 statewide, top 46%, 339 students, 61% FRL); Greenport High School (math 52% / reading 54%, grade C-, #934 of 1,100 statewide, top 86%, 356 students, 63% FRL).
- Market conditions: 69 active listings in the ZIP; 5 comparable units currently listed for rent nearby; rentals lingering (median 45d on market — plan ~5-8 weeks vacancy on turnover, expect pricing pressure); 100% of comp listings sitting > 30 days — soft ceiling on asking rent; 1,366 units permitted in Suffolk County in 2024 (216 in 5+ unit buildings).
Forward outlook
- Local home prices are declining (-3.0%/yr); year-one equity from $16k of loan paydown is wiped out by about $70k of value loss. Plan a longer hold.
- Suffolk County population projected to shrink 5% by 2050 — rents likely to lag national; underwrite the cash flow, not the appreciation.
- At projected returns (-3.0% appreciation + 3.0% rent growth), your $658k cash investment doubles in ~8 years — after that, you're playing with house money.
Negotiation context
- It's been on market 60 days — a 3% lower offer ($2.28M) is reasonable based on typical stale-listing flexibility.
- Current owner paid $185k; list at $2.35M implies a 1170% gain — meaningful room to come down on a strong offer.
Risks & watch-outs
- Climate carrying-cost: severe wind risk, 80% chance of damaging wind over 30y; extreme-heat days projected 7→19/yr by 2055 (HVAC capex compounding) — expect insurance premiums to compound above CPI over the hold.
Questions for the listing agent
- It's been on market 60 days. Have you received any prior offers? Is the seller open to a 3% concession, seller financing, or rate buy-down credit?
- What does the HOA fee cover, when was the last increase, and are there any pending special assessments or reserve-fund shortfalls?
- Is there a deadline driving the sale (1031 exchange, divorce, estate, relocation)? That informs how much negotiation room exists.
- Schools are D-rated, which usually means shorter tenancies and higher turnover. Who's the typical renter profile here, and what's been the actual vacancy rate?
- What's the average days-on-market for RENTAL listings here right now (not sales)? A rising rental-DOM trend means longer vacancies and softer asking-rent achievability than the comps imply.
- What's the recent tenant-quality profile in this submarket — average credit score on applications, eviction rate, late-payment / NSF rate, and stable-employment percentage? A property-management company in the area should have these aggregated.
- How much new for-sale + rental construction is in the pipeline within 1–3 miles? Heavy new supply typically softens prices + rents 12–24 months out; constrained supply supports both.
Investment metrics
- 1% rule
- 1.29% ✓
- Cap rate
- 11.08%
- Cash-on-cash
- 17.08%
- DSCR
- 1.76
- GRM
- 6.5
CMA / ARV
- ARV (on-the-fly)
- $1,695,155
- Comps found
- 7
Show comp detail 7 sales within ~0.75 mi
| Address | Dist | Beds/Ba | Sqft | Sold | Price | $/sf | Match |
|---|---|---|---|---|---|---|---|
| 3200 Sound Dr | 0.00mi | 4/3.0 | 3,145 (0%) | 1mo | $2,142,500 | $681 | 99 |
| 2375 Sound Dr | 0.14mi | 5/5.5 (+1) | 3,200 (+2%) | 0mo | $2,150,000 | $672 | 75 |
| 1000 Green Hill Ln | 0.26mi | 4/2.5 | 3,400 (+8%) | 4mo | $1,450,000 | $426 | 69 |
| 695 Sound Dr | 0.44mi | 5/3.0 (+1) | 3,393 (+8%) | 8mo | $2,163,000 | $637 | 54 |
| 155 Caiola Ct | 0.35mi | 4/3.5 | 3,500 (+11%) | 11mo | $1,885,000 | $539 | 54 |
| 1075 Moores Ln N | 0.21mi | 4/4.0 | 2,900 (-8%) | 24mo | $1,475,000 | $509 | 54 |
| 135 Sunset Ln | 0.58mi | 4/5.0 | 3,200 (+2%) | 17mo | $975,000 | $305 | 48 |
Match score weights: distance 35% · size 25% · config 20% · recency 20%. Top-matched comps best support the ARV.
Projected returns pro-forma
-3.0% appreciation · 3.0% rent growth · sell at horizon
- IRR
- 8.3%
- Equity multiple
- 1.33×
- Total profit
- $215,061
- Equity at exit
- $350,393
- IRR
- 17.6%
- Equity multiple
- 2.45×
- Total profit
- $952,863
- Equity at exit
- $203,185
Cash invested: $658,000 (down + closing). Projections, not guarantees.
Landlord ↔ Tenant lean methodology
- Overall (STATE)
- 15 Strongly Tenant-Friendly
- State New York
- 15 Strongly Tenant-Friendly · D+10
- County
- — inherits STATE
- City
- — inherits STATE
ZIP-level market 11944
- Home prices YoY
- -23.7%
- Active inventory
- 69
- Price-to-rent
- 6.5×
Monthly cashflow live
- Estimated rent
- $30,229 medium interval (Pro) →
- Mortgage (P&I)
- −$12,324
- Tax from tax record
- −$1,200 /mo · $14,399/yr
- Insurance
- −$979
- HOA
- −$13
- Vacancy / Maint / Mgmt
- −$6,348
- Net cashflow
- $9,365
Break-even live
Sensitivity live
| Price | -10% $10,695 | -5% $10,030 | +0% $9,365 | +5% $8,700 | +10% $8,035 |
|---|---|---|---|---|---|
| Rent | -10% $6,977 | -5% $8,171 | +0% $9,365 | +5% $10,559 | +10% $11,753 |
| Rate | -1.0pp $10,549 | -0.5pp $9,963 | base $9,365 | +0.5pp $8,756 | +1.0pp $8,137 |
UW: 25.0% down · 7.5% · 30yr · 1.5% tax · 5.0% vac · 8.0% maint · 8.0% mgmt
Financing live
Cash to close
- Down payment
- $587,500
- Closing costs
- $70,500
- Reserves months
- —
- Total cash needed
- —
Loan-product check · same deal, 3 products live
Conventional
25% down · 7.5% · 30yr
- Down + closing
- —
- Monthly P&I
- —
- Monthly cashflow
- —
- DSCR
- —
- Eligible?
- —
Personal DTI + credit; lowest rate.
DSCR
20% down · 8.5% · 30yr
- Down + closing
- —
- Monthly P&I
- —
- Monthly cashflow
- —
- DSCR
- —
- Eligible?
- —
No personal income docs; deal must DSCR.
Hard money
10% down · 12.0% · 12mo
- Down + closing
- —
- Monthly P&I
- —
- Monthly cashflow
- —
- DSCR
- —
- Eligible?
- —
Short-term bridge; refi at stabilization.
Rent comps 5 comps
| Address | Beds | Baths | Sqft | Rent | $/sqft | DOM | Units | Dist |
|---|---|---|---|---|---|---|---|---|
| 2700 Sound Dr Greenport, NY | 5.0 | 3.0 | 3700 | $25,000 | $6.76 | 45d | 1 | 0.06mi |
| 1000 Sound Dr Greenport, NY | 5.0 | 4.5 | 3700 | $45,000 | $12.16 | 45d | 1 | 0.38mi |
| 950 Tasker Ln Greenport, NY | 4.0 | 3.5 | 3500 | $36,000 | $10.29 | 45d | 1 | 0.45mi |
| 64230 North Rd Greenport, NY | 4.0 | 3.0 | 2800 | $6,500 | $2.32 | 45d | 1 | 0.69mi |
| 63615 North Rd Greenport, NY | 4.0 | 4.5 | 3500 | $7,000 | $2.00 | 45d | 1 | 0.72mi |
HOA detail
- Monthly dues
- $13 · $156/yr
- Likely covers
- water
Listing history 5 events
-
2026-03-21status Pending
-
2026-01-19$2,350,000 Active
-
1995-11-02soldstatus $185,000
-
1987-01-12soldstatus $200,000
-
1985-03-29soldstatus $75,000
ⓘ Source: listings_history table (triggers on properties + properties_extension) + one-shot
backfill from property_details.listing_events for pre-trigger history.
Tax reassessment forecast NY · Partial reset (capped growth)
- Current annual tax
- $14,399 · $1,200/mo
- Projected year-2 tax
- $27,057 · $2,255/mo
- Expected delta
- +$12,658/yr (+$1,055/mo · 87.9%)
ⓘ Screening estimate from a state-policy table — verify with the county assessor before closing.
Climate risk First Street
- Flood 1/10 Low FEMA zone X (unshaded) · 0% chance over 30 yrs
- Wildfire 1/10 Low
- Heat 5/10 Major 7 d/yr ≥90°F today · 19 d/yr by 30 yrs out
- Wind 8/10 Severe 80% chance of damaging wind over 30 yrs
- Air quality 3/10 Moderate 3 unhealthy d/yr today · 4 by 30 yrs out
Nearby sold comps map
Loading sold comps map…
Walkable amenities ~0.75 mi
Loading nearby amenities…
Taxation est. · year 1
- Rental income
- $362,746
- − Mortgage interest
- −$131,637
- − Property taxes
- −$14,399
- − Insurance
- −$11,750
- − Repairs & maintenance
- −$29,020
- − Management
- −$29,020
- − HOA
- −$156
- − Depreciation
- −$68,364
- Taxable income
- $78,402
- Est. tax owed @ 24.0%
- −$18,816
- After-tax cash flow
- $93,564/yr
For passive investors: Depreciation is non-cash, so a rental often shows a tax loss while cash-flowing — sheltering income. Rental losses are passive: they offset passive income freely, and up to $25,000/yr can offset ordinary (W-2) income if you actively participate and your MAGI is under $100k (phasing out to $0 by $150k); unused losses carry forward. On sale, claimed depreciation is recaptured at up to 25%, and gains may owe capital-gains tax (a 1031 exchange can defer both). Figures are a year-1 estimate at your 24.0% rate — not tax advice; consult a CPA.
Schools (NCES district)
- District
- Greenport Union Free School District
- NCES district ID
- 3612840
- Math proficiency
- 55% ▲ 5.00%
- Reading proficiency
- 45% ▼ -5.00%
- Median HH income
- $54,490
- Composite
- 45.25/100
- National rank
- #5759
- State rank
- #450 of 755 in NY
Livability — Greenport West
- Score
- 58/100
- State rank
- #1073
- US rank
- #21520
Category grades
Schools grade is shown separately in the Schools card above.
Census & demographics
- Census place
- Greenport West, NY
- Population (ZIP)
- 4,744
Population outlook (Suffolk County) Hauer SSP2
- Today (2025)
- 1,505,262 people
- By 2030
- 1,498,318 · -0.5%
- By 2040
- 1,471,101 · -2.3%
- By 2050
- 1,424,848 · -5.3%
- By 2075
- 1,337,157 · -11.2%
- By 2100
- 1,217,720 · -19.1%
Race, ethnicity, and origin ACS 2023
- Neighborhood character
- Predominantly White (69%)
- Race & ethnicity
- White 69% Hispanic / Latino 23% Two or more races 6% Black 4% Asian 2%
- Hispanic origin (detail)
- Mexican 5% Puerto Rican 2%
- Common ancestry
- Romanian 6% Lithuanian 2% Subsaharan African 2%
- Foreign-born
- 19% · Canada, China
- Languages at home
- 69% English-only · Spanish 22% German/W. Germanic 3% Russian/Polish/Slavic 2%
Political lean MEDSL · Suffolk
- 2024 margin
- Lean R (+10.0) · D 45.0% · R 55.0%
- 2008→2024 swing
- -16.0pp toward R · 2008: 6.0pp · 2024: -10.0pp
- All cycles
- 2024: R+10.0 2020: R+0.0 2016: R+8.2 2012: D+2.9 2008: D+6.0
Not yet ingested
- Civics
- —
Market trends
- HPI YoY
- ▼ -143.97%
- Current HPI
- 462.3431
- Rent YoY
- —
- Metro
- —
- State GDP YoY
- ▲ 2.60%
- F500 in state
- 92
Industry mix (Fortune 500 HQ in NY)
| Industry | F500 HQs | Revenue |
|---|---|---|
| Financial Services | 10 | $950B |
|
||
| Consumer Goods | 9 | $162B |
|
||
| Insurance | 4 | $225B |
|
||
| Telecommunications | 2 | $144B |
|
||
| Pharmaceuticals | 2 | $112B |
|
||
| Media / Entertainment | 2 | $69B |
|
||
Price history
+3033.3% since first listed5 events — show timeline
- 2026-03-21 Pending — OneKey® MLS as Distributed by MLS Grid
- 2026-01-19 Listed $2,350,000 OneKey® MLS as Distributed by MLS Grid
- 1995-11-02 Sold (Public Records) $185,000 Public Records
- 1987-01-12 Sold (Public Records) $200,000 Public Records
- 1985-03-29 Sold (Public Records) $75,000 Public Records
Property tax history
+0.3%/yrLatest (2025): $14,399 · +0.0% YoY. Source: county tax records.
Cash-flow waterfall
monthlySold comps — $/sqft
last 12 mo · ≤1 miLoading sold comps…