 Multi-family
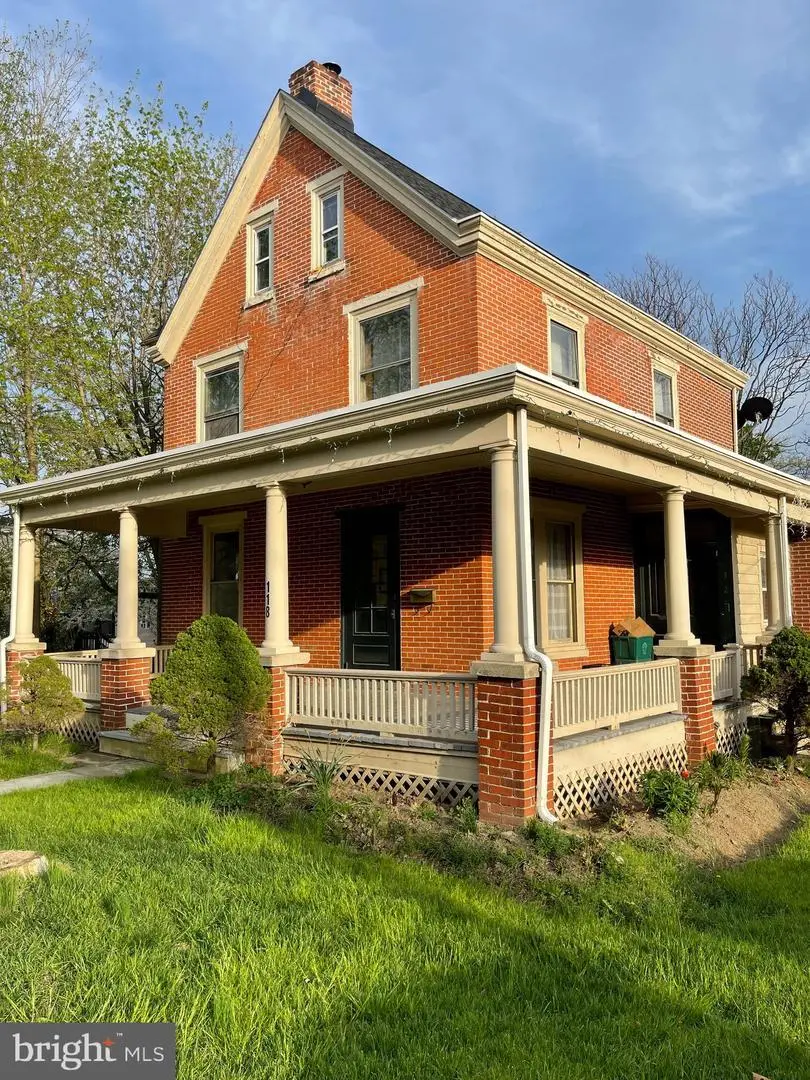
118 W Evergreen St · West Grove, PA
Flood risk No data
- FEMA flood zone
- —
- Chance of flooding over 30 yrs
- —
- Est. flood insurance / yr
- —
Fire risk No data
- Est. fire insurance / yr
- —
Heat risk No data
- Hot days now (above threshold)
- —
- Hot days in 30 yrs
- —
Wind risk No data
- Chance of severe wind over 30 yrs
- —
Air-quality risk No data
- Unhealthy air days now
- —
- Unhealthy air days in 30 yrs
- —
Risk factors via First Street. Map © Google.
Why this score? — see what drove the B grade
The composite is a weighted blend of 9 inputs, each scored 0–100. Each bar is that input's sub-score; the figure is the points it added to the 100-point composite (weight × sub-score).
- Cash flow +30.0/30.0
- 1% rule +10.0/10.0
- DSCR +10.0/10.0
- ARV discount +7.3/15.0
- Schools +5.3/10.0
- Livability +4.0/5.0
- Rent growth +2.5/5.0
- Condition / age +2.0/5.0
- Appreciation +0.0/10.0
$325,000
🖨 Deal sheet (PDF) 📄 Offer letter ✓ Due diligence
Multi-family units
County records classify this as Multi-Family (2-4 Unit). Listing-text estimate: 1 unit. estimate disagrees with records
Listing remarks
Investor Alert in the heart of West Grove! This versatile mixed-use property offers strong income potential with three residential units plus a two-room office suite, all ideally positioned in a prime in-town location. The residential component includes (2) one-bedroom, one-bath apartments and (1) efficiency unit with full bath, providing multiple streams of rental income. (all on month to month lease) In addition, the two-room office suite presents an excellent opportunity for professional use, small business occupancy, or future value-add improvements. The property features electric service with two meters: • Meter #1 services the first-floor apartment, office space, and likely exter
Key facts
- Oil burner boiler
- 0.26 acre lot
- Built 1900
Tags
Neighborhood map
What this means for you Summary
Snapshot
- This is a 2-bed/3.0-bath multifamily listed at $325k. Condition is rated fair.
Deal economics
- At list price, monthly cash flow is $3k ($32k/yr) — positive.
- The deal already cash-flows at list — no discount required.
- Meets the 1% rule at list price ($6k rent vs $325k).
- Cap rate 16.2% vs local median 1.8% in West Grove — top-decile yield for the area; either an underpriced asset or a hidden risk that comps aren't pricing in. Stress-test before assuming the spread holds.
Location & tenants
- Location reads 81/100 on livability (#183 in PA, #1,542 nationally) — a professional / high-income tenant draw. Strengths: crime A+, housing A+, employment A; Watch: amenities F, commute F.
- Avon Grove SD (suburban): math 54% / reading 61% proficiency, ranked #63 of 539 in PA (top 12%) — acceptable for families but not a draw, mixed tenant base, ~2y average lease.
- Zoned schools: Avon Grove Intrmd Sch (math 48% / reading 58%, grade C, #571 of 1,518 statewide, top 38%, 1,457 students, 32% FRL); Fred S Engle Ms (math 49% / reading 69%, grade B, #50 of 512 statewide, top 10%, 819 students, 30% FRL); Avon Grove Hs (math 80% / reading 24%, grade C-, #112 of 437 statewide, top 26%, 1,747 students, 24% FRL).
- Market conditions: 73 active listings in the ZIP; 1,513 units permitted in Chester County in 2024 (354 in 5+ unit buildings).
Forward outlook
- Local home prices are declining (-3.0%/yr); year-one equity from $2k of loan paydown is wiped out by about $10k of value loss. Plan a longer hold.
- Chester County population projected at +6% by 2050 — modest demand growth; plan on rents tracking national, not racing it.
- At projected returns (-3.0% appreciation + 3.0% rent growth), your $91k cash investment doubles in ~4 years — after that, you're playing with house money.
Negotiation context
- Only 1 days on market — expect competitive offers; lowballing is unlikely to land.
Risks & watch-outs
- Watch-outs: built in 1900 — expect roof / HVAC / electrical / plumbing capex.
Questions for the listing agent
- Have any recent inspections been done? Can we get a copy of the seller's disclosures and any deferred-maintenance estimates?
- Built in 1900 — when were the roof, HVAC, electrical panel, plumbing, and water heater last replaced?
- Is there a deadline driving the sale (1031 exchange, divorce, estate, relocation)? That informs how much negotiation room exists.
- Schools are B-rated — typically a magnet for longer-tenancy family renters. What's the average tenant stay here, and is there a school-zone premium baked into asking?
- What's the average days-on-market for RENTAL listings here right now (not sales)? A rising rental-DOM trend means longer vacancies and softer asking-rent achievability than the comps imply.
- What's the recent tenant-quality profile in this submarket — average credit score on applications, eviction rate, late-payment / NSF rate, and stable-employment percentage? A property-management company in the area should have these aggregated.
- How much new apartment / multifamily construction is in the pipeline within 1–3 miles? Heavy new supply (>2% of stock underway) typically softens rents 12–24 months out; light construction supports rent growth.
Investment metrics
- 1% rule
- 1.92% ✓
- Cap rate
- 16.25%
- Cash-on-cash
- 35.55%
- DSCR
- 2.58
- GRM
- 4.3
CMA / ARV
- ARV (on-the-fly)
- $323,361
- Comps found
- 1
Show comp detail 1 sale within ~0.75 mi
| Address | Dist | Beds/Ba | Sqft | Sold | Price | $/sf | Match |
|---|---|---|---|---|---|---|---|
| 118 W Evergreen St | 0.00mi | 2/3.0 | 3,477 (0%) | 1mo | $325,000 | $93 | 100 |
Match score weights: distance 35% · size 25% · config 20% · recency 20%. Top-matched comps best support the ARV.
Projected returns pro-forma
-3.0% appreciation · 3.0% rent growth · sell at horizon
- IRR
- 31.2%
- Equity multiple
- 2.31×
- Total profit
- $119,155
- Equity at exit
- $48,459
- IRR
- 38.4%
- Equity multiple
- 4.57×
- Total profit
- $325,265
- Equity at exit
- $28,100
Cash invested: $91,000 (down + closing). Projections, not guarantees.
Landlord ↔ Tenant lean methodology
- Overall (STATE)
- 62 Landlord-Friendly
- State Pennsylvania
- 62 Landlord-Friendly · EVEN
- County
- — inherits STATE
- City
- — inherits STATE
ZIP-level market 19390
- Home prices YoY
- -27.7%
- Active inventory
- 73
- Price-to-rent
- 13.0×
Monthly cashflow live
- Estimated rent
- $6,256 medium interval (Pro) →
- Mortgage (P&I)
- −$1,704
- Tax est. 1.5%
- −$406 /mo · $4,875/yr
- Insurance
- −$135
- HOA
- −$0
- Vacancy / Maint / Mgmt
- −$1,314
- Net cashflow
- $2,696
Break-even live
Sensitivity live
| Price | -10% $2,921 | -5% $2,809 | +0% $2,696 | +5% $2,584 | +10% $2,472 |
|---|---|---|---|---|---|
| Rent | -10% $2,202 | -5% $2,449 | +0% $2,696 | +5% $2,943 | +10% $3,190 |
| Rate | -1.0pp $2,860 | -0.5pp $2,779 | base $2,696 | +0.5pp $2,612 | +1.0pp $2,526 |
3-unit breakdown (identical units grouped — click to expand)
| Units | Beds | Baths | Est. rent |
|---|---|---|---|
| 3× units | 1 | 1 | $6,255 |
| #1 | 1 | 1 | $2,085 |
| #2 | 1 | 1 | $2,085 |
| #3 | 1 | 1 | $2,085 |
| Total (3 units) | $6,256 | ||
UW: 25.0% down · 7.5% · 30yr · 1.5% tax · 5.0% vac · 8.0% maint · 8.0% mgmt
Financing live
Cash to close
- Down payment
- $81,250
- Closing costs
- $9,750
- Reserves months
- —
- Total cash needed
- —
Loan-product check · same deal, 3 products live
Conventional
25% down · 7.5% · 30yr
- Down + closing
- —
- Monthly P&I
- —
- Monthly cashflow
- —
- DSCR
- —
- Eligible?
- —
Personal DTI + credit; lowest rate.
DSCR
20% down · 8.5% · 30yr
- Down + closing
- —
- Monthly P&I
- —
- Monthly cashflow
- —
- DSCR
- —
- Eligible?
- —
No personal income docs; deal must DSCR.
Hard money
10% down · 12.0% · 12mo
- Down + closing
- —
- Monthly P&I
- —
- Monthly cashflow
- —
- DSCR
- —
- Eligible?
- —
Short-term bridge; refi at stabilization.
Listing history 2 events
-
2026-04-16status Pending
-
2026-04-15$325,000 Active
ⓘ Source: listings_history table (triggers on properties + properties_extension) + one-shot
backfill from property_details.listing_events for pre-trigger history.
Nearby sold comps map
Loading sold comps map…
Walkable amenities ~0.75 mi
Loading nearby amenities…
Taxation est. · year 1
- Rental income
- $75,072
- − Mortgage interest
- −$18,205
- − Property taxes
- −$4,875
- − Insurance
- −$1,625
- − Repairs & maintenance
- −$6,006
- − Management
- −$6,006
- − Depreciation
- −$9,455
- Taxable income
- $28,901
- Est. tax owed @ 24.0%
- −$6,936
- After-tax cash flow
- $25,419/yr
For passive investors: Depreciation is non-cash, so a rental often shows a tax loss while cash-flowing — sheltering income. Rental losses are passive: they offset passive income freely, and up to $25,000/yr can offset ordinary (W-2) income if you actively participate and your MAGI is under $100k (phasing out to $0 by $150k); unused losses carry forward. On sale, claimed depreciation is recaptured at up to 25%, and gains may owe capital-gains tax (a 1031 exchange can defer both). Figures are a year-1 estimate at your 24.0% rate — not tax advice; consult a CPA.
Condition & rehab AI · 0 photos
This multi-family property requires significant renovations to improve its condition and increase its value. Immediate updates to the kitchen, bathrooms, and exterior are recommended to attract tenants and increase both resale and rental potential.
Repairs flagged
- Major Kitchen countertops and cabinets — Severe wear and tear, likely requiring replacement.
- Major Bathroom fixtures and tiles — Outdated and worn, likely requiring replacement.
- Major Flooring — Significant wear and tear, likely requiring replacement.
- Major Interior walls and paint — Cracks and peeling paint, likely requiring repainting.
- Major Exterior siding and paint — Peeling paint and possible rot, likely requiring replacement.
- Major Windows — Old and likely not energy-efficient, requiring replacement.
Value-add opportunities
- Both Kitchen renovation — A modern kitchen will attract more tenants and increase the property's resale value.
- Both Bathroom updates — Upgrading bathrooms will improve tenant satisfaction and increase both resale and rental value.
- Both Flooring replacement — New flooring will enhance the property's appearance and increase its value.
- Both Painting and exterior repairs — Fresh paint and repairs will improve the property's curb appeal and attract more tenants.
Renovation cost estimate screening
| Repair item | Severity | Est. cost |
|---|---|---|
| Kitchen countertops and cabinets · Severe wear and tear, likely requiring replacement. | Major | $15,000–50,000 |
| Bathroom fixtures and tiles · Outdated and worn, likely requiring replacement. | Major | $15,000–50,000 |
| Flooring · Significant wear and tear, likely requiring replacement. | Major | $15,000–50,000 |
| Interior walls and paint · Cracks and peeling paint, likely requiring repainting. | Major | $15,000–50,000 |
| Exterior siding and paint · Peeling paint and possible rot, likely requiring replacement. | Major | $15,000–50,000 |
| Windows · Old and likely not energy-efficient, requiring replacement. | Major | $15,000–50,000 |
| Total estimated repair cost · 6 items | $90,000–300,000 |
Value-add ROI direction
- Both Kitchen renovation — A modern kitchen will attract more tenants and increase the property's resale value. ↑
- Both Bathroom updates — Upgrading bathrooms will improve tenant satisfaction and increase both resale and rental value. ↑
- Both Flooring replacement — New flooring will enhance the property's appearance and increase its value. ↑
- Both Painting and exterior repairs — Fresh paint and repairs will improve the property's curb appeal and attract more tenants. ↑
ⓘ Cost ranges are severity-bucket heuristics (US national rule-of-thumb). Get contractor quotes + a written scope before underwriting a rehab budget.
Schools (NCES district)
- District
- Avon Grove SD
- NCES district ID
- 4202790
- Math proficiency
- 54% ▼ -13.00%
- Reading proficiency
- 61% ▼ -15.00%
- Median HH income
- $90,335
- Composite
- 52.84/100
- National rank
- #1536
- State rank
- #63 of 539 in PA
Livability — West Grove
- Score
- 81/100
- State rank
- #183
- US rank
- #1542
Category grades
Schools grade is shown separately in the Schools card above.
Census & demographics
- Census place
- West Grove, PA
- Population (ZIP)
- 12,049
Population outlook (Chester County) Hauer SSP2
- Today (2025)
- 546,756 people
- By 2030
- 559,441 · +2.3%
- By 2040
- 576,377 · +5.4%
- By 2050
- 580,602 · +6.2%
- By 2075
- 581,575 · +6.4%
- By 2100
- 540,922 · -1.1%
Race, ethnicity, and origin ACS 2023
- Neighborhood character
- Predominantly White (72%)
- Race & ethnicity
- White 72% Hispanic / Latino 17% Two or more races 9% Asian 5% Black 2%
- Hispanic origin (detail)
- Mexican 14% Puerto Rican 1%
- Common ancestry
- Romanian 4% Italian 3% Slovak 2%
- Foreign-born
- 9% · Canada, Vietnam, China
- Languages at home
- 86% English-only · Spanish 10% Other Asian/Pacific 1% Other Indo-European 1%
Political lean MEDSL · Chester
- 2024 margin
- D (+14.5) · D 56.7% · R 42.2% · Other 1.0%
- 2008→2024 swing
- +5.2pp toward D · 2008: 9.2pp · 2024: 14.5pp
- All cycles
- 2024: D+14.5 2020: D+17.0 2016: D+9.2 2012: R+0.4 2008: D+9.2
Not yet ingested
- Civics
- —
Market trends
- HPI YoY
- ▼ -102.59%
- Current HPI
- 268.0284
- Rent YoY
- —
- Metro
- —
- State GDP YoY
- ▲ 1.68%
- F500 in state
- 34
Industry mix (Fortune 500 HQ in PA)
| Industry | F500 HQs | Revenue |
|---|---|---|
| Healthcare | 2 | $309B |
|
||
| Insurance | 2 | $27B |
|
||
| Telecommunications / Media | 1 | $124B |
|
||
| Industrial Distribution | 1 | $22B |
|
||
| Financial Services | 1 | $20B |
|
||
| Chemicals / Materials | 1 | $18B |
|
||
Price history
2 events — show timeline
- 2026-04-16 Pending — BRIGHT MLS
- 2026-04-15 Listed $325,000 BRIGHT MLS
Cash-flow waterfall
monthlySold comps — $/sqft
last 12 mo · ≤1 miLoading sold comps…