 Multi-family
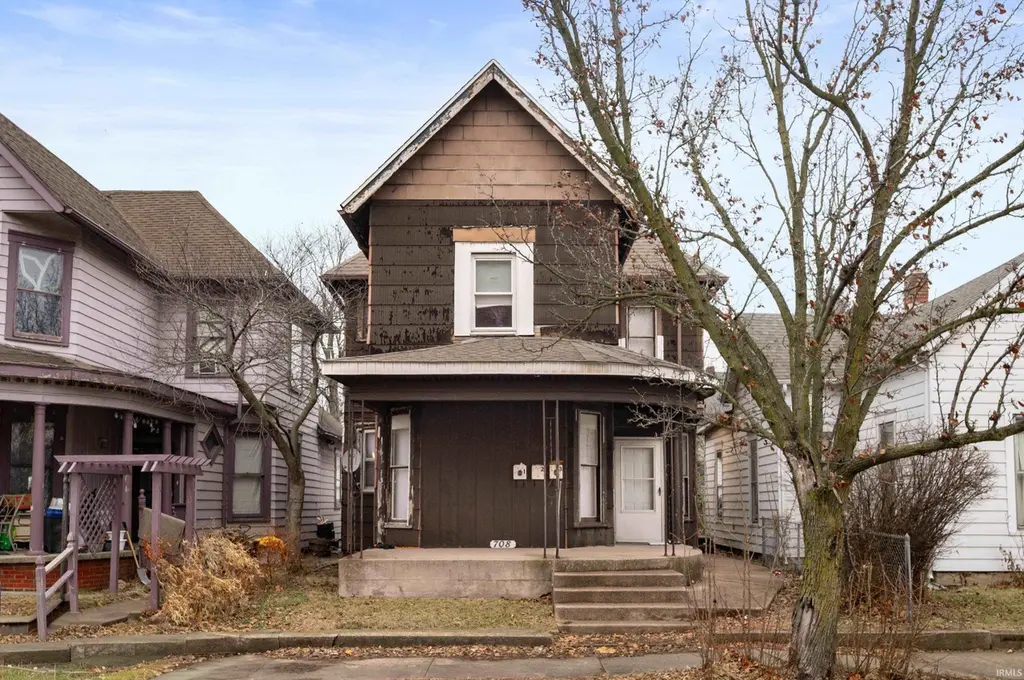
708 W Jackson St · Muncie, IN
Flood risk 1/10 · Minimal
- FEMA flood zone
- X (unshaded)
- Chance of flooding over 30 yrs
- 0.0%
- Est. flood insurance / yr
- $473 – $860
Fire risk 1/10 · Minimal
- Est. fire insurance / yr
- $717 – $1,331
Heat risk 3/10 · Minor
- Hot days now (above 100°F)
- 7 days/yr
- Hot days in 30 yrs
- 18 days/yr
Wind risk 2/10 · Minimal
- Chance of severe wind over 30 yrs
- 0.0%
Air-quality risk 3/10 · Minor
- Unhealthy air days now
- 2 days/yr
- Unhealthy air days in 30 yrs
- 3 days/yr
Risk factors via First Street. Map © Google.
Why this score? — see what drove the B+ grade
The composite is a weighted blend of 9 inputs, each scored 0–100. Each bar is that input's sub-score; the figure is the points it added to the 100-point composite (weight × sub-score).
- Cash flow +30.0/30.0
- ARV discount +10.8/15.0
- 1% rule +10.0/10.0
- DSCR +10.0/10.0
- Appreciation +7.6/10.0
- Livability +4.0/5.0
- Rent growth +3.3/5.0
- Condition / age +2.5/5.0
- Schools +1.7/10.0
$115,000
🖨 Deal sheet (PDF) 📄 Offer letter ✓ Due diligence
Multi-family units
County records classify this as Multi-Family (2-4 Unit). Listing-text estimate: 1 unit. estimate disagrees with records
Listing remarks MLS
Investment Opportunity close to downtown Muncie! This property features 3 units: two - 2 bedroom, 1 bath units, and one - 1 bedroom, 1 bath unit. The 3 units are currently leased. Gross monthly Rental income at full occupancy is $2070. Landlord pays gas. Tenants pay electricity, water, and sewage.
Key facts
- 3,920 sq ft lot
- 4 parking spots
- Built 1890
Neighborhood map
What this means for you Summary
Snapshot
- This is a 3-bed/3.0-bath multifamily listed at $115k.
Deal economics
- At list price, monthly cash flow is $1k ($16k/yr) — positive.
- The deal already cash-flows at list — no discount required.
- Meets the 1% rule at list price ($3k rent vs $115k).
- Recommended offer: $101k (12.0% below list) — sets the bar for market timing.
- Cap rate 19.8% vs local median 5.9% in Muncie — top-decile yield for the area; either an underpriced asset or a hidden risk that comps aren't pricing in. Stress-test before assuming the spread holds.
Location & tenants
- Location reads 80/100 on livability (#18 in IN, #1,654 nationally) — a professional / high-income tenant draw. Strengths: amenities A+, commute A+, cost of living A+; Watch: crime F, employment F.
- Muncie Community Schools (urban): math 18% / reading 25% proficiency, ranked #275 of 301 in IN (top 91%) — low school quality limits family demand, transient renter base, plan for 1-2y turnover; 68% free/reduced lunch — lower-income household profile, screen leases tightly.
- Zoned schools: South View Elementary School (math 8% / reading 11%, grade F, #932 of 994 statewide, top 94%, 445 students, 92% FRL); Northside Middle School (math 17% / reading 36%, grade F, #236 of 330 statewide, top 72%, 583 students, 70% FRL); Muncie Central High School (math 20% / reading 39%, 1,326 students, 70% FRL).
- Market conditions: Rents rising (+3.3%/yr); 27 active listings in the ZIP; 5 comparable units currently listed for rent nearby; rentals lingering (median 46d on market — plan ~5-8 weeks vacancy on turnover, expect pricing pressure); 100% of comp listings sitting > 30 days — soft ceiling on asking rent; lower-income renter base — watch delinquency; 171 units permitted in Delaware County in 2024 (57 in 5+ unit buildings).
Forward outlook
- In year one you build about $7k of equity ($795 loan paydown + $6k appreciation (5.3% local appreciation)).
- Delaware County population projected at -11% by 2050 — secular population decline; favor cash flow + early exit over multi-decade hold.
- At projected returns (5.3% appreciation + 3.3% rent growth), your $32k cash investment doubles in ~2 years — after that, you're playing with house money.
- By year 6, paydown + projected appreciation supports a ~$37k cash-out refi (75% LTV) — recoverable capital for the next deal without selling this one.
Negotiation context
- It's been on market 163 days — a 12% lower offer ($101k) is reasonable based on typical stale-listing flexibility.
- 3 sale attempts since 9y ago; this cycle's ask has dropped $25k (18%) from the opening price — seller is motivated, your offer sets the floor, not the list.
- Current owner paid $12k; list at $115k implies a 858% gain — meaningful room to come down on a strong offer.
Risks & watch-outs
- Watch-outs: built in 1890 — expect roof / HVAC / electrical / plumbing capex.
Questions for the listing agent
- It's been on market 163 days. Have you received any prior offers? Is the seller open to a 12% concession, seller financing, or rate buy-down credit?
- Built in 1890 — when were the roof, HVAC, electrical panel, plumbing, and water heater last replaced?
- Why hasn't it sold? Are there any deal-killer items the seller is aware of (foundation, flood, title, zoning, code violations)?
- Is there a deadline driving the sale (1031 exchange, divorce, estate, relocation)? That informs how much negotiation room exists.
- Schools are D-rated, which usually means shorter tenancies and higher turnover. Who's the typical renter profile here, and what's been the actual vacancy rate?
- Crime grade is F in this area — have there been break-ins, vandalism, or insurance claims at this property in the last 3 years? What carrier currently insures it and at what premium?
- What's the average days-on-market for RENTAL listings here right now (not sales)? A rising rental-DOM trend means longer vacancies and softer asking-rent achievability than the comps imply.
- What's the recent tenant-quality profile in this submarket — average credit score on applications, eviction rate, late-payment / NSF rate, and stable-employment percentage? A property-management company in the area should have these aggregated.
- How much new apartment / multifamily construction is in the pipeline within 1–3 miles? Heavy new supply (>2% of stock underway) typically softens rents 12–24 months out; light construction supports rent growth.
Investment metrics
- 1% rule
- 2.29% ✓
- Cap rate
- 19.83%
- Cash-on-cash
- 48.34%
- DSCR
- 3.15
- GRM
- 3.6
CMA / ARV
- ARV (median comp)
- $124,087
- List price
- $115,000
- Delta
- -7.32%
- Verdict
- FAIR
- Comps
- 20 within 1.0 mi
Show comp detail 6 sales within ~0.75 mi
| Address | Dist | Beds/Ba | Sqft | Sold | Price | $/sf | Match |
|---|---|---|---|---|---|---|---|
| 800 W Charles St | 0.13mi | 3/3.0 | 2,500 (-7%) | 10mo | $75,536 | $30 | 74 |
| 211 S Liberty St | 0.19mi | 4/4.0 (+1) | 2,928 (+8%) | 10mo | $190,000 | $65 | 60 |
| 621 E Main St | 0.73mi | 2/5.0 (-1) | 2,653 (-2%) | 10mo | $50,000 | $19 | 41 |
| 511 E Jackson St | 0.65mi | 3/3.0 | 2,448 (-9%) | 16mo | $110,000 | $45 | 41 |
| 747 N Mulberry St | 0.70mi | 4/2.0 (+1) | 2,400 (-11%) | 7mo | $89,000 | $37 | 34 |
| 100 N Calvert St | 0.68mi | 4/5.0 (+1) | 3,068 (+14%) | 7mo | $261,000 | $85 | 27 |
Match score weights: distance 35% · size 25% · config 20% · recency 20%. Top-matched comps best support the ARV.
Projected returns pro-forma
5.27% appreciation · 3.27% rent growth · sell at horizon
- IRR
- 56.6%
- Equity multiple
- 4.47×
- Total profit
- $111,686
- Equity at exit
- $67,095
- IRR
- 54.3%
- Equity multiple
- 9.29×
- Total profit
- $266,867
- Equity at exit
- $117,421
Cash invested: $32,200 (down + closing). Projections, not guarantees.
Landlord ↔ Tenant lean methodology
- Overall (STATE)
- 90 Strongly Landlord-Friendly
- State Indiana
- 90 Strongly Landlord-Friendly · R+11
- County
- — inherits STATE
- City
- — inherits STATE
ZIP-level market 47305
- Home prices YoY
- 2.0%
- Rents YoY
- 3.3%
- Active inventory
- 27
- Price-to-rent
- 10.6×
Monthly cashflow live
- Estimated rent
- $2,629 high interval (Pro) →
- Mortgage (P&I)
- −$603
- Tax from tax record
- −$129 /mo · $1,544/yr
- Insurance
- −$48
- HOA
- −$0
- Vacancy / Maint / Mgmt
- −$552
- Net cashflow
- $1,297
Break-even live
Sensitivity live
| Price | -10% $1,362 | -5% $1,330 | +0% $1,297 | +5% $1,265 | +10% $1,232 |
|---|---|---|---|---|---|
| Rent | -10% $1,090 | -5% $1,193 | +0% $1,297 | +5% $1,401 | +10% $1,505 |
| Rate | -1.0pp $1,355 | -0.5pp $1,327 | base $1,297 | +0.5pp $1,267 | +1.0pp $1,237 |
3-unit breakdown (identical units grouped — click to expand)
| Units | Beds | Baths | Est. rent |
|---|---|---|---|
| 2× units | 2 | 1 | $1,810 |
| #1 | 2 | 1 | $905 |
| #2 | 2 | 1 | $905 |
| 1× unit | 1 | 1 | $818 |
| Total (3 units) | $2,629 | ||
UW: 25.0% down · 7.5% · 30yr · 1.5% tax · 5.0% vac · 8.0% maint · 8.0% mgmt
Financing live
Cash to close
- Down payment
- $28,750
- Closing costs
- $3,450
- Reserves months
- —
- Total cash needed
- —
Loan-product check · same deal, 3 products live
Conventional
25% down · 7.5% · 30yr
- Down + closing
- —
- Monthly P&I
- —
- Monthly cashflow
- —
- DSCR
- —
- Eligible?
- —
Personal DTI + credit; lowest rate.
DSCR
20% down · 8.5% · 30yr
- Down + closing
- —
- Monthly P&I
- —
- Monthly cashflow
- —
- DSCR
- —
- Eligible?
- —
No personal income docs; deal must DSCR.
Hard money
10% down · 12.0% · 12mo
- Down + closing
- —
- Monthly P&I
- —
- Monthly cashflow
- —
- DSCR
- —
- Eligible?
- —
Short-term bridge; refi at stabilization.
Rent comps 5 comps
| Address | Beds | Baths | Sqft | Rent | $/sqft | DOM | Units | Dist |
|---|---|---|---|---|---|---|---|---|
| 614 W Charles St Muncie, IN | 2.0 | 1.0 | 3266 | $775 | $0.24 | 45d | 1 | 0.13mi |
| 312 S Calvert St Muncie, IN | 3.0 | 1.0 | 1813 | $1,500 | $0.83 | 45d | 1 | 0.67mi |
| 328 S Talley Ave Muncie, IN | 2.0 | 1.0 | 1770 | $1,400 | $0.79 | 45d | 1 | 0.85mi |
| 2201 W Euclid Ave Muncie, IN | 3.0 | 1.0 | 1844 | $1,200 | $0.65 | 45d | 1 | 1.35mi |
| 1901 N Maplewood Ave Muncie, IN | 4.0 | 1.5 | 1887 | $1,700 | $0.90 | 45d | 1 | 1.40mi |
Listing history 25 events
-
2026-06-22days on market $115,000 Active 163 DOM
-
2026-06-19days on market $115,000 Active 161 DOM
-
2026-06-18days on market $115,000 Active 160 DOM
-
2026-06-17price $115,000 Active 159 DOM
-
2026-06-17days on market $124,999 Active 159 DOM
-
2026-06-16days on market $124,999 Active 158 DOM
-
2026-06-15days on market $124,999 Active 157 DOM
-
2026-06-14days on market $124,999 Active 155 DOM
-
2026-06-13days on market $124,999 Active 154 DOM
-
2026-06-10days on market $124,999 Active 152 DOM
-
2026-06-09days on market $124,999 Active 151 DOM
-
2026-06-08days on market $124,999 Active 150 DOM
-
2026-06-07days on market $124,999 Active 149 DOM
-
2026-06-05days on market $124,999 Active 146 DOM
-
2026-06-03days on market $124,999 Active 145 DOM
-
2026-06-02days on market $124,999 Active 144 DOM
-
2026-06-01days on market $124,999 Active 143 DOM
-
2026-05-31days on market $124,999 Active 142 DOM
-
2026-05-30days on market $124,999 Active 141 DOM
-
2026-04-28price $124,999
Show marketing remark (300 chars)
Investment Opportunity close to downtown Muncie! This property features 3 units: two - 2 bedroom, 1 bath units, and one - 1 bedroom, 1 bath unit. The 3 units are currently leased. Gross monthly Rental income at full occupancy is $2070. Landlord pays gas. Tenants pay electricity, water, and sewage.
-
2026-04-28price $124,999 300-char remark
Show marketing remark (300 chars)
Investment Opportunity close to downtown Muncie! This property features 3 units: two - 2 bedroom, 1 bath units, and one - 1 bedroom, 1 bath unit. The 3 units are currently leased. Gross monthly Rental income at full occupancy is $2070. Landlord pays gas. Tenants pay electricity, water, and sewage.
-
2026-01-09$139,900 Active 300-char remark
Show marketing remark (300 chars)
Investment Opportunity close to downtown Muncie! This property features 3 units: two - 2 bedroom, 1 bath units, and one - 1 bedroom, 1 bath unit. The 3 units are currently leased. Gross monthly Rental income at full occupancy is $2070. Landlord pays gas. Tenants pay electricity, water, and sewage.
-
2026-01-09$139,900 Active
Show marketing remark (300 chars)
Investment Opportunity close to downtown Muncie! This property features 3 units: two - 2 bedroom, 1 bath units, and one - 1 bedroom, 1 bath unit. The 3 units are currently leased. Gross monthly Rental income at full occupancy is $2070. Landlord pays gas. Tenants pay electricity, water, and sewage.
-
2018-04-26soldstatus $12,000
-
2017-06-08$19,900
ⓘ Source: listings_history table (triggers on properties + properties_extension) + one-shot
backfill from property_details.listing_events for pre-trigger history.
Tax reassessment forecast IN · Partial reset (capped growth)
- Current annual tax
- $1,544 · $129/mo
- Projected year-2 tax
- $1,544 · $129/mo
- Expected delta
- $0/yr ($0/mo · 0.0%)
ⓘ Screening estimate from a state-policy table — verify with the county assessor before closing.
Climate risk First Street
- Flood 1/10 Low FEMA zone X (unshaded) · 0% chance over 30 yrs
- Wildfire 1/10 Low
- Heat 3/10 Moderate 7 d/yr ≥100°F today · 18 d/yr by 30 yrs out
- Wind 2/10 Low 0% chance of damaging wind over 30 yrs
- Air quality 3/10 Moderate 2 unhealthy d/yr today · 3 by 30 yrs out
Nearby sold comps map
Loading sold comps map…
Walkable amenities ~0.75 mi
Loading nearby amenities…
Taxation est. · year 1
- Rental income
- $31,548
- − Mortgage interest
- −$6,442
- − Property taxes
- −$1,544
- − Insurance
- −$575
- − Repairs & maintenance
- −$2,524
- − Management
- −$2,524
- − Depreciation
- −$3,345
- Taxable income
- $14,594
- Est. tax owed @ 24.0%
- −$3,503
- After-tax cash flow
- $12,064/yr
For passive investors: Depreciation is non-cash, so a rental often shows a tax loss while cash-flowing — sheltering income. Rental losses are passive: they offset passive income freely, and up to $25,000/yr can offset ordinary (W-2) income if you actively participate and your MAGI is under $100k (phasing out to $0 by $150k); unused losses carry forward. On sale, claimed depreciation is recaptured at up to 25%, and gains may owe capital-gains tax (a 1031 exchange can defer both). Figures are a year-1 estimate at your 24.0% rate — not tax advice; consult a CPA.
Schools (NCES district)
- District
- Muncie Community Schools
- NCES district ID
- 1807320
- Math proficiency
- 18% ▼ -9.00%
- Reading proficiency
- 25% ▼ -4.00%
- Median HH income
- $30,052
- Composite
- 17.22/100
- National rank
- #9099
- State rank
- #275 of 301 in IN
Livability — Muncie
- Score
- 80/100
- State rank
- #18
- US rank
- #1654
Category grades
Schools grade is shown separately in the Schools card above.
Census & demographics
- Census place
- Muncie, IN
- County
- Delaware County · 84,658 people
- City population
- 84,658
- Metro
- Muncie, IN
- Population (ZIP)
- 3,556
- Household income
- $36,389
- Rent vs Own
- Severe rent burden
- 336.0
Population outlook (Delaware County) Hauer SSP2
- Today (2025)
- 113,036 people
- By 2030
- 111,313 · -1.5%
- By 2040
- 106,432 · -5.8%
- By 2050
- 100,747 · -10.9%
- By 2075
- 91,000 · -19.5%
- By 2100
- 80,687 · -28.6%
Race, ethnicity, and origin ACS 2023
- Neighborhood character
- Diverse neighborhood (Simpson 0.60)
- Race & ethnicity
- White 62% Two or more races 24% Black 8% Hispanic / Latino 7%
- Hispanic origin (detail)
- Mexican 6%
- Common ancestry
- Italian 4% Iranian 1% Lithuanian 1%
- Foreign-born
- 1%
- Languages at home
- 96% English-only · Spanish 2% Arabic 1% Other Asian/Pacific 1%
Political lean MEDSL · Delaware
- 2024 margin
- R (+15.8) · D 41.2% · R 57.0% · Other 1.8%
- 2008→2024 swing
- -30.8pp toward R · 2008: 15.0pp · 2024: -15.8pp
- All cycles
- 2024: R+15.8 2020: R+13.2 2016: R+13.7 2012: D+3.1 2008: D+15.0
Not yet ingested
- Civics
- —
Market trends
- HPI YoY
- ▲ 5.27%
- Current HPI
- 269.888
- Rent YoY
- ▲ 3.27%
- Metro
- Muncie, IN
- State GDP YoY
- ▲ 2.90%
- F500 in state
- 18
Industry mix (Fortune 500 HQ in IN)
| Industry | F500 HQs | Revenue |
|---|---|---|
| Industrial Machinery | 2 | $37B |
|
||
| Healthcare | 1 | $177B |
|
||
| Pharmaceuticals | 1 | $45B |
|
||
| Metals / Steel | 1 | $18B |
|
||
| Agriculture | 1 | $17B |
|
||
| Packaging | 1 | $12B |
|
||
Price history
+528.1% since first listed6 events — show timeline
- 2026-04-28 Price Changed $124,999 MIBOR as Distributed by MLS Grid
- 2026-04-28 Price Changed $124,999 IRMLS
- 2026-01-09 Listed $139,900 IRMLS
- 2026-01-09 Listed $139,900 MIBOR as Distributed by MLS Grid
- 2018-04-26 Sold (MLS) $12,000 IRMLS
- 2017-06-08 Listed $19,900 IRMLS
Property tax history
+0.8%/yrLatest (2024): $1,544 · +18.4% YoY. Source: county tax records.
Cash-flow waterfall
monthlySold comps — $/sqft
last 12 mo · ≤1 miLoading sold comps…