1234 Arrow Ln #81 · Boise City, ID
Flood risk No data
- FEMA flood zone
- —
- Chance of flooding over 30 yrs
- —
- Est. flood insurance / yr
- —
Fire risk No data
- Est. fire insurance / yr
- —
Heat risk No data
- Hot days now (above threshold)
- —
- Hot days in 30 yrs
- —
Wind risk No data
- Chance of severe wind over 30 yrs
- —
Air-quality risk No data
- Unhealthy air days now
- —
- Unhealthy air days in 30 yrs
- —
Risk factors via First Street. Map © Google.
Why this score? — see what drove the B- grade
The composite is a weighted blend of 9 inputs, each scored 0–100. Each bar is that input's sub-score; the figure is the points it added to the 100-point composite (weight × sub-score).
- Cash flow +26.9/30.0
- DSCR +9.3/10.0
- ARV discount +8.1/15.0
- 1% rule +7.2/10.0
- Schools +4.2/10.0
- Condition / age +4.0/5.0
- Rent growth +3.0/5.0
- Livability +2.5/5.0
- Appreciation +0.0/10.0
$149,900
🖨 Deal sheet (PDF) 📄 Offer letter ✓ Due diligence
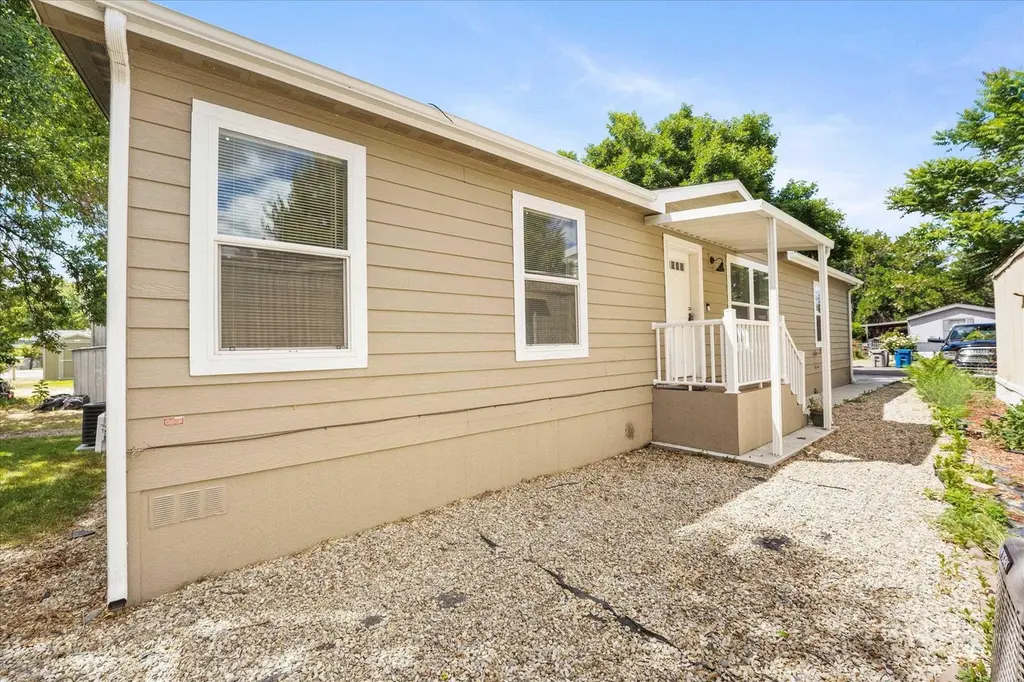
Listing remarks
The Prairie Dune Champion model by Skyline has open floorplan. 3BR and 2 baths. Spacious living and good size bedrooms. Lots of light . Vaulted ceilings, laundry room, Split bedroom design. Built-in Pool in community. Backyard and parking pad. Rental price includes sewer and trash. Space rent is $844.71
Key facts
- Split bedroom design
- Laundry room
- Open floorplan
Tags
Property features AI
Finance
- HOA & community: Community pool; Located in Maple Grove Estates (mobile home park)
Exterior
- Parking: Finished driveway
- Utilities: City water service; Sewer connected; Cable connected
- Home design: Mobile/manufactured home on a rented lot; Built in 2023
- Construction: Built by Skyline Homes; Crawl space foundation; Composition roofing
- Exterior features: Composition roof; Storage shed; Auto sprinkler system; Small lot (approximately 5,999 SF); Located in a mobile home park; Paved road access; Community pool
Interior
- Kitchen: Dishwasher; Disposal; Microwave; Freestanding oven/range; Refrigerator; Kitchen island; Breakfast bar; Laminate counters
- Bedrooms: 3 bedrooms, all on the main level (Primary: ~11 x 14; Bedroom 2: ~12 x 11; Bedroom 3: ~11 x 11)
- Bathrooms: 2 bathrooms
- Heating & cooling: Electric forced-air heating; Central air conditioning; Electric water heater
- Interior features: Main-level master bedroom; Walk-in closet(s); Breakfast bar; Kitchen island; Laminate countertops
- Laundry & utility: Washer; Dryer; Utility room on the main level (approx. 7 x 5)
Neighborhood map
What this means for you Summary
Snapshot
- This is a 3-bed/2.0-bath manufactured listed at $150k. Condition is rated good.
Deal economics
- At list price, monthly cash flow is $413 ($5k/yr) — positive.
- The deal already cash-flows at list — no discount required.
- Meets the 1% rule at list price ($2k rent vs $150k).
- Cap rate 9.6% vs local median 2.6% in Boise City — top-decile yield for the area; either an underpriced asset or a hidden risk that comps aren't pricing in. Stress-test before assuming the spread holds.
Location & tenants
- Location reads: area grade B — affects rentability + tenant quality, not the cash-flow math above.
- Boise Independent District (urban): math 42% / reading 56% proficiency, ranked #36 of 92 in ID (top 39%) — families likely to look elsewhere, expect single-tenant / working-renter base with shorter leases.
- Zoned schools: Horizon Elementary School (math 26% / reading 38%, grade F, #294 of 357 statewide, top 85%, 484 students, 56% FRL); Fairmont Junior High School (math 23% / reading 44%, grade F, #87 of 109 statewide, top 80%, 677 students, 41% FRL); Capital Senior High School (math 34% / reading 57%, grade D-, #59 of 169 statewide, top 35%, 1,220 students, 28% FRL).
- Zoned-school proficiency averages 37% at this address vs 49% district-wide (-12 pts) — the specific schools serving this property underperform the Boise Independent District average; the district grade overstates school quality for this exact location.
- Market conditions: Rents rising (+1.9%/yr); 194 active listings in the ZIP; 30 comparable units currently listed for rent nearby; rentals at typical pace (median 17d on market — plan ~3-4 weeks tenant-placement turnaround); 5,129 units permitted in Ada County in 2024 (414 in 5+ unit buildings).
Forward outlook
- Local home prices are declining (-3.0%/yr); year-one equity from $1k of loan paydown is wiped out by about $4k of value loss. Plan a longer hold.
- Ada County population projected at +45% by 2050 — long-run rental-demand tailwind backs the buy-and-hold thesis.
Negotiation context
- Only 9 days on market — expect competitive offers; lowballing is unlikely to land.
Questions for the listing agent
- Is there a deadline driving the sale (1031 exchange, divorce, estate, relocation)? That informs how much negotiation room exists.
- What's the average days-on-market for RENTAL listings here right now (not sales)? A rising rental-DOM trend means longer vacancies and softer asking-rent achievability than the comps imply.
- What's the recent tenant-quality profile in this submarket — average credit score on applications, eviction rate, late-payment / NSF rate, and stable-employment percentage? A property-management company in the area should have these aggregated.
- How much new for-sale + rental construction is in the pipeline within 1–3 miles? Heavy new supply typically softens prices + rents 12–24 months out; constrained supply supports both.
Investment metrics
- 1% rule
- 1.22% ✓
- Cap rate
- 9.60%
- Cash-on-cash
- 11.81%
- DSCR
- 1.53
- GRM
- 6.8
CMA / ARV
- ARV (on-the-fly)
- $151,872
- Comps found
- 10
Show comp detail 10 sales within ~0.75 mi
| Address | Dist | Beds/Ba | Sqft | Sold | Price | $/sf | Match |
|---|---|---|---|---|---|---|---|
| 1251 N Arrow Ln | 0.02mi | 3/2.0 | 1,352 (+1%) | 13mo | $105,000 | $78 | 87 |
| 1351 N Oakwood Ln | 0.07mi | 4/2.0 (+1) | 1,296 (-4%) | 9mo | $85,000 | $66 | 79 |
| 1386 N Arrow Ln | 0.05mi | 3/2.0 | 1,152 (-14%) | 0mo | $120,000 | $104 | 74 |
| 1096 Sable Ln | 0.13mi | 3/2.0 | 1,152 (-14%) | 6mo | $119,900 | $104 | 65 |
| 8483 W Irving Ln | 0.21mi | 4/2.0 (+1) | 1,510 (+12%) | 0mo | $160,000 | $106 | 64 |
| 1067 N Elk Ln | 0.12mi | 3/2.0 | 1,152 (-14%) | 7mo | $130,000 | $113 | 64 |
| 1309 N Oakwood Ln | 0.05mi | 3/2.0 | 1,152 (-14%) | 23mo | $160,000 | $139 | 55 |
| 1385 N Oakwood Ln | 0.08mi | 3/2.0 | 1,152 (-14%) | 23mo | $129,990 | $113 | 53 |
| 9307 W Florence St | 0.35mi | 3/2.0 | 1,152 (-14%) | 10mo | $269,900 | $234 | 52 |
| 2300 N Iris Ln | 0.74mi | 3/2.0 | 1,152 (-14%) | 8mo | $139,000 | $121 | 35 |
Match score weights: distance 35% · size 25% · config 20% · recency 20%. Top-matched comps best support the ARV.
Projected returns pro-forma
-3.0% appreciation · 1.95% rent growth · sell at horizon
- IRR
- 0.1%
- Equity multiple
- 1.00×
- Total profit
- $120
- Equity at exit
- $22,351
- IRR
- 8.6%
- Equity multiple
- 1.63×
- Total profit
- $26,379
- Equity at exit
- $12,961
Cash invested: $41,972 (down + closing). Projections, not guarantees.
Landlord ↔ Tenant lean methodology
- Overall (STATE)
- 91 Strongly Landlord-Friendly
- State Idaho
- 91 Strongly Landlord-Friendly · R+18
- County
- — inherits STATE
- City
- — inherits STATE
ZIP-level market 83704
- Rents YoY
- 1.9%
- Active inventory
- 194
- Price-to-rent
- 6.8×
Monthly cashflow live
- Estimated rent
- $1,834 high interval (Pro) →
- Mortgage (P&I)
- −$786
- Tax est. 1.5%
- −$187 /mo · $2,248/yr
- Insurance
- −$62
- HOA
- −$0
- Vacancy / Maint / Mgmt
- −$385
- Net cashflow
- $413
Break-even live
Sensitivity live
| Price | -10% $517 | -5% $465 | +0% $413 | +5% $361 | +10% $309 |
|---|---|---|---|---|---|
| Rent | -10% $268 | -5% $340 | +0% $413 | +5% $485 | +10% $558 |
| Rate | -1.0pp $488 | -0.5pp $451 | base $413 | +0.5pp $374 | +1.0pp $335 |
UW: 25.0% down · 7.5% · 30yr · 1.5% tax · 5.0% vac · 8.0% maint · 8.0% mgmt
Financing live
Cash to close
- Down payment
- $37,475
- Closing costs
- $4,497
- Reserves months
- —
- Total cash needed
- —
Loan-product check · same deal, 3 products live
Conventional
25% down · 7.5% · 30yr
- Down + closing
- —
- Monthly P&I
- —
- Monthly cashflow
- —
- DSCR
- —
- Eligible?
- —
Personal DTI + credit; lowest rate.
DSCR
20% down · 8.5% · 30yr
- Down + closing
- —
- Monthly P&I
- —
- Monthly cashflow
- —
- DSCR
- —
- Eligible?
- —
No personal income docs; deal must DSCR.
Hard money
10% down · 12.0% · 12mo
- Down + closing
- —
- Monthly P&I
- —
- Monthly cashflow
- —
- DSCR
- —
- Eligible?
- —
Short-term bridge; refi at stabilization.
Rent comps 30 comps
| Address | Beds | Baths | Sqft | Rent | $/sqft | DOM | Units | Dist |
|---|---|---|---|---|---|---|---|---|
| 930 N Maple Grove Rd Boise, ID | 1.0–3.0 | 1.0–2.0 | 950 | $2,333 | $2.46 | 5d | 14 | 0.14mi |
| 8973 W Irving St Bldg 6 Boise, ID | 3.0 | 2.5 | 1524 | $2,250 | $1.48 | 16d | 1 | 0.15mi |
| 9130 W Irving St Boise, ID | 2.0 | 1.5 | 952 | $1,575 | $1.65 | 5d | 5 | 0.25mi |
| 9846 W Rosecroft Ct #102 Boise, ID | 2.0 | 2.5 | 1236 | $1,545 | $1.25 | 5d | 1 | 0.72mi |
| 9993 W Rosecroft Ct #101 Boise, ID | 2.0 | 2.5 | 1136 | $1,575 | $1.39 | 5d | 1 | 0.79mi |
| 9169 W Cory Ln #202 Boise, ID | 2.0 | 1.5 | 968 | $1,395 | $1.44 | 23d | 1 | 0.79mi |
| 10105 W Garverdale Ln Ste 201 Boise, ID | 2.0 | 2.0 | 915 | $1,350 | $1.48 | 16d | 1 | 0.91mi |
| 10096 W Garverdale Ln Boise, ID | 3.0 | 2.0 | 1113 | $1,600 | $1.44 | 25d | 1 | 0.91mi |
| 9056 W Sigmont Ln Unit 201 Boise, ID | 2.0 | 2.0 | 900 | $1,300 | $1.44 | 16d | 1 | 1.11mi |
| 8834 W Pine Valley Ln Unit 1 Boise, ID | 3.0 | 2.5 | 1427 | $1,925 | $1.35 | 14d | 1 | 1.18mi |
| 8786 W Pine Valley Ln Unit 1 Boise, ID | 3.0 | 2.5 | 1340 | $1,975 | $1.47 | 21d | 1 | 1.19mi |
| 9113 W Ustick Rd Unit 102 Boise, ID | 2.0 | 2.0 | 1000 | $1,525 | $1.52 | 25d | 1 | 1.21mi |
| 657 White Cloud Dr Boise, ID | 2.0 | 1.0 | 950 | $1,345 | $1.42 | 5d | 1 | 1.23mi |
| 9131 W Ustick Rd Unit 104 Boise, ID | 2.0 | 2.0 | 1000 | $1,595 | $1.59 | 14d | 1 | 1.24mi |
| 697 White Cloud Dr Boise, ID | 2.0 | 1.0 | 921 | $1,450 | $1.57 | 25d | 1 | 1.25mi |
| 1452 N Allumbaugh St Boise, ID | 2.0 | 2.5 | 1100 | $1,525 | $1.39 | 14d | 1 | 1.26mi |
| 950 N Allumbaugh St Boise, ID | 2.0 | 1.0 | 902 | $1,505 | $1.67 | 4d | 2 | 1.28mi |
| 6739 W Colehaven Dr Boise, ID | 2.0 | 2.0 | 1000 | $1,450 | $1.45 | 25d | 1 | 1.28mi |
| 7521 W Tottenham Ln Apt 202 Boise, ID | 3.0 | 2.0 | 1113 | $1,595 | $1.43 | 25d | 1 | 1.28mi |
| 6724 W Irving St Boise, ID | 2.0 | 2.0 | 1000 | $1,450 | $1.45 | 14d | 1 | 1.29mi |
| 6677 W Colehaven Dr Boise, ID | 2.0 | 2.0 | 1000 | $1,450 | $1.45 | 25d | 1 | 1.31mi |
| 6660 W Colehaven Dr Boise, ID | 2.0 | 2.0 | 1000 | $1,450 | $1.45 | 25d | 1 | 1.33mi |
| 1407 N Fry Ln Boise, ID | 2.0 | 2.0 | 1000 | $1,450 | $1.45 | 5d | 1 | 1.34mi |
| 6641 W Colehaven Dr Boise, ID | 2.0 | 2.0 | 1000 | $1,450 | $1.45 | 25d | 1 | 1.34mi |
| 6758 W Clinton Ln Boise, ID | 2.0 | 1.0 | 900 | $1,345 | $1.49 | 25d | 1 | 1.35mi |
| 6652 W Irving St Boise, ID | 2.0 | 2.0 | 1000 | $1,450 | $1.45 | 25d | 1 | 1.36mi |
| 1406 N Fry Ln Boise, ID | 2.0 | 2.0 | 1000 | $1,450 | $1.45 | 5d | 1 | 1.36mi |
| 1411 N Liberty St Boise, ID | 2.0–4.0 | 1.5–2.0 | 1630 | $1,620 | $0.99 | 25d | 1 | 1.45mi |
| 8077 S Cummins Ave Boise, ID | 2.0 | 1.0 | 900 | $1,495 | $1.66 | 5d | 1 | 1.47mi |
| 1105 N Liberty St Boise, ID | 1.0–2.0 | 1.0 | 727 | $1,949 | $2.68 | 16d | 4 | 1.47mi |
Listing history 7 events
-
2026-06-22days on market $149,900 Active 9 DOM
-
2026-06-18days on market $149,900 Active 6 DOM
-
2026-06-17days on market $149,900 Active 5 DOM
-
2026-06-16days on market $149,900 Active 4 DOM
-
2026-06-15days on market $149,900 Active 3 DOM
-
2026-06-13remarks 304-char remark
-
2026-06-13$149,900 Active 1 DOM
ⓘ Source: listings_history table (triggers on properties + properties_extension) + one-shot
backfill from property_details.listing_events for pre-trigger history.
Nearby sold comps map
Loading sold comps map…
Walkable amenities ~0.75 mi
Loading nearby amenities…
Taxation est. · year 1
- Rental income
- $22,008
- − Mortgage interest
- −$8,397
- − Property taxes
- −$2,248
- − Insurance
- −$750
- − Repairs & maintenance
- −$1,761
- − Management
- −$1,761
- − Depreciation
- −$4,361
- Taxable income
- $2,731
- Est. tax owed @ 24.0%
- −$656
- After-tax cash flow
- $4,300/yr
For passive investors: Depreciation is non-cash, so a rental often shows a tax loss while cash-flowing — sheltering income. Rental losses are passive: they offset passive income freely, and up to $25,000/yr can offset ordinary (W-2) income if you actively participate and your MAGI is under $100k (phasing out to $0 by $150k); unused losses carry forward. On sale, claimed depreciation is recaptured at up to 25%, and gains may owe capital-gains tax (a 1031 exchange can defer both). Figures are a year-1 estimate at your 24.0% rate — not tax advice; consult a CPA.
Condition & rehab AI · 13 photos
This manufactured home is in good condition with a good condition score of 80. It has a good kitchen, bathrooms, and exterior. The home is move-in ready with minor cosmetic updates needed.
Value-add opportunities
- Both paint exterior — enhances curb appeal and resale value
- Both landscape front yard — improves curb appeal and rental value
- Both install new flooring in bathrooms — enhances resale and rental value
Renovation cost estimate screening
Value-add ROI direction
- Both paint exterior — enhances curb appeal and resale value ↑
- Both landscape front yard — improves curb appeal and rental value ↑
- Both install new flooring in bathrooms — enhances resale and rental value ↑
ⓘ Cost ranges are severity-bucket heuristics (US national rule-of-thumb). Get contractor quotes + a written scope before underwriting a rehab budget.
Schools (NCES district)
- District
- Boise Independent District
- NCES district ID
- 1600360
- Math proficiency
- 42% ▼ -5.00%
- Reading proficiency
- 56% ▼ -1.00%
- Median HH income
- $49,135
- Composite
- 41.82/100
- National rank
- #3388
- State rank
- #36 of 92 in ID
Livability — Boise City
No livability data for this city. (Only ~50 U.S. cities are tracked.)
Census & demographics
- Census place
- Boise City, ID
- County
- Ada County · 522,161 people
- City population
- 152,689
- Metro
- Boise City, ID
- Population (ZIP)
- 42,719
- Household income
- $73,390
- Rent vs Own
- Severe rent burden
- 1415.0
Population outlook (Ada County) Hauer SSP2
- Today (2025)
- 535,818 people
- By 2030
- 585,751 · +9.3%
- By 2040
- 682,435 · +27.4%
- By 2050
- 775,818 · +44.8%
- By 2075
- 994,458 · +85.6%
- By 2100
- 1,148,884 · +114.4%
Race, ethnicity, and origin ACS 2023
- Neighborhood character
- Predominantly White (77%)
- Race & ethnicity
- White 77% Hispanic / Latino 14% Two or more races 9% Asian 2% Native American 2% Black 1%
- Hispanic origin (detail)
- Mexican 10%
- Common ancestry
- Italian 4% Portuguese 3% Slovak 2%
- Foreign-born
- 8% · Canada
- Languages at home
- 87% English-only · Spanish 8% Russian/Polish/Slavic 1% Other Indo-European 1%
Political lean MEDSL · Ada
- 2024 margin
- R (+10.3) · D 43.4% · R 53.8% · Other 2.8%
- 2008→2024 swing
- -4.2pp toward R · 2008: -6.2pp · 2024: -10.3pp
- All cycles
- 2024: R+10.3 2020: R+3.9 2016: R+9.2 2012: R+11.3 2008: R+6.2
Not yet ingested
- Civics
- —
Market trends
- HPI YoY
- ▼ -393.15%
- Current HPI
- 379.0934
- Rent YoY
- ▲ 1.95%
- Metro
- Boise City, ID
- State GDP YoY
- ▲ 4.51%
- F500 in state
- 6
Industry mix (Fortune 500 HQ in ID)
| Industry | F500 HQs | Revenue |
|---|---|---|
| Retail | 1 | $79B |
|
||
| Technology | 1 | $25B |
|
||
| Food / Agriculture | 1 | $6B |
|
||
Price history
1 event — show timeline
- 2026-06-12 Listed $149,900 IMLS
Cash-flow waterfall
monthlySold comps — $/sqft
last 12 mo · ≤1 miLoading sold comps…