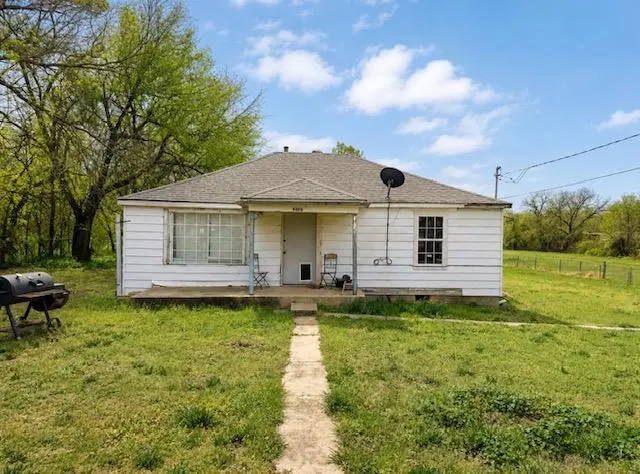
9808 Lloyd Dr · Midwest City, OK
Flood risk 1/10 · Minimal
- FEMA flood zone
- X (unshaded)
- Chance of flooding over 30 yrs
- 0.0%
- Est. flood insurance / yr
- $507 – $1,088
Fire risk 2/10 · Minimal
- Est. fire insurance / yr
- $2,463 – $4,575
Heat risk 5/10 · Moderate
- Hot days now (above 107°F)
- 7 days/yr
- Hot days in 30 yrs
- 17 days/yr
Wind risk 3/10 · Minor
- Chance of severe wind over 30 yrs
- 4.0%
Air-quality risk 2/10 · Minimal
- Unhealthy air days now
- 1 days/yr
- Unhealthy air days in 30 yrs
- 2 days/yr
Risk factors via First Street. Map © Google.
Why this score? — see what drove the B grade
The composite is a weighted blend of 9 inputs, each scored 0–100. Each bar is that input's sub-score; the figure is the points it added to the 100-point composite (weight × sub-score).
- Cash flow +28.7/30.0
- ARV discount +15.0/15.0
- DSCR +10.0/10.0
- 1% rule +7.5/10.0
- Rent growth +3.9/5.0
- Livability +3.6/5.0
- Condition / age +2.5/5.0
- Schools +0.7/10.0
- Appreciation +0.0/10.0
$100,000
🖨 Deal sheet (PDF) 📄 Offer letter ✓ Due diligence
Listing remarks
Calling all investors, builders, developers, and future homeowners! Don’t miss this rare opportunity to own a 2-acre residential property with major development potential. This property currently includes a 2-bedroom, 1-bath home that can be renovated, torn down, or cleared to make way for new construction. The land has already been reviewed by the city and qualifies to be divided into multiple lots, creating an excellent opportunity for a builder or investor looking to develop up to five separate homes. Whether you’re searching for land to build your custom dream home, a site for new construction spec homes, or a property with subdivision potential, this lot offers flexibility,
Key facts
- Strong potential
- Multiple lots
- 2 acre lot
Tags
Property features AI
Finance
- Other: Property in Marydale Acres Addition
- Financial info: Assumable: No; Not eligible for loan qualification (per listing)
- HOA & community: No mandatory association dues
Exterior
- Utilities: No flood insurance required (per listing); Homestead applicable
- Home design: Single-family residence; One story; Residential property; Property listed as dilapidated
- Construction: Frame construction; Composition roof; Slab foundation; Built prior to or by assessor record (living area source: assessor)
- Exterior features: Corner lot; No exterior features listed
Interior
- Bedrooms: 2 bedrooms
- Bathrooms: 1 full bathroom
- Heating & cooling: Electric heating
- Interior features: No fireplace; One living area; No study
Neighborhood map
What this means for you Summary
Snapshot
- This is a 2-bed/1.0-bath single-family listed at $100k.
Deal economics
- At list price, monthly cash flow is $334 ($4k/yr) — positive.
- The deal already cash-flows at list — no discount required.
- Meets the 1% rule at list price ($1k rent vs $100k).
- Cap rate 10.3% vs local median 5.6% in Midwest City — top-decile yield for the area; either an underpriced asset or a hidden risk that comps aren't pricing in. Stress-test before assuming the spread holds.
Location & tenants
- Location reads 71/100 on livability (#30 in OK) — a middle-class / working-renter tenant base. Strengths: cost of living A+, housing A+, health & safety A; Watch: crime D+, employment D, amenities F.
- Oklahoma City (urban): math 7% / reading 10% proficiency, ranked #254 of 270 in OK (top 94%) — low school quality limits family demand, transient renter base, plan for 1-2y turnover; 82% free/reduced lunch — lower-income household profile, screen leases tightly.
- Zoned schools: Emerson Alternative Ed. (Es) (math 24% / reading 24%, grade F, #354 of 845 statewide, top 47%, 64 students, 0% FRL); Classen Ms of Advanced Studies (math 35% / reading 46%, grade F, #6 of 345 statewide, top 1%, 855 students, 0% FRL); Southeast Hs (math 8% / reading 17%, grade F, #355 of 447 statewide, top 80%, 854 students, 0% FRL) — zoned schools average 0% FRL vs 82% district-wide (82 pts lower); this property's tenant base skews higher-income than the district average.
- Zoned-school proficiency averages 26% at this address vs 8% district-wide (+17 pts) — the actual schools serving this property are materially stronger than the Oklahoma City average implies; a family-tenant draw the district grade alone would hide.
- Market conditions: Rents rising fast (+5.7%/yr); 167 active listings in the ZIP; 30 comparable units currently listed for rent nearby; rentals at typical pace (median 18d on market — plan ~3-4 weeks tenant-placement turnaround); 5,365 units permitted in Oklahoma County in 2024 (569 in 5+ unit buildings).
Forward outlook
- Local home prices are declining (-3.0%/yr); year-one equity from $691 of loan paydown is wiped out by about $3k of value loss. Plan a longer hold.
- Oklahoma County population projected at +41% by 2050 — long-run rental-demand tailwind backs the buy-and-hold thesis.
- At projected returns (-3.0% appreciation + 5.7% rent growth), your $28k cash investment doubles in ~7 years — after that, you're playing with house money.
Negotiation context
- Only 6 days on market — expect competitive offers; lowballing is unlikely to land.
Risks & watch-outs
- Watch-outs: built in 1952 — expect roof / HVAC / electrical / plumbing capex.
- Climate carrying-cost: extreme-heat days projected 7→17/yr by 2055 (HVAC capex compounding) — expect insurance premiums to compound above CPI over the hold.
Questions for the listing agent
- Built in 1952 — when were the roof, HVAC, electrical panel, plumbing, and water heater last replaced?
- Is there a deadline driving the sale (1031 exchange, divorce, estate, relocation)? That informs how much negotiation room exists.
- Schools are D-rated, which usually means shorter tenancies and higher turnover. Who's the typical renter profile here, and what's been the actual vacancy rate?
- Crime grade is D in this area — have there been break-ins, vandalism, or insurance claims at this property in the last 3 years? What carrier currently insures it and at what premium?
- What's the average days-on-market for RENTAL listings here right now (not sales)? A rising rental-DOM trend means longer vacancies and softer asking-rent achievability than the comps imply.
- What's the recent tenant-quality profile in this submarket — average credit score on applications, eviction rate, late-payment / NSF rate, and stable-employment percentage? A property-management company in the area should have these aggregated.
- How much new for-sale + rental construction is in the pipeline within 1–3 miles? Heavy new supply typically softens prices + rents 12–24 months out; constrained supply supports both.
Investment metrics
- 1% rule
- 1.25% ✓
- Cap rate
- 10.30%
- Cash-on-cash
- 14.30%
- DSCR
- 1.64
- GRM
- 6.7
CMA / ARV
- ARV (on-the-fly)
- $162,432
- Comps found
- 12
Show comp detail 12 sales within ~0.75 mi
| Address | Dist | Beds/Ba | Sqft | Sold | Price | $/sf | Match |
|---|---|---|---|---|---|---|---|
| 10015 Isaac Dr | 0.18mi | 3/1.5 (+1) | 1,142 (+1%) | 2mo | $164,000 | $144 | 81 |
| 10014 Caton Pl | 0.18mi | 3/1.5 (+1) | 1,076 (-5%) | 2mo | $145,000 | $135 | 76 |
| 9904 Mark Trl | 0.23mi | 3/2.0 (+1) | 1,105 (-2%) | 5mo | $175,000 | $158 | 73 |
| 1816 Michell Dr | 0.29mi | 3/2.0 (+1) | 1,108 (-2%) | 6mo | $130,000 | $117 | 70 |
| 1912 N Saint Peter Ave | 0.61mi | 2/1.0 | 1,110 (-2%) | 3mo | $132,000 | $119 | 67 |
| 1617 Mcgregor Dr | 0.32mi | 3/1.5 (+1) | 1,012 (-10%) | 5mo | $105,000 | $104 | 57 |
| 9304 NE 16th St | 0.58mi | 3/1.5 (+1) | 1,059 (-6%) | 5mo | $154,000 | $145 | 52 |
| 9925 NE 7th St | 0.56mi | 3/1.5 (+1) | 1,206 (+7%) | 4mo | $157,000 | $130 | 52 |
| 1520 Patricia Dr | 0.60mi | 3/1.0 (+1) | 1,040 (-8%) | 6mo | $120,000 | $115 | 49 |
| 1521 Mcdonald Dr | 0.36mi | 3/2.0 (+1) | 978 (-13%) | 6mo | $149,000 | $152 | 47 |
| 800 Lotus Ave | 0.58mi | 3/1.0 (+1) | 1,000 (-11%) | 3mo | $164,000 | $164 | 46 |
| 701 Royal Ave | 0.65mi | 3/1.5 (+1) | 1,006 (-11%) | 2mo | $155,000 | $154 | 43 |
Match score weights: distance 35% · size 25% · config 20% · recency 20%. Top-matched comps best support the ARV.
Projected returns pro-forma
-3.0% appreciation · 5.73% rent growth · sell at horizon
- IRR
- 7.6%
- Equity multiple
- 1.31×
- Total profit
- $8,559
- Equity at exit
- $14,910
- IRR
- 19.0%
- Equity multiple
- 2.79×
- Total profit
- $50,048
- Equity at exit
- $8,646
Cash invested: $28,000 (down + closing). Projections, not guarantees.
Landlord ↔ Tenant lean methodology
- Overall (STATE)
- 83 Strongly Landlord-Friendly
- State Oklahoma
- 83 Strongly Landlord-Friendly · R+20
- County
- — inherits STATE
- City
- — inherits STATE
ZIP-level market 73130
- Home prices YoY
- -21.0%
- Rents YoY
- 5.7%
- Active inventory
- 167
- Price-to-rent
- 6.7×
Monthly cashflow live
- Estimated rent
- $1,245 high interval (Pro) →
- Mortgage (P&I)
- −$524
- Tax from tax record
- −$84 /mo · $1,009/yr
- Insurance
- −$42
- HOA
- −$0
- Vacancy / Maint / Mgmt
- −$262
- Net cashflow
- $334
Break-even live
Sensitivity live
| Price | -10% $390 | -5% $362 | +0% $334 | +5% $305 | +10% $277 |
|---|---|---|---|---|---|
| Rent | -10% $235 | -5% $285 | +0% $334 | +5% $383 | +10% $432 |
| Rate | -1.0pp $384 | -0.5pp $359 | base $334 | +0.5pp $308 | +1.0pp $281 |
UW: 25.0% down · 7.5% · 30yr · 1.5% tax · 5.0% vac · 8.0% maint · 8.0% mgmt
Financing live
Cash to close
- Down payment
- $25,000
- Closing costs
- $3,000
- Reserves months
- —
- Total cash needed
- —
Loan-product check · same deal, 3 products live
Conventional
25% down · 7.5% · 30yr
- Down + closing
- —
- Monthly P&I
- —
- Monthly cashflow
- —
- DSCR
- —
- Eligible?
- —
Personal DTI + credit; lowest rate.
DSCR
20% down · 8.5% · 30yr
- Down + closing
- —
- Monthly P&I
- —
- Monthly cashflow
- —
- DSCR
- —
- Eligible?
- —
No personal income docs; deal must DSCR.
Hard money
10% down · 12.0% · 12mo
- Down + closing
- —
- Monthly P&I
- —
- Monthly cashflow
- —
- DSCR
- —
- Eligible?
- —
Short-term bridge; refi at stabilization.
Rent comps 30 comps
| Address | Beds | Baths | Sqft | Rent | $/sqft | DOM | Units | Dist |
|---|---|---|---|---|---|---|---|---|
| 1525 N Christine Dr Oklahoma City, OK | 3.0 | 1.5 | 1264 | $1,035 | $0.82 | 5d | 1 | 0.29mi |
| 1809 Michell Dr Oklahoma City, OK | 3.0 | 1.0 | 1125 | $1,095 | $0.97 | 4d | 1 | 0.30mi |
| 1617 N Christine Dr Oklahoma City, OK | 2.0 | 2.0 | 962 | $1,050 | $1.09 | 25d | 1 | 0.30mi |
| 1817 Tim Dr Oklahoma City, OK | 3.0 | 2.0 | 1373 | $1,399 | $1.02 | 0d | 1 | 0.32mi |
| 1525 McGregor Dr Oklahoma City, OK | 3.0 | 1.5 | 1012 | $1,275 | $1.26 | 4d | 1 | 0.34mi |
| 10220 Isaac Dr Oklahoma City, OK | 3.0 | 1.0 | 1106 | $1,250 | $1.13 | 45d | 1 | 0.37mi |
| 9528 McIntosh Ave Oklahoma City, OK | 3.0 | 2.0 | 1164 | $1,195 | $1.03 | 45d | 1 | 0.43mi |
| 1400 Alan Ln Oklahoma City, OK | 3.0 | 2.0 | 1288 | $1,495 | $1.16 | 45d | 1 | 0.44mi |
| 10400 Caton Pl Oklahoma City, OK | 3.0 | 2.0 | 1164 | $1,280 | $1.10 | 25d | 1 | 0.50mi |
| 801 Royal Ave Oklahoma City, OK | 3.0 | 1.0 | 951 | $1,200 | $1.26 | 19d | 1 | 0.53mi |
| 1520 Patricia Dr Oklahoma City, OK | 3.0 | 1.0 | 1040 | $1,200 | $1.15 | 45d | 1 | 0.58mi |
| 1400 Marydale Ave Oklahoma City, OK | 3.0 | 1.0 | 1082 | $1,150 | $1.06 | 18d | 1 | 0.62mi |
| 9212 Jennifer Pl Oklahoma City, OK | 3.0 | 2.0 | 960 | $1,250 | $1.30 | 45d | 1 | 0.67mi |
| 633 Lotus Ave Oklahoma City, OK | 3.0 | 1.0 | 1038 | $1,300 | $1.25 | 12d | 1 | 0.69mi |
| 604 Moraine Ave Oklahoma City, OK | 3.0 | 1.5 | 1181 | $1,395 | $1.18 | 0d | 1 | 0.81mi |
| 1168 N Douglas Blvd Oklahoma City, OK | 1.0–2.0 | 1.0 | 725 | $1,020 | $1.41 | 19d | 1 | 0.87mi |
| 9717 NE 4th St Oklahoma City, OK | 3.0 | 2.0 | 1254 | $1,325 | $1.06 | 0d | 1 | 0.87mi |
| 405 Lotus Ave Oklahoma City, OK | 3.0 | 2.0 | 1300 | $1,611 | $1.24 | 3d | 1 | 0.96mi |
| 1619 N Douglas Blvd Oklahoma City, OK | 3.0 | 2.0 | 1152 | $1,129 | $0.98 | 0d | 1 | 0.99mi |
| 2008 Midridge Dr Oklahoma City, OK | 3.0 | 2.0 | 1232 | $1,325 | $1.08 | 16d | 1 | 1.14mi |
| 9705 Oak Tree Ter Oklahoma City, OK | 3.0 | 2.0 | 1100 | $1,410 | $1.28 | 12d | 1 | 1.14mi |
| 910 N Oakview Dr Oklahoma City, OK | 3.0 | 2.0 | 1512 | $1,239 | $0.82 | 0d | 1 | 1.17mi |
| 8741 Hillridge Dr Oklahoma City, OK | 3.0 | 2.0 | 1182 | $1,495 | $1.26 | 4d | 1 | 1.18mi |
| 8741 Hillridge Dr Oklahoma City, OK | 3.0 | 2.0 | 1182 | $1,495 | $1.26 | 45d | 1 | 1.18mi |
| 8910 Oak Valley Dr Oklahoma City, OK | 2.0 | 2.0 | 935 | $1,000 | $1.07 | 22d | 1 | 1.21mi |
| 1632 N Spencer Rd Oklahoma City, OK | 2.0 | 1.0 | 772 | $895 | $1.16 | 16d | 1 | 1.38mi |
| 4033 S Locust Dr Oklahoma City, OK | 2.0 | 1.0 | 800 | $900 | $1.12 | 25d | 1 | 1.39mi |
| 8511 Justin Pl Oklahoma City, OK | 2.0 | 1.0 | 962 | $950 | $0.99 | 16d | 1 | 1.39mi |
| 1020 N Spencer Rd Oklahoma City, OK | 2.0 | 1.0 | 962 | $895 | $0.93 | 25d | 1 | 1.41mi |
| 1014 Spencer Rd Oklahoma City, OK | 2.0 | 2.0 | 800 | $1,000 | $1.25 | 45d | 1 | 1.42mi |
Listing history 7 events
-
2026-06-13statusdays on market $100,000 Pending 6 DOM
-
2026-06-09days on market $100,000 Active 5 DOM
-
2026-06-08days on market $100,000 Active 4 DOM
-
2026-06-07remarks 687-char remark
-
2026-06-07days on market $100,000 Active 3 DOM
-
2026-06-05remarks 613-char remark
-
2026-06-05$100,000 Active 1 DOM
ⓘ Source: listings_history table (triggers on properties + properties_extension) + one-shot
backfill from property_details.listing_events for pre-trigger history.
Tax reassessment forecast OK · Resets to sale price
- Current annual tax
- $1,009 · $84/mo
- Projected year-2 tax
- $1,009 · $84/mo
- Expected delta
- $0/yr ($0/mo · 0.0%)
ⓘ Screening estimate from a state-policy table — verify with the county assessor before closing.
Climate risk First Street
- Flood 1/10 Low FEMA zone X (unshaded) · 0% chance over 30 yrs
- Wildfire 2/10 Low
- Heat 5/10 Major 7 d/yr ≥107°F today · 17 d/yr by 30 yrs out
- Wind 3/10 Moderate 4% chance of damaging wind over 30 yrs
- Air quality 2/10 Low 1 unhealthy d/yr today · 2 by 30 yrs out
Nearby sold comps map
Loading sold comps map…
Walkable amenities ~0.75 mi
Loading nearby amenities…
Taxation est. · year 1
- Rental income
- $14,945
- − Mortgage interest
- −$5,602
- − Property taxes
- −$1,009
- − Insurance
- −$500
- − Repairs & maintenance
- −$1,196
- − Management
- −$1,196
- − Depreciation
- −$2,909
- Taxable income
- $2,534
- Est. tax owed @ 24.0%
- −$608
- After-tax cash flow
- $3,396/yr
For passive investors: Depreciation is non-cash, so a rental often shows a tax loss while cash-flowing — sheltering income. Rental losses are passive: they offset passive income freely, and up to $25,000/yr can offset ordinary (W-2) income if you actively participate and your MAGI is under $100k (phasing out to $0 by $150k); unused losses carry forward. On sale, claimed depreciation is recaptured at up to 25%, and gains may owe capital-gains tax (a 1031 exchange can defer both). Figures are a year-1 estimate at your 24.0% rate — not tax advice; consult a CPA.
Schools (NCES district)
- District
- Oklahoma City
- NCES district ID
- 4022770
- Math proficiency
- 7% ▼ -5.00%
- Reading proficiency
- 10% ▼ -6.00%
- Median HH income
- $35,606
- Composite
- 7.0/100
- National rank
- #9970
- State rank
- #254 of 270 in OK
Livability — Midwest City
- Score
- 71/100
- State rank
- #30
- US rank
- #6637
Category grades
Schools grade is shown separately in the Schools card above.
Census & demographics
- Census place
- Midwest City, OK
- County
- Oklahoma County · 771,644 people
- City population
- 57,386
- Metro
- Oklahoma City, OK
- Population (ZIP)
- 21,476
- Household income
- $71,189
- Rent vs Own
- Severe rent burden
- 378.0
Population outlook (Oklahoma County) Hauer SSP2
- Today (2025)
- 911,875 people
- By 2030
- 982,413 · +7.7%
- By 2040
- 1,130,468 · +24.0%
- By 2050
- 1,288,422 · +41.3%
- By 2075
- 1,711,482 · +87.7%
- By 2100
- 2,088,448 · +129.0%
Race, ethnicity, and origin ACS 2023
- Neighborhood character
- Diverse neighborhood (Simpson 0.60)
- Race & ethnicity
- White 60% Black 18% Two or more races 14% Hispanic / Latino 7% Asian 2% Native American 2%
- Hispanic origin (detail)
- Mexican 6%
- Common ancestry
- Lithuanian 2% Slovak 2% Italian 2%
- Foreign-born
- 3% · Canada
- Languages at home
- 95% English-only · Spanish 3% Tagalog/Filipino 1%
Political lean MEDSL · Oklahoma
- 2024 margin
- Toss-up / Even · D 48.0% · R 49.7% · Other 2.3%
- 2008→2024 swing
- +15.1pp toward D · 2008: -16.8pp · 2024: -1.7pp
- All cycles
- 2024: R+1.7 2020: R+1.1 2016: R+10.5 2012: R+16.7 2008: R+16.8
Not yet ingested
- Civics
- —
Market trends
- HPI YoY
- ▼ -65.22%
- Current HPI
- 245.8385
- Rent YoY
- ▲ 5.73%
- Metro
- Oklahoma City, OK
- State GDP YoY
- ▲ 1.55%
- F500 in state
- 6
Industry mix (Fortune 500 HQ in OK)
| Industry | F500 HQs | Revenue |
|---|---|---|
| Energy | 3 | $48B |
|
||
Price history
1 event — show timeline
- 2026-06-04 Listed $100,000 MLSOK
Property tax history
+4.3%/yrLatest (2025): $1,009 · +3.4% YoY. Source: county tax records.
Cash-flow waterfall
monthlySold comps — $/sqft
last 12 mo · ≤1 miLoading sold comps…