17069 N Indian Canyon Dr #46 · Palm Springs, CA
Flood risk 1/10 · Minimal
- FEMA flood zone
- X (shaded)
- Chance of flooding over 30 yrs
- 0.0%
- Est. flood insurance / yr
- $507 – $1,088
Fire risk 6/10 · Moderate
- Est. fire insurance / yr
- $659 – $1,223
Heat risk 9/10 · Severe
- Hot days now (above 111°F)
- 7 days/yr
- Hot days in 30 yrs
- 19 days/yr
Wind risk 1/10 · Minimal
- Chance of severe wind over 30 yrs
- —
Air-quality risk 5/10 · Moderate
- Unhealthy air days now
- 8 days/yr
- Unhealthy air days in 30 yrs
- 11 days/yr
Risk factors via First Street. Map © Google.
Why this score? — see what drove the B+ grade
The composite is a weighted blend of 9 inputs, each scored 0–100. Each bar is that input's sub-score; the figure is the points it added to the 100-point composite (weight × sub-score).
- Cash flow +30.0/30.0
- 1% rule +10.0/10.0
- DSCR +10.0/10.0
- ARV discount +7.5/15.0
- Appreciation +6.7/10.0
- Condition / age +4.8/5.0
- Livability +3.3/5.0
- Schools +2.7/10.0
- Rent growth +2.5/5.0
$79,000
🖨 Deal sheet (PDF) 📄 Offer letter ✓ Due diligence
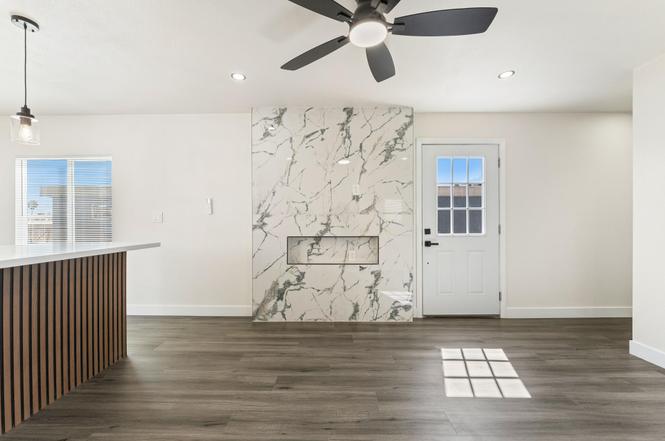
Listing remarks
Beautifully remodeled 2-bedroom, 2-bath manufactured home located in Indian Canyon Mobile Home Park on the north side of Palm Springs with quick access to I-10, placing the entire Coachella Valley just minutes away. This home has been completely updated from head to toe and was thoughtfully renovated by the owner inside and out with quality finishes throughout. Upgrades include a new roof and ceilings, new flooring and baseboards, fresh interior and exterior paint, new windows, remodeled bathrooms with updated fixtures and new tile showers, and a fully renovated kitchen featuring quartz countertops, tile backsplash, and new cabinetry. Additional improvements include a new AC system and nume
Key facts
- Luxury fixtures
- New flooring
- Quick access to i-10
Tags
Property features AI
Finance
- Other: Directions: Please use GPS; Cross street: Dillon Rd; Gated community: No; Short term rentals: No; Will consider lease: No; Disclosures: None
- Financial info: Land lease annual amount listed as $8,340; Listing terms include cash, owner may carry, and cash to new loan
- HOA & community: No monthly association fee
Exterior
- Parking: 3 assigned parking spaces (no garage or covered/carport spaces)
- Security: Resident manager
- Utilities: Sewer: Unknown; Not a PUD
- Home design: Detached property; Single-story (ground level, no unit above); Year built recorded by builder
- Exterior features: Community pool with tile finish; Resident manager on site; Lease land type
Interior
- Flooring: Vinyl flooring
- Bathrooms: 2 full bathrooms
- Heating & cooling: Other heating; Other cooling
- Interior features: Unfurnished; Living room
Neighborhood map
What this means for you Summary
Snapshot
- This is a 2-bed/2.0-bath manufactured listed at $79k. Condition is rated excellent.
Deal economics
- At list price, monthly cash flow is $392 ($5k/yr) — positive.
- The deal already cash-flows at list — no discount required.
- Meets the 1% rule at list price ($1k rent vs $79k).
- Recommended offer: $74k (6.0% below list) — sets the bar for market timing.
- Cap rate 12.2% vs local median 2.7% in Palm Springs — top-decile yield for the area; either an underpriced asset or a hidden risk that comps aren't pricing in. Stress-test before assuming the spread holds.
Location & tenants
- Location reads 66/100 on livability (#348 in CA) — a middle-class / working-renter tenant base. Strengths: amenities A+, commute A+; Watch: schools C-, crime F, cost of living F.
- Palm Springs Unified (suburban): math 21% / reading 42% proficiency, ranked #328 of 517 in CA (top 63%) — families likely to look elsewhere, expect single-tenant / working-renter base with shorter leases; 73% free/reduced lunch — lower-income household profile, screen leases tightly.
- Market conditions: 14 active listings in the ZIP; 9,195 units permitted in Riverside County in 2024 (1,512 in 5+ unit buildings).
Forward outlook
- In year one you build about $3k of equity ($546 loan paydown + $3k appreciation (3.4% local appreciation)).
- Riverside County population projected at +22% by 2050 — long-run rental-demand tailwind backs the buy-and-hold thesis.
- At projected returns (3.4% appreciation + 3.0% rent growth), your $22k cash investment doubles in ~3 years — after that, you're playing with house money.
- By year 10, paydown + projected appreciation supports a ~$31k cash-out refi (75% LTV) — recoverable capital for the next deal without selling this one.
Negotiation context
- It's been on market 81 days — a 6% lower offer ($74k) is reasonable based on typical stale-listing flexibility.
Risks & watch-outs
- Climate carrying-cost: major wildfire risk; extreme-heat days projected 7→19/yr by 2055 (HVAC capex compounding) — expect insurance premiums to compound above CPI over the hold.
Questions for the listing agent
- It's been on market 81 days. Have you received any prior offers? Is the seller open to a 6% concession, seller financing, or rate buy-down credit?
- Built in 1967 — when were the roof, HVAC, electrical panel, plumbing, and water heater last replaced?
- Why hasn't it sold? Are there any deal-killer items the seller is aware of (foundation, flood, title, zoning, code violations)?
- Is there a deadline driving the sale (1031 exchange, divorce, estate, relocation)? That informs how much negotiation room exists.
- Crime grade is F in this area — have there been break-ins, vandalism, or insurance claims at this property in the last 3 years? What carrier currently insures it and at what premium?
- What's the average days-on-market for RENTAL listings here right now (not sales)? A rising rental-DOM trend means longer vacancies and softer asking-rent achievability than the comps imply.
- What's the recent tenant-quality profile in this submarket — average credit score on applications, eviction rate, late-payment / NSF rate, and stable-employment percentage? A property-management company in the area should have these aggregated.
- How much new for-sale + rental construction is in the pipeline within 1–3 miles? Heavy new supply typically softens prices + rents 12–24 months out; constrained supply supports both.
Investment metrics
- 1% rule
- 1.50% ✓
- Cap rate
- 12.25%
- Cash-on-cash
- 21.27%
- DSCR
- 1.95
- GRM
- 5.5
CMA / ARV
- ARV (on-the-fly)
- $232,560
- Comps found
- 1
Show comp detail 1 sale within ~0.75 mi
| Address | Dist | Beds/Ba | Sqft | Sold | Price | $/sf | Match |
|---|---|---|---|---|---|---|---|
| 17401 Louise St | 0.34mi | 2/1.0 | 728 (+1%) | 14mo | $235,000 | $323 | 66 |
Match score weights: distance 35% · size 25% · config 20% · recency 20%. Top-matched comps best support the ARV.
Projected returns pro-forma
3.35% appreciation · 3.0% rent growth · sell at horizon
- IRR
- 28.2%
- Equity multiple
- 2.63×
- Total profit
- $35,975
- Equity at exit
- $37,082
- IRR
- 28.4%
- Equity multiple
- 5.13×
- Total profit
- $91,312
- Equity at exit
- $58,391
Cash invested: $22,120 (down + closing). Projections, not guarantees.
Landlord ↔ Tenant lean methodology
- Overall (STATE)
- 18 Strongly Tenant-Friendly
- State California
- 18 Strongly Tenant-Friendly · D+13
- County
- — inherits STATE
- City
- — inherits STATE
ZIP-level market 92258
- Home prices YoY
- 1.4%
- Active inventory
- 14
- Price-to-rent
- 5.5×
Monthly cashflow live
- Estimated rent
- $1,187 medium interval (Pro) →
- Mortgage (P&I)
- −$414
- Tax est. 1.5%
- −$99 /mo · $1,185/yr
- Insurance
- −$33
- HOA
- −$0
- Vacancy / Maint / Mgmt
- −$249
- Net cashflow
- $392
Break-even live
Sensitivity live
| Price | -10% $447 | -5% $419 | +0% $392 | +5% $365 | +10% $338 |
|---|---|---|---|---|---|
| Rent | -10% $298 | -5% $345 | +0% $392 | +5% $439 | +10% $486 |
| Rate | -1.0pp $432 | -0.5pp $412 | base $392 | +0.5pp $372 | +1.0pp $351 |
UW: 25.0% down · 7.5% · 30yr · 1.5% tax · 5.0% vac · 8.0% maint · 8.0% mgmt
Financing live
Cash to close
- Down payment
- $19,750
- Closing costs
- $2,370
- Reserves months
- —
- Total cash needed
- —
Loan-product check · same deal, 3 products live
Conventional
25% down · 7.5% · 30yr
- Down + closing
- —
- Monthly P&I
- —
- Monthly cashflow
- —
- DSCR
- —
- Eligible?
- —
Personal DTI + credit; lowest rate.
DSCR
20% down · 8.5% · 30yr
- Down + closing
- —
- Monthly P&I
- —
- Monthly cashflow
- —
- DSCR
- —
- Eligible?
- —
No personal income docs; deal must DSCR.
Hard money
10% down · 12.0% · 12mo
- Down + closing
- —
- Monthly P&I
- —
- Monthly cashflow
- —
- DSCR
- —
- Eligible?
- —
Short-term bridge; refi at stabilization.
Listing history 5 events
-
2026-06-02statusdays on market $79,000 Pending 81 DOM
-
2026-06-01days on market $79,000 Active Under Contract 80 DOM
-
2026-05-31days on market $79,000 Active Under Contract 79 DOM
-
2026-04-20historical Active Under Contract
-
2026-03-13$79,000 Active
ⓘ Source: listings_history table (triggers on properties + properties_extension) + one-shot
backfill from property_details.listing_events for pre-trigger history.
Climate risk First Street
- Flood 1/10 Low FEMA zone X (shaded) · 0% chance over 30 yrs
- Wildfire 6/10 Major
- Heat 9/10 Extreme 7 d/yr ≥111°F today · 19 d/yr by 30 yrs out
- Wind 1/10 Low
- Air quality 5/10 Major 8 unhealthy d/yr today · 11 by 30 yrs out
Nearby sold comps map
Loading sold comps map…
Walkable amenities ~0.75 mi
Loading nearby amenities…
Taxation est. · year 1
- Rental income
- $14,249
- − Mortgage interest
- −$4,425
- − Property taxes
- −$1,185
- − Insurance
- −$395
- − Repairs & maintenance
- −$1,140
- − Management
- −$1,140
- − Depreciation
- −$2,298
- Taxable income
- $3,666
- Est. tax owed @ 24.0%
- −$880
- After-tax cash flow
- $3,826/yr
For passive investors: Depreciation is non-cash, so a rental often shows a tax loss while cash-flowing — sheltering income. Rental losses are passive: they offset passive income freely, and up to $25,000/yr can offset ordinary (W-2) income if you actively participate and your MAGI is under $100k (phasing out to $0 by $150k); unused losses carry forward. On sale, claimed depreciation is recaptured at up to 25%, and gains may owe capital-gains tax (a 1031 exchange can defer both). Figures are a year-1 estimate at your 24.0% rate — not tax advice; consult a CPA.
Condition & rehab AI · 13 photos
This beautifully remodeled 2-bedroom, 2-bath manufactured home is in excellent condition with no visible repairs needed. The property is move-in ready and offers a great investment opportunity.
Value-add opportunities
- Both Landscaping improvements — Enhances curb appeal and adds value
- Both Add a smart home system — Improves convenience and adds value
- Both Install smart locks — Enhances security and adds value
Renovation cost estimate screening
Value-add ROI direction
- Both Landscaping improvements — Enhances curb appeal and adds value ↑
- Both Add a smart home system — Improves convenience and adds value ↑
- Both Install smart locks — Enhances security and adds value ↑
ⓘ Cost ranges are severity-bucket heuristics (US national rule-of-thumb). Get contractor quotes + a written scope before underwriting a rehab budget.
Schools (NCES district)
- District
- Palm Springs Unified
- NCES district ID
- 0629550
- Math proficiency
- 21% ▼ -7.00%
- Reading proficiency
- 42% ▬ 0.00%
- Median HH income
- $43,638
- Composite
- 26.76/100
- National rank
- #7131
- State rank
- #328 of 517 in CA
Livability — Palm Springs
- Score
- 66/100
- State rank
- #348
- US rank
- #11850
Category grades
Schools grade is shown separately in the Schools card above.
Census & demographics
- City population
- 46,786
- Population (ZIP)
- 508
Population outlook (Riverside County) Hauer SSP2
- Today (2025)
- 2,664,475 people
- By 2030
- 2,802,692 · +5.2%
- By 2040
- 3,050,904 · +14.5%
- By 2050
- 3,256,783 · +22.2%
- By 2075
- 3,655,058 · +37.2%
- By 2100
- 3,766,594 · +41.4%
Race, ethnicity, and origin ACS 2023
- Neighborhood character
- Predominantly Hispanic (75%)
- Race & ethnicity
- Hispanic / Latino 75% Two or more races 30% White 21% Native American 10% Black 3%
- Hispanic origin (detail)
- Mexican 53% Puerto Rican 3%
- Common ancestry
- Portuguese 2%
- Foreign-born
- 32% · Canada
- Languages at home
- 35% English-only · Spanish 65%
Political lean MEDSL · Riverside
- 2024 margin
- Toss-up / Even · D 48.0% · R 49.3% · Other 2.6%
- 2008→2024 swing
- -3.6pp toward R · 2008: 2.3pp · 2024: -1.3pp
- All cycles
- 2024: R+1.3 2020: D+8.0 2016: D+4.3 2012: R+0.4 2008: D+2.3
Not yet ingested
- Civics
- —
Market trends
- HPI YoY
- ▲ 3.35%
- Current HPI
- 245.1131
- Rent YoY
- —
- Metro
- —
- State GDP YoY
- ▲ 3.21%
- F500 in state
- 116
Industry mix (Fortune 500 HQ in CA)
| Industry | F500 HQs | Revenue |
|---|---|---|
| Technology | 27 | $1,492B |
|
||
| Financial Services | 3 | $174B |
|
||
| Retail | 3 | $44B |
|
||
| Insurance | 3 | $26B |
|
||
| Media / Entertainment | 2 | $115B |
|
||
| Pharmaceuticals / Biotech | 2 | $62B |
|
||
Price history
2 events — show timeline
- 2026-04-20 Contingent — GPSMLS
- 2026-03-13 Listed $79,000 GPSMLS
Cash-flow waterfall
monthlySold comps — $/sqft
last 12 mo · ≤1 miLoading sold comps…