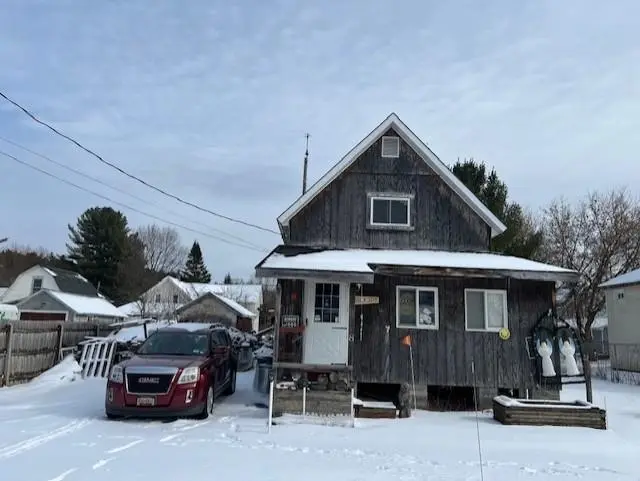
8 2nd St · Edwards, NY
Flood risk 1/10 · Minimal
- FEMA flood zone
- X
- Chance of flooding over 30 yrs
- 0.0%
- Est. flood insurance / yr
- $473 – $860
Fire risk 2/10 · Minimal
- Est. fire insurance / yr
- $691 – $1,283
Heat risk 2/10 · Minimal
- Hot days now (above 92°F)
- 7 days/yr
- Hot days in 30 yrs
- 16 days/yr
Wind risk 1/10 · Minimal
- Chance of severe wind over 30 yrs
- —
Air-quality risk 2/10 · Minimal
- Unhealthy air days now
- 0 days/yr
- Unhealthy air days in 30 yrs
- 1 days/yr
Risk factors via First Street. Map © Google.
Why this score? — see what drove the B grade
The composite is a weighted blend of 9 inputs, each scored 0–100. Each bar is that input's sub-score; the figure is the points it added to the 100-point composite (weight × sub-score).
- Cash flow +30.0/30.0
- 1% rule +10.0/10.0
- DSCR +10.0/10.0
- ARV discount +7.5/15.0
- Appreciation +6.3/10.0
- Schools +3.9/10.0
- Livability +2.8/5.0
- Rent growth +2.5/5.0
- Condition / age +1.0/5.0
$45,000
🖨 Deal sheet (PDF) 📄 Offer letter ✓ Due diligence
Listing remarks MLS
This 2 bedroom, one bath home sits on a quiet street in Edwards. Home has an enclosed front porch and a partially fenced yard. There is a one stall garage and a storage shed. Home is heated by a forced air fuel oil furnace, has a 50 gallon electric hot water heater, stove refrigerator, freezer and also features 200 A electrical service. Property is close to NYS Snowmobile Trail and within walking distance to medical clinic, library, post office and downtown businesses. Contact a Realtor today to schedule your private showing.
Key facts
- One stall garage
- Storage shed
- Enclosed front porch
Tags
Neighborhood map
What this means for you Summary
Snapshot
- This is a 2-bed/1.0-bath single-family listed at $45k. Condition is rated poor.
Deal economics
- At list price, monthly cash flow is $528 ($6k/yr) — positive.
- The deal already cash-flows at list — no discount required.
- Meets the 1% rule at list price ($1k rent vs $45k).
- Recommended offer: $41k (9.0% below list) — sets the bar for market timing.
Location & tenants
- Location reads 56/100 on livability (#1,113 in NY) — a working-class tenant base; expect higher turnover. Strengths: cost of living A+, housing A-; Watch: employment D, health & safety D, crime F.
- Edwards-Knox Central School District (rural): math 40% / reading 52% proficiency, ranked #454 of 590 in NY (top 77%) — families likely to look elsewhere, expect single-tenant / working-renter base with shorter leases.
- Zoned schools: Edwards-Knox Elementary School (math 37% / reading 47%, grade F, #1,361 of 2,108 statewide, top 67%, 294 students, 56% FRL); Edwards-Knox Junior-Senior High School (math 52% / reading 57%, grade C-, #912 of 1,100 statewide, top 85%, 221 students, 59% FRL) — zoned schools at 58% FRL track the district average.
- Market conditions: 10 active listings in the ZIP; 215 units permitted in St. Lawrence County in 2024 (0 in 5+ unit buildings).
Forward outlook
- In year one you build about $1k of equity ($311 loan paydown + $1k appreciation (2.6% local appreciation)).
- St. Lawrence County population projected at -14% by 2050 — secular population decline; favor cash flow + early exit over multi-decade hold.
- At projected returns (2.6% appreciation + 3.0% rent growth), your $13k cash investment doubles in ~2 years — after that, you're playing with house money.
Negotiation context
- It's been on market 98 days — a 9% lower offer ($41k) is reasonable based on typical stale-listing flexibility.
Risks & watch-outs
- Watch-outs: built in 1890 — expect roof / HVAC / electrical / plumbing capex.
Questions for the listing agent
- It's been on market 98 days. Have you received any prior offers? Is the seller open to a 9% concession, seller financing, or rate buy-down credit?
- Have any recent inspections been done? Can we get a copy of the seller's disclosures and any deferred-maintenance estimates?
- Built in 1890 — when were the roof, HVAC, electrical panel, plumbing, and water heater last replaced?
- Why hasn't it sold? Are there any deal-killer items the seller is aware of (foundation, flood, title, zoning, code violations)?
- Is there a deadline driving the sale (1031 exchange, divorce, estate, relocation)? That informs how much negotiation room exists.
- Schools are F-rated, which usually means shorter tenancies and higher turnover. Who's the typical renter profile here, and what's been the actual vacancy rate?
- Crime grade is F in this area — have there been break-ins, vandalism, or insurance claims at this property in the last 3 years? What carrier currently insures it and at what premium?
- What's the average days-on-market for RENTAL listings here right now (not sales)? A rising rental-DOM trend means longer vacancies and softer asking-rent achievability than the comps imply.
- What's the recent tenant-quality profile in this submarket — average credit score on applications, eviction rate, late-payment / NSF rate, and stable-employment percentage? A property-management company in the area should have these aggregated.
- How much new for-sale + rental construction is in the pipeline within 1–3 miles? Heavy new supply typically softens prices + rents 12–24 months out; constrained supply supports both.
Investment metrics
- 1% rule
- 2.36% ✓
- Cap rate
- 20.37%
- Cash-on-cash
- 50.29%
- DSCR
- 3.24
- GRM
- 3.5
CMA / ARV
- ARV (median comp)
- $90,869
- List price
- $45,000
- Delta
- -50.48%
- Verdict
- UNDERPRICED
- Comps
- 4 within 1.0 mi
Show comp detail 1 sale within ~0.75 mi
| Address | Dist | Beds/Ba | Sqft | Sold | Price | $/sf | Match |
|---|---|---|---|---|---|---|---|
| 20 First St | 0.06mi | 3/1.0 (+1) | 1,392 (+12%) | 12mo | $80,000 | $57 | 62 |
Match score weights: distance 35% · size 25% · config 20% · recency 20%. Top-matched comps best support the ARV.
Projected returns pro-forma
2.63% appreciation · 3.0% rent growth · sell at horizon
- IRR
- 55.0%
- Equity multiple
- 4.03×
- Total profit
- $38,184
- Equity at exit
- $19,292
- IRR
- 54.9%
- Equity multiple
- 8.14×
- Total profit
- $89,944
- Equity at exit
- $29,019
Cash invested: $12,600 (down + closing). Projections, not guarantees.
Landlord ↔ Tenant lean methodology
- Overall (STATE)
- 15 Strongly Tenant-Friendly
- State New York
- 15 Strongly Tenant-Friendly · D+10
- County
- — inherits STATE
- City
- — inherits STATE
ZIP-level market 13635
- Home prices YoY
- 0.8%
- Active inventory
- 10
- Price-to-rent
- 3.5×
Monthly cashflow live
- Estimated rent
- $1,062 medium interval (Pro) →
- Mortgage (P&I)
- −$236
- Tax est. 1.5%
- −$56 /mo · $675/yr
- Insurance
- −$19
- HOA
- −$0
- Lot rent
- −$0
- Vacancy / Maint / Mgmt
- −$223
- Net cashflow
- $528
Break-even live
Sensitivity live
| Price | -10% $559 | -5% $544 | +0% $528 | +5% $513 | +10% $497 |
|---|---|---|---|---|---|
| Rent | -10% $444 | -5% $486 | +0% $528 | +5% $570 | +10% $612 |
| Rate | -1.0pp $551 | -0.5pp $540 | base $528 | +0.5pp $516 | +1.0pp $505 |
UW: 25.0% down · 7.5% · 30yr · 1.5% tax · 5.0% vac · 8.0% maint · 8.0% mgmt
Financing live
Cash to close
- Down payment
- $11,250
- Closing costs
- $1,350
- Reserves months
- —
- Total cash needed
- —
Loan-product check · same deal, 3 products live
Conventional
25% down · 7.5% · 30yr
- Down + closing
- —
- Monthly P&I
- —
- Monthly cashflow
- —
- DSCR
- —
- Eligible?
- —
Personal DTI + credit; lowest rate.
DSCR
20% down · 8.5% · 30yr
- Down + closing
- —
- Monthly P&I
- —
- Monthly cashflow
- —
- DSCR
- —
- Eligible?
- —
No personal income docs; deal must DSCR.
Hard money
10% down · 12.0% · 12mo
- Down + closing
- —
- Monthly P&I
- —
- Monthly cashflow
- —
- DSCR
- —
- Eligible?
- —
Short-term bridge; refi at stabilization.
Listing history 18 events
-
2026-06-22days on market $45,000 Active 98 DOM
-
2026-06-21days on market $45,000 Active 97 DOM
-
2026-06-21days on market $45,000 Active 96 DOM
-
2026-06-18days on market $45,000 Active 94 DOM
-
2026-06-17days on market $45,000 Active 93 DOM
-
2026-06-16days on market $45,000 Active 92 DOM
-
2026-06-15days on market $45,000 Active 91 DOM
-
2026-06-13days on market $45,000 Active 89 DOM
-
2026-06-12days on market $45,000 Active 88 DOM
-
2026-06-09days on market $45,000 Active 85 DOM
-
2026-06-08days on market $45,000 Active 84 DOM
-
2026-06-07days on market $45,000 Active 83 DOM
-
2026-06-05days on market $45,000 Active 81 DOM
-
2026-06-04days on market $45,000 Active 79 DOM
-
2026-06-02days on market $45,000 Active 78 DOM
-
2026-06-01days on market $45,000 Active 77 DOM
-
2026-05-31days on market $45,000 Active 76 DOM
-
2026-03-16$45,000 Active 531-char remark
Show marketing remark (531 chars)
This 2 bedroom, one bath home sits on a quiet street in Edwards. Home has an enclosed front porch and a partially fenced yard. There is a one stall garage and a storage shed. Home is heated by a forced air fuel oil furnace, has a 50 gallon electric hot water heater, stove refrigerator, freezer and also features 200 A electrical service. Property is close to NYS Snowmobile Trail and within walking distance to medical clinic, library, post office and downtown businesses. Contact a Realtor today to schedule your private showing.
ⓘ Source: listings_history table (triggers on properties + properties_extension) + one-shot
backfill from property_details.listing_events for pre-trigger history.
Climate risk First Street
- Flood 1/10 Low FEMA zone X · 0% chance over 30 yrs
- Wildfire 2/10 Low
- Heat 2/10 Low 7 d/yr ≥92°F today · 16 d/yr by 30 yrs out
- Wind 1/10 Low
- Air quality 2/10 Low 0 unhealthy d/yr today · 1 by 30 yrs out
Nearby sold comps map
Loading sold comps map…
Walkable amenities ~0.75 mi
Loading nearby amenities…
Taxation est. · year 1
- Rental income
- $12,745
- − Mortgage interest
- −$2,521
- − Property taxes
- −$675
- − Insurance
- −$225
- − Repairs & maintenance
- −$1,020
- − Management
- −$1,020
- − Depreciation
- −$1,309
- Taxable income
- $5,976
- Est. tax owed @ 24.0%
- −$1,434
- After-tax cash flow
- $4,903/yr
For passive investors: Depreciation is non-cash, so a rental often shows a tax loss while cash-flowing — sheltering income. Rental losses are passive: they offset passive income freely, and up to $25,000/yr can offset ordinary (W-2) income if you actively participate and your MAGI is under $100k (phasing out to $0 by $150k); unused losses carry forward. On sale, claimed depreciation is recaptured at up to 25%, and gains may owe capital-gains tax (a 1031 exchange can defer both). Figures are a year-1 estimate at your 24.0% rate — not tax advice; consult a CPA.
Condition & rehab AI · 8 photos
This property requires extensive repairs and maintenance, including a new roof, exterior siding, and fencing. Improvements in these areas would significantly increase its resale and rental value.
Repairs flagged
- Major roof — Significant damage and wear
- Major exterior siding — Weathered and peeling
- Major fencing — Falling apart
- Major landscaping — Minimal and unkempt
- Major kitchen flooring — Worn and in need of replacement
- Major bathroom flooring — Worn and in need of replacement
Value-add opportunities
- Resale Paint exterior siding — Fresh paint can significantly improve curb appeal
- Resale Repair and replace fencing — A well-maintained fence enhances property value
- Resale Improve landscaping — A well-maintained yard can increase property value
- Rental Clean and organize kitchen and bathroom — A clean and organized space is more appealing to potential renters
Renovation cost estimate screening
| Repair item | Severity | Est. cost |
|---|---|---|
| roof · Significant damage and wear | Major | $15,000–50,000 |
| exterior siding · Weathered and peeling | Major | $15,000–50,000 |
| fencing · Falling apart | Major | $15,000–50,000 |
| landscaping · Minimal and unkempt | Major | $15,000–50,000 |
| kitchen flooring · Worn and in need of replacement | Major | $15,000–50,000 |
| bathroom flooring · Worn and in need of replacement | Major | $15,000–50,000 |
| Total estimated repair cost · 6 items | $90,000–300,000 |
Value-add ROI direction
- Resale Paint exterior siding — Fresh paint can significantly improve curb appeal ↑
- Resale Repair and replace fencing — A well-maintained fence enhances property value ↑
- Resale Improve landscaping — A well-maintained yard can increase property value ↑
- Rental Clean and organize kitchen and bathroom — A clean and organized space is more appealing to potential renters ↑
ⓘ Cost ranges are severity-bucket heuristics (US national rule-of-thumb). Get contractor quotes + a written scope before underwriting a rehab budget.
Schools (NCES district)
- District
- Edwards-Knox Central School District
- NCES district ID
- 3600003
- Math proficiency
- 40% ▲ 1.00%
- Reading proficiency
- 52% ▲ 20.00%
- Median HH income
- $44,756
- Composite
- 38.92/100
- National rank
- #4091
- State rank
- #454 of 590 in NY
Livability — Edwards
- Score
- 56/100
- State rank
- #1113
- US rank
- #22828
Category grades
Schools grade is shown separately in the Schools card above.
Census & demographics
- Census place
- Edwards, NY
- Population (ZIP)
- 1,283
Population outlook (St. Lawrence County) Hauer SSP2
- Today (2025)
- 110,027 people
- By 2030
- 107,455 · -2.3%
- By 2040
- 100,492 · -8.7%
- By 2050
- 94,254 · -14.3%
- By 2075
- 80,175 · -27.1%
- By 2100
- 63,140 · -42.6%
Race, ethnicity, and origin ACS 2023
- Neighborhood character
- Predominantly White (96%)
- Race & ethnicity
- White 96% Two or more races 4% Hispanic / Latino 3%
- Common ancestry
- Lithuanian 8% Romanian 5% Iranian 3%
- Foreign-born
- 1%
- Languages at home
- 98% English-only · Russian/Polish/Slavic 1% Spanish 1%
Political lean MEDSL · St. Lawrence
- 2024 margin
- R (+18.0) · D 41.0% · R 59.0%
- 2008→2024 swing
- -34.3pp toward R · 2008: 16.3pp · 2024: -18.0pp
- All cycles
- 2024: R+18.0 2020: R+11.7 2016: R+10.8 2012: D+16.6 2008: D+16.3
Not yet ingested
- Civics
- —
Market trends
- HPI YoY
- ▲ 2.63%
- Current HPI
- 327.8814
- Rent YoY
- —
- Metro
- —
- State GDP YoY
- ▲ 2.60%
- F500 in state
- 92
Industry mix (Fortune 500 HQ in NY)
| Industry | F500 HQs | Revenue |
|---|---|---|
| Financial Services | 10 | $950B |
|
||
| Consumer Goods | 9 | $162B |
|
||
| Insurance | 4 | $225B |
|
||
| Telecommunications | 2 | $144B |
|
||
| Pharmaceuticals | 2 | $112B |
|
||
| Media / Entertainment | 2 | $69B |
|
||
Price history
1 event — show timeline
- 2026-03-16 Listed $45,000 SLCMLS
Cash-flow waterfall
monthlySold comps — $/sqft
last 12 mo · ≤1 miLoading sold comps…