 🏗️ New Construction
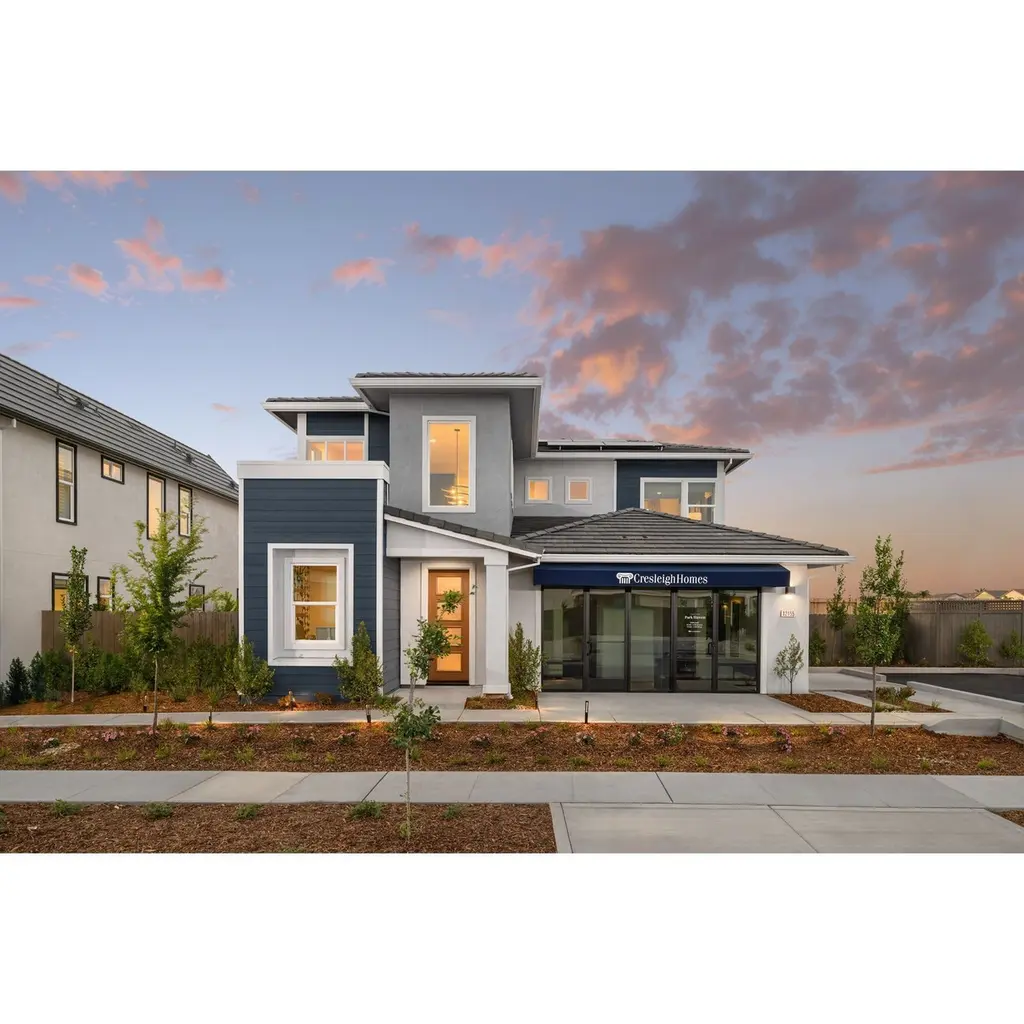
Residence 3 Plan · Rancho Cordova, CA
Flood risk No data
- FEMA flood zone
- —
- Chance of flooding over 30 yrs
- —
- Est. flood insurance / yr
- —
Fire risk No data
- Est. fire insurance / yr
- —
Heat risk No data
- Hot days now (above threshold)
- —
- Hot days in 30 yrs
- —
Wind risk No data
- Chance of severe wind over 30 yrs
- —
Air-quality risk No data
- Unhealthy air days now
- —
- Unhealthy air days in 30 yrs
- —
Risk factors via First Street. Map © Google.
Why this score? — see what drove the F grade
The composite is a weighted blend of 9 inputs, each scored 0–100. Each bar is that input's sub-score; the figure is the points it added to the 100-point composite (weight × sub-score).
- Appreciation +10.0/10.0
- ARV discount +7.5/15.0
- Schools +4.1/10.0
- Livability +3.4/5.0
- Cash flow +3.3/30.0
- Rent growth +3.0/5.0
- Condition / age +2.5/5.0
- 1% rule +0.0/10.0
- DSCR +0.0/10.0
$570,000
🖨 Deal sheet (PDF) 📄 Offer letter ✓ Due diligence
Listing remarks MLS
Residence Three: Designed with versatility in mind, this home features a full downstairs bedroom and bath, ideal for guests or a home office. . Upstairs, an airy layout opens to below, with a private primary suite and well-separated secondary bedrooms. Enjoy the luxuries included in a Cresleigh Home such as hand set tiles in entry way, kitchen and wet areas, large eat-in kitchen island, ample storage, and All-Ready Smart Home package.
Key facts
- Ample storage
- 2 garage spots
- Listed 199 days
Tags
Neighborhood map
What this means for you Summary
Snapshot
- This is a 3-bed/3.0-bath single-family listed at $570k.
Deal economics
- At list price, monthly cash flow is $-2k ($-24k/yr) — negative.
- To cash-flow at today's rent, offer at most $352k (38.2% below list).
- To meet the 1% rule (rent ≥ 1% of price), the offer needs to be $308k (45.9% below list).
- Recommended offer: $308k (45.9% below list) — sets the bar for 1% rule.
Location & tenants
- Location reads 68/100 on livability (#268 in CA) — a middle-class / working-renter tenant base. Strengths: housing A+, employment B; Watch: commute C-, crime D, cost of living F.
- Elk Grove Unified (suburban): math 40% / reading 51% proficiency, ranked #165 of 517 in CA (top 32%) — families likely to look elsewhere, expect single-tenant / working-renter base with shorter leases.
- Zoned schools: Sunrise Elementary (math 65% / reading 67%, grade B+, #176 of 1,571 statewide, top 11%, 966 students, 21% FRL); Katherine L. Albiani Middle (math 55% / reading 67%, grade B+, #57 of 498 statewide, top 12%, 1,307 students, 27% FRL); Pleasant Grove High (math 57% / reading 74%, grade B, #157 of 1,170 statewide, top 14%, 2,520 students, 22% FRL) — zoned schools average 23% FRL vs 43% district-wide (19 pts lower); this property's tenant base skews higher-income than the district average.
- Zoned-school proficiency averages 64% at this address vs 46% district-wide (+19 pts) — the actual schools serving this property are materially stronger than the Elk Grove Unified average implies; a family-tenant draw the district grade alone would hide.
- Market conditions: Rents rising (+2.1%/yr); 471 active listings in the ZIP; 18 comparable units currently listed for rent nearby; rentals at typical pace (median 17d on market — plan ~3-4 weeks tenant-placement turnaround); high-income renter base; 6,825 units permitted in Sacramento County in 2024 (1,752 in 5+ unit buildings).
Forward outlook
- In year one you build about $69k of equity ($4k loan paydown + $64k appreciation (10.0% local appreciation)).
- Sacramento County population projected at +17% by 2050 — long-run rental-demand tailwind backs the buy-and-hold thesis.
- By year 2, paydown + projected appreciation supports a ~$110k cash-out refi (75% LTV) — recoverable capital for the next deal without selling this one.
Negotiation context
- It's been on market 199 days — a 12% lower offer ($502k) is reasonable based on typical stale-listing flexibility.
Questions for the listing agent
- What do current leases actually rent for vs. the listed asking? Can we see a recent rent roll and the last 12 months of T-12 income?
- It's been on market 199 days. Have you received any prior offers? Is the seller open to a 46% concession, seller financing, or rate buy-down credit?
- Why hasn't it sold? Are there any deal-killer items the seller is aware of (foundation, flood, title, zoning, code violations)?
- Is there a deadline driving the sale (1031 exchange, divorce, estate, relocation)? That informs how much negotiation room exists.
- Crime grade is D in this area — have there been break-ins, vandalism, or insurance claims at this property in the last 3 years? What carrier currently insures it and at what premium?
- The area grade is low — what's the realistic commute time and amenity access for the typical tenant pool here? Any planned neighborhood developments (good or bad) we should know about?
- What's the average days-on-market for RENTAL listings here right now (not sales)? A rising rental-DOM trend means longer vacancies and softer asking-rent achievability than the comps imply.
- What's the recent tenant-quality profile in this submarket — average credit score on applications, eviction rate, late-payment / NSF rate, and stable-employment percentage? A property-management company in the area should have these aggregated.
- How much new for-sale + rental construction is in the pipeline within 1–3 miles? Heavy new supply typically softens prices + rents 12–24 months out; constrained supply supports both.
Investment metrics
- 1% rule
- 0.48% ✗
- Cap rate
- 2.56%
- Cash-on-cash
- -13.34%
- DSCR
- 0.41
- GRM
- 17.3
CMA / ARV
- ARV (median comp)
- $641,396
- List price
- $570,000
- Delta
- -11.13%
- Verdict
- UNDERPRICED
- Comps
- 20 within 1.0 mi
Show comp detail 12 sales within ~0.75 mi
| Address | Dist | Beds/Ba | Sqft | Sold | Price | $/sf | Match |
|---|---|---|---|---|---|---|---|
| 12233 Habitat Way | 0.20mi | 4/2.0 (+1) | 1,801 (-2%) | 2mo | $555,000 | $308 | 77 |
| 12080 Prades Way | 0.34mi | 3/2.0 | 1,752 (-4%) | 0mo | $542,200 | $309 | 73 |
| 12219 Alamosa | 0.43mi | 3/2.5 | 1,906 (+4%) | 2mo | $515,000 | $270 | 69 |
| 4255 Choteau Cir | 0.24mi | 4/2.0 (+1) | 1,713 (-6%) | 2mo | $570,000 | $333 | 67 |
| 12320 Pawcatuck Way | 0.50mi | 4/2.0 (+1) | 1,864 (+2%) | 2mo | $560,000 | $300 | 64 |
| 12274 Greenfinch Way | 0.69mi | 3/2.5 | 1,850 (+1%) | 2mo | $537,973 | $291 | 63 |
| 12044 Mircado Way | 0.65mi | 3/2.0 | 1,723 (-6%) | 1mo | $512,185 | $297 | 55 |
| 12270 Greenfinch Way | 0.69mi | 4/2.5 (+1) | 2,007 (+10%) | 2mo | $530,227 | $264 | 44 |
| 12271 Greenfinch Way | 0.67mi | 3/2.5 | 2,084 (+14%) | 2mo | $549,690 | $264 | 42 |
| 12262 Greenfinch Way | 0.67mi | 3/2.5 | 2,084 (+14%) | 2mo | $544,690 | $261 | 41 |
| 12390 Alamosa Dr | 0.72mi | 4/3.0 (+1) | 2,080 (+14%) | 2mo | $630,145 | $303 | 38 |
| 12402 Alamosa Dr | 0.75mi | 4/2.5 (+1) | 2,095 (+14%) | 1mo | $667,369 | $319 | 34 |
Match score weights: distance 35% · size 25% · config 20% · recency 20%. Top-matched comps best support the ARV.
Projected returns pro-forma
10.0% appreciation · 2.08% rent growth · sell at horizon
- IRR
- 14.8%
- Equity multiple
- 2.22×
- Total profit
- $219,378
- Equity at exit
- $577,820
- IRR
- 14.5%
- Equity multiple
- 5.12×
- Total profit
- $740,596
- Equity at exit
- $1,246,092
Cash invested: $179,591 (down + closing). Projections, not guarantees.
Landlord ↔ Tenant lean methodology
- Overall (STATE)
- 18 Strongly Tenant-Friendly
- State California
- 18 Strongly Tenant-Friendly · D+13
- County
- — inherits STATE
- City
- — inherits STATE
ZIP-level market 95742
- Home prices YoY
- 28.3%
- Rents YoY
- 2.1%
- Active inventory
- 471
- Price-to-rent
- 15.4×
Monthly cashflow live
- Estimated rent
- $3,084 high interval (Pro) →
- Mortgage (P&I)
- −$3,364
- Tax est. 1.5%
- −$802 /mo · $9,621/yr
- Insurance
- −$267
- HOA
- −$0
- Vacancy / Maint / Mgmt
- −$648
- Net cashflow
- $-1,997
Break-even live
Sensitivity live
| Price | -10% $-1,553 | -5% $-1,775 | +0% $-1,997 | +5% $-2,218 | +10% $-2,440 |
|---|---|---|---|---|---|
| Rent | -10% $-2,240 | -5% $-2,118 | +0% $-1,997 | +5% $-1,875 | +10% $-1,753 |
| Rate | -1.0pp $-1,674 | -0.5pp $-1,833 | base $-1,997 | +0.5pp $-2,163 | +1.0pp $-2,332 |
UW: 25.0% down · 7.5% · 30yr · 1.5% tax · 5.0% vac · 8.0% maint · 8.0% mgmt
Financing live
Cash to close
- Down payment
- $160,349
- Closing costs
- $19,242
- Reserves months
- —
- Total cash needed
- —
Loan-product check · same deal, 3 products live
Conventional
25% down · 7.5% · 30yr
- Down + closing
- —
- Monthly P&I
- —
- Monthly cashflow
- —
- DSCR
- —
- Eligible?
- —
Personal DTI + credit; lowest rate.
DSCR
20% down · 8.5% · 30yr
- Down + closing
- —
- Monthly P&I
- —
- Monthly cashflow
- —
- DSCR
- —
- Eligible?
- —
No personal income docs; deal must DSCR.
Hard money
10% down · 12.0% · 12mo
- Down + closing
- —
- Monthly P&I
- —
- Monthly cashflow
- —
- DSCR
- —
- Eligible?
- —
Short-term bridge; refi at stabilization.
Rent comps 18 comps
| Address | Beds | Baths | Sqft | Rent | $/sqft | DOM | Units | Dist |
|---|---|---|---|---|---|---|---|---|
| 12153 Coal Creek Way Rancho Cordova, CA | 3.0 | 2.5 | 1906 | $2,750 | $1.44 | 16d | 1 | 0.30mi |
| 4013 Trento Way Rancho Cordova, CA | 4.0 | 3.0 | 2371 | $3,225 | $1.36 | 18d | 1 | 0.57mi |
| 4143 Cahakia Pl Rancho Cordova, CA | 3.0 | 2.0 | 1650 | $2,795 | $1.69 | 45d | 1 | 0.57mi |
| 11965 Pericles Dr Rancho Cordova, CA | 4.0 | 3.0 | 2580 | $2,900 | $1.12 | 45d | 1 | 0.89mi |
| 11795 Corino Way Rancho Cordova, CA | 3.0 | 2.0 | 2000 | $2,880 | $1.44 | 0d | 1 | 1.13mi |
| 11832 Stoney Ridge Way Rancho Cordova, CA | 4.0 | 2.5 | 2019 | $2,695 | $1.33 | 12d | 1 | 1.14mi |
| 11688 Giacinta Ln Rancho Cordova, CA | 4.0 | 2.5 | 1765 | $3,499 | $1.98 | 13d | 1 | 1.22mi |
| 11664 Giacinta Ln Rancho Cordova, CA | 3.0 | 2.5 | 1529 | $3,199 | $2.09 | 0d | 1 | 1.24mi |
| 11684 Fiorenza Ln Rancho Cordova, CA | 4.0 | 2.5 | 1765 | $3,529 | $2.00 | 23d | 1 | 1.24mi |
| 4071 Quorra Pl Rancho Cordova, CA | 3.0 | 2.5 | 1600 | $3,279 | $2.05 | 0d | 1 | 1.25mi |
| 11643 Giacinta Ln Rancho Cordova, CA | 3.0 | 2.5 | 1529 | $3,169 | $2.07 | 25d | 1 | 1.28mi |
| 11641 Fiorenza Ln Rancho Cordova, CA | 3.0 | 2.5 | 1600 | $3,189 | $1.99 | 45d | 1 | 1.28mi |
| 3686 Rockdale Dr Rancho Cordova, CA | 4.0 | 2.0 | 1880 | $2,795 | $1.49 | 9d | 1 | 1.29mi |
| 12579 Bellmead Way Rancho Cordova, CA | 3.0 | 2.0 | 1603 | $2,650 | $1.65 | 4d | 1 | 1.31mi |
| 11617 Venitia Ln Rancho Cordova, CA | 3.0 | 2.5 | 1600 | $3,249 | $2.03 | 9d | 1 | 1.34mi |
| 4480 Arctic Tern Way Rancho Cordova, CA | 4.0 | 2.5 | 2550 | $3,000 | $1.18 | 45d | 1 | 1.35mi |
| 4328 Greenshank Cir Rancho Cordova, CA | 4.0 | 2.0 | 1800 | $3,100 | $1.72 | 45d | 1 | 1.44mi |
| 4454 Greenshank Way Rancho Cordova, CA | 4.0 | 3.0 | 1900 | $2,795 | $1.47 | 0d | 1 | 1.48mi |
Listing history 17 events
-
2026-06-21days on market $570,000 Active 199 DOM
-
2026-06-18days on market $570,000 Active 196 DOM
-
2026-06-17days on market $570,000 Active 195 DOM
-
2026-06-16days on market $570,000 Active 194 DOM
-
2026-06-15days on market $570,000 Active 193 DOM
-
2026-06-13days on market $570,000 Active 191 DOM
-
2026-06-13days on market $570,000 Active 190 DOM
-
2026-06-09days on market $570,000 Active 187 DOM
-
2026-06-08days on market $570,000 Active 186 DOM
-
2026-06-07days on market $570,000 Active 185 DOM
-
2026-06-05days on market $570,000 Active 182 DOM
-
2026-06-03days on market $570,000 Active 181 DOM
-
2026-06-02days on market $570,000 Active 180 DOM
-
2026-06-01days on market $570,000 Active 179 DOM
-
2026-05-31days on market $570,000 Active 178 DOM
-
2026-03-31price $570,000 438-char remark
Show marketing remark (438 chars)
Residence Three: Designed with versatility in mind, this home features a full downstairs bedroom and bath, ideal for guests or a home office. . Upstairs, an airy layout opens to below, with a private primary suite and well-separated secondary bedrooms. Enjoy the luxuries included in a Cresleigh Home such as hand set tiles in entry way, kitchen and wet areas, large eat-in kitchen island, ample storage, and All-Ready Smart Home package.
-
2025-12-04$561,000 Active 438-char remark
Show marketing remark (438 chars)
Residence Three: Designed with versatility in mind, this home features a full downstairs bedroom and bath, ideal for guests or a home office. . Upstairs, an airy layout opens to below, with a private primary suite and well-separated secondary bedrooms. Enjoy the luxuries included in a Cresleigh Home such as hand set tiles in entry way, kitchen and wet areas, large eat-in kitchen island, ample storage, and All-Ready Smart Home package.
ⓘ Source: listings_history table (triggers on properties + properties_extension) + one-shot
backfill from property_details.listing_events for pre-trigger history.
Nearby sold comps map
Loading sold comps map…
Walkable amenities ~0.75 mi
Loading nearby amenities…
Taxation est. · year 1
- Rental income
- $37,002
- − Mortgage interest
- −$35,928
- − Property taxes
- −$9,621
- − Insurance
- −$3,207
- − Repairs & maintenance
- −$2,960
- − Management
- −$2,960
- − Depreciation
- −$18,659
- Taxable loss
- −$36,333
- Est. tax savings @ 24.0%
- +$8,720
- After-tax cash flow
- $-15,239/yr
For passive investors: Depreciation is non-cash, so a rental often shows a tax loss while cash-flowing — sheltering income. Rental losses are passive: they offset passive income freely, and up to $25,000/yr can offset ordinary (W-2) income if you actively participate and your MAGI is under $100k (phasing out to $0 by $150k); unused losses carry forward. On sale, claimed depreciation is recaptured at up to 25%, and gains may owe capital-gains tax (a 1031 exchange can defer both). Figures are a year-1 estimate at your 24.0% rate — not tax advice; consult a CPA.
Schools (NCES district)
- District
- Elk Grove Unified
- NCES district ID
- 0612330
- Math proficiency
- 40% ▼ -5.00%
- Reading proficiency
- 51% ▼ -5.00%
- Median HH income
- $67,860
- Composite
- 40.72/100
- National rank
- #3658
- State rank
- #165 of 517 in CA
Livability — Rancho Cordova
- Score
- 68/100
- State rank
- #268
- US rank
- #9126
Category grades
Schools grade is shown separately in the Schools card above.
Census & demographics
- Census place
- Rancho Cordova, CA
- County
- Sacramento County · 1,539,646 people
- City population
- 98,329
- Metro
- Sacramento-Roseville-Folsom, CA
- Population (ZIP)
- 17,768
- Household income
- $155,855
- Rent vs Own
- Severe rent burden
- 172.0
Population outlook (Sacramento County) Hauer SSP2
- Today (2025)
- 1,660,763 people
- By 2030
- 1,732,990 · +4.3%
- By 2040
- 1,855,755 · +11.7%
- By 2050
- 1,941,335 · +16.9%
- By 2075
- 2,046,162 · +23.2%
- By 2100
- 1,961,444 · +18.1%
Race, ethnicity, and origin ACS 2023
- Neighborhood character
- Highly diverse neighborhood (Simpson 0.72)
- Race & ethnicity
- White 42% Asian 28% Hispanic / Latino 15% Two or more races 13% Black 7%
- Hispanic origin (detail)
- Mexican 11% Puerto Rican 1%
- Common ancestry
- Italian 3% Slovak 2% Subsaharan African 2%
- Foreign-born
- 25% · China, South Korea, Canada
- Languages at home
- 67% English-only · Other Asian/Pacific 7% Other Indo-European 7% Tagalog/Filipino 5%
Political lean MEDSL · Sacramento
- 2024 margin
- D (+19.7) · D 58.1% · R 38.4% · Other 3.5%
- 2008→2024 swing
- +0.7pp no change · 2008: 19.0pp · 2024: 19.7pp
- All cycles
- 2024: D+19.7 2020: D+25.3 2016: D+23.7 2012: D+16.3 2008: D+19.0
Not yet ingested
- Civics
- —
Market trends
- HPI YoY
- ▲ 52.05%
- Current HPI
- 236.1388
- Rent YoY
- ▲ 2.08%
- Metro
- Sacramento-Roseville-Folsom, CA
- State GDP YoY
- ▲ 3.21%
- F500 in state
- 116
Industry mix (Fortune 500 HQ in CA)
| Industry | F500 HQs | Revenue |
|---|---|---|
| Technology | 27 | $1,492B |
|
||
| Financial Services | 3 | $174B |
|
||
| Retail | 3 | $44B |
|
||
| Insurance | 3 | $26B |
|
||
| Media / Entertainment | 2 | $115B |
|
||
| Pharmaceuticals / Biotech | 2 | $62B |
|
||
Price history
+1.6% since first listed2 events — show timeline
- 2026-03-31 Price Changed $570,000 Zillow
- 2025-12-04 Listed $561,000 Zillow
Cash-flow waterfall
monthlySold comps — $/sqft
last 12 mo · ≤1 miLoading sold comps…