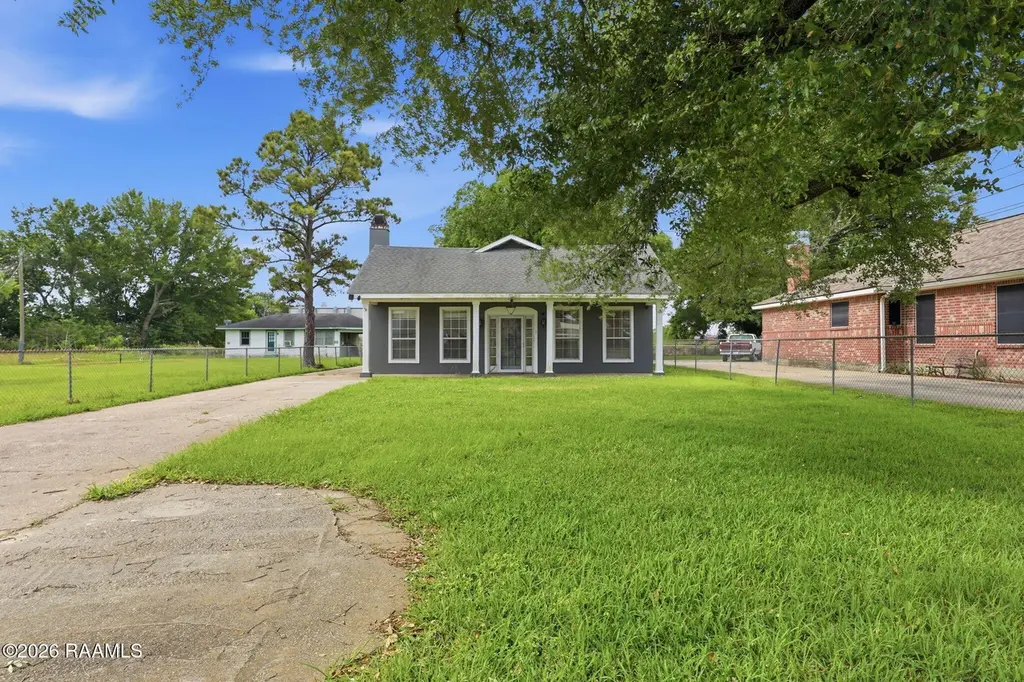
939 Delhomme Ave · Scott, LA
Flood risk 1/10 · Minimal
- FEMA flood zone
- AE
- Chance of flooding over 30 yrs
- 0.0%
- Est. flood insurance / yr
- $1,737 – $8,500
Fire risk 2/10 · Minimal
- Est. fire insurance / yr
- $1,269 – $2,357
Heat risk 9/10 · Severe
- Hot days now (above 109°F)
- 7 days/yr
- Hot days in 30 yrs
- 21 days/yr
Wind risk 9/10 · Severe
- Chance of severe wind over 30 yrs
- 99.0%
Air-quality risk 1/10 · Minimal
- Unhealthy air days now
- 0 days/yr
- Unhealthy air days in 30 yrs
- 0 days/yr
Risk factors via First Street. Map © Google.
Why this score? — see what drove the B- grade
The composite is a weighted blend of 9 inputs, each scored 0–100. Each bar is that input's sub-score; the figure is the points it added to the 100-point composite (weight × sub-score).
- Cash flow +30.0/30.0
- 1% rule +10.0/10.0
- DSCR +10.0/10.0
- ARV discount +7.5/15.0
- Schools +3.6/10.0
- Livability +3.3/5.0
- Rent growth +2.5/5.0
- Condition / age +2.5/5.0
- Appreciation +0.0/10.0
$133,900
🖨 Deal sheet 📄 Offer letter ✓ Due diligence
Listing remarks MLS
Nestled in the heart of the Boudin Festival City of Scott, you'll come home to an updated cute and chic 2BR/2BA brick home. It's a perfect starter home that boasts 2 large open living areas on top of a corner breakfast nook. Modern updates in kitchen, master bath and guest bath. And we've even thrown in the appliances (stove & dishwasher). Mature landscaping, storage area, front and backyard, beautiful lot with the ease of access to local favorites with a blank space to add even more fun to your outside country living lifestyle.
Key facts
- 0.29 acre lot
- 2 parking spots
- Built 1973
Neighborhood map
What this means for you Summary
Snapshot
- This is a 2-bed/2.0-bath single-family listed at $134k.
Deal economics
- At list price, monthly cash flow is $351 ($4k/yr) — positive.
- The deal already cash-flows at list — no discount required.
- Meets the 1% rule at list price ($2k rent vs $134k).
- Cap rate 13.3% vs local median 4.7% in Scott — top-decile yield for the area; either an underpriced asset or a hidden risk that comps aren't pricing in. Stress-test before assuming the spread holds.
Location & tenants
- Location reads 66/100 on livability (#116 in LA) — a middle-class / working-renter tenant base. Strengths: cost of living A+, health & safety A+, housing B+; Watch: crime F, amenities F, commute F.
- Lafayette Parish (urban): math 38% / reading 46% proficiency, ranked #19 of 98 in LA (top 19%) — families likely to look elsewhere, expect single-tenant / working-renter base with shorter leases.
- Zoned schools: Westside Elementary School (math 32% / reading 34%, grade F, #297 of 646 statewide, top 46%, 635 students, 72% FRL); Scott Middle School (math 20% / reading 28%, grade F, #143 of 218 statewide, top 65%, 559 students, 65% FRL); Acadiana High School (math 31% / reading 29%, grade F, #125 of 265 statewide, top 47%, 1,813 students, 56% FRL).
- Zoned-school proficiency averages 29% at this address vs 42% district-wide (-13 pts) — the specific schools serving this property underperform the Lafayette Parish average; the district grade overstates school quality for this exact location.
- Market conditions: 276 active listings in the ZIP; 4 comparable units currently listed for rent nearby; rentals leasing fast (median 13d on market — plan ~1-2 weeks tenant-placement turnaround); 1,585 units permitted in Lafayette Parish in 2024 (10 in 5+ unit buildings).
Forward outlook
- Local home prices are declining (-3.0%/yr); year-one equity from $926 of loan paydown is wiped out by about $4k of value loss. Plan a longer hold.
- Lafayette County population projected at +34% by 2050 — long-run rental-demand tailwind backs the buy-and-hold thesis.
- At projected returns (-3.0% appreciation + 3.0% rent growth), your $37k cash investment doubles in ~10 years — after that, you're playing with house money.
Negotiation context
- Only 8 days on market — expect competitive offers; lowballing is unlikely to land.
- 3 sale attempts since 8y ago with the ask held roughly flat each time — persistent listings suggest the price (not the market) is what's stuck; bring a comps-based counter.
- Current owner paid $106k; 27% above their basis — modest negotiation headroom, anchor on the comps not their cost.
Risks & watch-outs
- Watch-outs: flood insurance adds $427/mo.
- Climate carrying-cost: in FEMA flood zone AE (mandatory federal flood insurance); severe wind risk, 99% chance of damaging wind over 30y; extreme-heat days projected 7→21/yr by 2055 (HVAC capex compounding) — expect insurance premiums to compound above CPI over the hold.
Questions for the listing agent
- Built in 1973 — when were the roof, HVAC, electrical panel, plumbing, and water heater last replaced?
- What's the actual annual flood-insurance premium (NFIP or private), and is the property in a SFHA with mandatory coverage?
- Is there a deadline driving the sale (1031 exchange, divorce, estate, relocation)? That informs how much negotiation room exists.
- Schools are B-rated — typically a magnet for longer-tenancy family renters. What's the average tenant stay here, and is there a school-zone premium baked into asking?
- Crime grade is F in this area — have there been break-ins, vandalism, or insurance claims at this property in the last 3 years? What carrier currently insures it and at what premium?
- What's the average days-on-market for RENTAL listings here right now (not sales)? A rising rental-DOM trend means longer vacancies and softer asking-rent achievability than the comps imply.
- What's the recent tenant-quality profile in this submarket — average credit score on applications, eviction rate, late-payment / NSF rate, and stable-employment percentage? A property-management company in the area should have these aggregated.
- How much new for-sale + rental construction is in the pipeline within 1–3 miles? Heavy new supply typically softens prices + rents 12–24 months out; constrained supply supports both.
Investment metrics
- 1% rule
- 1.53% ✓
- Cap rate
- 13.26%
- Cash-on-cash
- 24.90%
- DSCR
- 2.11
- GRM
- 5.5
CMA / ARV
- ARV (median comp)
- $386,179
- List price
- $133,900
- Delta
- -65.33%
- Verdict
- UNDERPRICED
- Comps
- 20 within 1.0 mi
Show comp detail 12 sales within ~0.75 mi
| Address | Dist | Beds/Ba | Sqft | Sold | Price | $/sf | Match |
|---|---|---|---|---|---|---|---|
| 205 Boxview St | 0.49mi | 3/2.0 (+1) | 1,626 (-5%) | 3mo | $335,000 | $206 | 62 |
| 427 Bozeman Trl | 0.49mi | 3/2.0 (+1) | 1,836 (+7%) | 1mo | $399,904 | $218 | 59 |
| 1009 Stephen St | 0.59mi | 3/2.0 (+1) | 1,761 (+3%) | 6mo | $239,000 | $136 | 58 |
| 405 Bozeman Trl | 0.52mi | 3/2.0 (+1) | 1,836 (+7%) | 7mo | $377,742 | $206 | 53 |
| 203 Boxview St | 0.48mi | 3/2.0 (+1) | 1,616 (-5%) | 14mo | $348,000 | $215 | 52 |
| 337 Bozeman Trl | 0.50mi | 3/2.0 (+1) | 1,521 (-11%) | 5mo | $297,500 | $196 | 50 |
| 205 Keystone Dr | 0.62mi | 3/2.0 (+1) | 1,817 (+6%) | 7mo | $347,900 | $191 | 50 |
| 216 Keystone Dr | 0.60mi | 3/2.0 (+1) | 1,559 (-9%) | 6mo | $329,000 | $211 | 48 |
| 100 Sandstone Ave | 0.74mi | 3/2.0 (+1) | 1,578 (-8%) | 1mo | $345,000 | $219 | 47 |
| 311 Villager Ave Unit C | 0.59mi | 3/2.0 (+1) | 1,913 (+12%) | 2mo | $437,000 | $228 | 46 |
| 305 Villager Ave | 0.64mi | 3/2.5 (+1) | 1,800 (+5%) | 13mo | $360,000 | $200 | 43 |
| 316 Sandstone Ave | 0.56mi | 3/3.0 (+1) | 1,507 (-12%) | 7mo | $302,500 | $201 | 40 |
Match score weights: distance 35% · size 25% · config 20% · recency 20%. Top-matched comps best support the ARV.
Projected returns pro-forma
-3.0% appreciation · 3.0% rent growth · sell at horizon
- IRR
- 0.6%
- Equity multiple
- 1.02×
- Total profit
- $914
- Equity at exit
- $19,965
- IRR
- 10.4%
- Equity multiple
- 1.82×
- Total profit
- $30,576
- Equity at exit
- $11,577
Cash invested: $37,492 (down + closing). Projections, not guarantees.
Landlord ↔ Tenant lean methodology
- Overall (STATE)
- 90 Strongly Landlord-Friendly
- State Louisiana
- 90 Strongly Landlord-Friendly · R+12
- County
- — inherits STATE
- City
- — inherits STATE
ZIP-level market 70583
- Active inventory
- 276
- Price-to-rent
- 5.5×
Monthly cashflow live
- Estimated rent
- $2,045 medium interval (Pro) →
- Mortgage (P&I)
- −$702
- Tax from tax record
- −$80 /mo · $959/yr
- Insurance
- −$56
- Flood insurance flood zone
- −$427 /mo · $5,118/yr
- HOA
- −$0
- Vacancy / Maint / Mgmt
- −$429
- Net cashflow
- $351
Break-even live
UW: 25.0% down · 7.5% · 30yr · 1.5% tax · 5.0% vac · 8.0% maint · 8.0% mgmt
Financing live
Cash to close
- Down payment
- $33,475
- Closing costs
- $4,017
- Reserves months
- —
- Total cash needed
- —
Loan-product check · same deal, 3 products live
Conventional
25% down · 7.5% · 30yr
- Down + closing
- —
- Monthly P&I
- —
- Monthly cashflow
- —
- DSCR
- —
- Eligible?
- —
Personal DTI + credit; lowest rate.
DSCR
20% down · 8.5% · 30yr
- Down + closing
- —
- Monthly P&I
- —
- Monthly cashflow
- —
- DSCR
- —
- Eligible?
- —
No personal income docs; deal must DSCR.
Hard money
10% down · 12.0% · 12mo
- Down + closing
- —
- Monthly P&I
- —
- Monthly cashflow
- —
- DSCR
- —
- Eligible?
- —
Short-term bridge; refi at stabilization.
Rent comps 4 comps
| Address | Beds | Baths | Sqft | Rent | $/sqft | DOM | Units | Dist |
|---|---|---|---|---|---|---|---|---|
| 128 Oak Village Dr Scott, LA | 3.0 | 2.0 | 1445 | $2,450 | $1.70 | 13d | 1 | 0.50mi |
| 315 Sandstone Ave #202 Scott, LA | 2.0 | 2.5 | 1193 | $1,895 | $1.59 | 13d | 1 | 0.52mi |
| 1313 Apollo Rd Scott, LA | 1.0–3.0 | 1.0–2.0 | 1100 | $1,668 | $1.52 | 13d | 10 | 1.08mi |
| 108 Notre Dame Dr Lafayette, LA | 3.0 | 3.0 | 1700 | $1,700 | $1.00 | 43d | 1 | 1.31mi |
Listing history 8 events
-
2026-05-14status Pending 683-char remark
-
2026-05-06$133,900 Active 683-char remark
-
2025-12-01price $149,900
-
2025-09-02price $160,000
-
2025-08-15$165,000 Active
-
2019-05-01soldstatus $105,500
-
2019-04-26soldstatus $105,500
Show marketing remark (538 chars)
Nestled in the heart of the Boudin Festival City of Scott, you'll come home to an updated cute and chic 2BR/2BA brick home. It's a perfect starter home that boasts 2 large open living areas on top of a corner breakfast nook. Modern updates in kitchen, master bath and guest bath. And we've even thrown in the appliances (stove & dishwasher). Mature landscaping, storage area, front and backyard, beautiful lot with the ease of access to local favorites with a blank space to add even more fun to your outside country living lifestyle.
-
2018-08-09$110,000
Show marketing remark (538 chars)
Nestled in the heart of the Boudin Festival City of Scott, you'll come home to an updated cute and chic 2BR/2BA brick home. It's a perfect starter home that boasts 2 large open living areas on top of a corner breakfast nook. Modern updates in kitchen, master bath and guest bath. And we've even thrown in the appliances (stove & dishwasher). Mature landscaping, storage area, front and backyard, beautiful lot with the ease of access to local favorites with a blank space to add even more fun to your outside country living lifestyle.
ⓘ Source: listings_history table (triggers on properties + properties_extension) + one-shot
backfill from property_details.listing_events for pre-trigger history.
Tax reassessment forecast LA · Resets to sale price
- Current annual tax
- $959 · $80/mo
- Projected year-2 tax
- $959 · $80/mo
- Expected delta
- $0/yr ($0/mo · 0.0%)
ⓘ Screening estimate from a state-policy table — verify with the county assessor before closing.
Climate risk First Street
- Flood 1/10 Low FEMA zone AE · 0% chance over 30 yrs
- Wildfire 2/10 Low
- Heat 9/10 Extreme 7 d/yr ≥109°F today · 21 d/yr by 30 yrs out
- Wind 9/10 Extreme 99% chance of damaging wind over 30 yrs
- Air quality 1/10 Low 0 unhealthy d/yr today · 0 by 30 yrs out
Nearby sold comps map
Loading sold comps map…
Walkable amenities ~0.75 mi
Loading nearby amenities…
Taxation est. · year 1
- Rental income
- $24,542
- − Mortgage interest
- −$7,500
- − Property taxes
- −$959
- − Insurance
- −$5,788
- − Repairs & maintenance
- −$1,963
- − Management
- −$1,963
- − Depreciation
- −$3,895
- Taxable income
- $2,473
- Est. tax owed @ 24.0%
- −$593
- After-tax cash flow
- $3,622/yr
For passive investors: Depreciation is non-cash, so a rental often shows a tax loss while cash-flowing — sheltering income. Rental losses are passive: they offset passive income freely, and up to $25,000/yr can offset ordinary (W-2) income if you actively participate and your MAGI is under $100k (phasing out to $0 by $150k); unused losses carry forward. On sale, claimed depreciation is recaptured at up to 25%, and gains may owe capital-gains tax (a 1031 exchange can defer both). Figures are a year-1 estimate at your 24.0% rate — not tax advice; consult a CPA.
Schools (NCES district)
- District
- Lafayette Parish
- NCES district ID
- 2200870
- Math proficiency
- 38% ▼ -32.00%
- Reading proficiency
- 46% ▼ -24.00%
- Median HH income
- $50,238
- Composite
- 36.15/100
- National rank
- #4741
- State rank
- #19 of 98 in LA
Livability — Scott
- Score
- 66/100
- State rank
- #116
- US rank
- #11265
Category grades
Schools grade is shown separately in the Schools card above.
Census & demographics
- Census place
- Scott, LA
- City population
- 8,670
- Population (ZIP)
- 8,670
Population outlook (Lafayette County) Hauer SSP2
- Today (2025)
- 280,930 people
- By 2030
- 301,092 · +7.2%
- By 2040
- 339,456 · +20.8%
- By 2050
- 375,156 · +33.5%
- By 2075
- 451,672 · +60.8%
- By 2100
- 497,203 · +77.0%
Race, ethnicity, and origin ACS 2023
- Neighborhood character
- Predominantly White (68%)
- Race & ethnicity
- White 68% Hispanic / Latino 16% Black 13% Two or more races 11%
- Hispanic origin (detail)
- Mexican 7% Cuban 2%
- Common ancestry
- Lithuanian 11% Slovak 3% Italian 1%
- Foreign-born
- 11% · Canada
- Languages at home
- 81% English-only · Spanish 12% French/Haitian/Cajun 7%
Political lean MEDSL · Lafayette
- 2024 margin
- Solid R (+31.4) · D 33.5% · R 64.8% · Other 1.7%
- 2008→2024 swing
- -0.1pp no change · 2008: -31.3pp · 2024: -31.4pp
- All cycles
- 2024: R+31.4 2020: R+28.7 2016: R+33.6 2012: R+33.7 2008: R+31.3
Not yet ingested
- Civics
- —
Market trends
- HPI YoY
- ▼ -84.03%
- Current HPI
- 132.4083
- Rent YoY
- —
- Metro
- —
- State GDP YoY
- ▲ 3.29%
- F500 in state
- 10
Industry mix (Fortune 500 HQ in LA)
| Industry | F500 HQs | Revenue |
|---|---|---|
| Telecommunications | 2 | $23B |
|
||
| Utilities | 1 | $12B |
|
||
| Wholesale / Distribution | 1 | $5B |
|
||
| Advertising | 1 | $2B |
|
||
Price history
+21.7% since first listed8 events — show timeline
- 2026-05-14 Pending — AcadianaMLS
- 2026-05-06 Listed $133,900 AcadianaMLS
- 2025-12-01 Price Changed $149,900 AcadianaMLS
- 2025-09-02 Price Changed $160,000 AcadianaMLS
- 2025-08-15 Listed $165,000 AcadianaMLS
- 2019-05-01 Sold (Public Records) $105,500 Public Records
- 2019-04-26 Sold (MLS) $105,500 AcadianaMLS
- 2018-08-09 Listed $110,000 AcadianaMLS
Property tax history
+44.1%/yrLatest (2025): $959 · -1.3% YoY. Source: county tax records.
Cash-flow waterfall
monthlySold comps — $/sqft
last 12 mo · ≤1 miLoading sold comps…