5300 Washington St Unit L338 · Hollywood, FL
Flood risk 1/10 · Minimal
- FEMA flood zone
- X (shaded)
- Chance of flooding over 30 yrs
- 0.0%
- Est. flood insurance / yr
- $507 – $1,088
Fire risk 1/10 · Minimal
- Est. fire insurance / yr
- $947 – $1,759
Heat risk 10/10 · Severe
- Hot days now (above 105°F)
- 6 days/yr
- Hot days in 30 yrs
- 21 days/yr
Wind risk 10/10 · Severe
- Chance of severe wind over 30 yrs
- 99.0%
Air-quality risk 2/10 · Minimal
- Unhealthy air days now
- 2 days/yr
- Unhealthy air days in 30 yrs
- 2 days/yr
Risk factors via First Street. Map © Google.
Why this score? — see what drove the C- grade
The composite is a weighted blend of 9 inputs, each scored 0–100. Each bar is that input's sub-score; the figure is the points it added to the 100-point composite (weight × sub-score).
- Cash flow +17.3/30.0
- 1% rule +10.0/10.0
- ARV discount +7.5/15.0
- DSCR +5.4/10.0
- Schools +4.1/10.0
- Livability +3.8/5.0
- Rent growth +3.1/5.0
- Condition / age +2.5/5.0
- Appreciation +0.0/10.0
$104,900
🖨 Deal sheet 📄 Offer letter ✓ Due diligence
Listing remarks
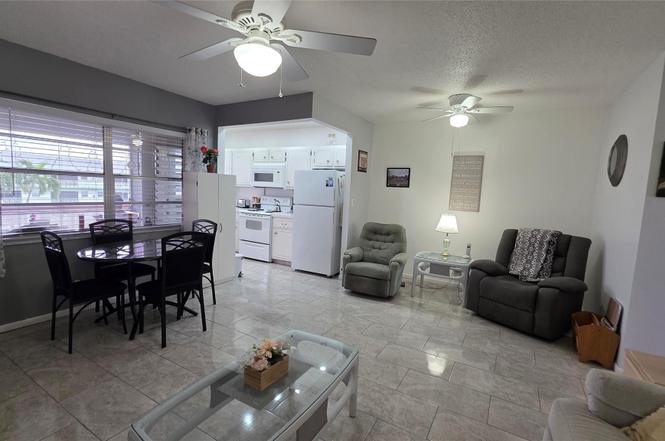
Beautiful 1/1.5 unit in the active community of Beverly Hills. A 55 and over complex that houses this beautiful unit. It comes fully furnished and is ready for it's new owner. Close to shopping, major highways, restaurants and casinos. This clean unit can be your year round home or a perfect winter getaway. Call now for your own personal visit.
Key facts
- $532 HOA
- 39 parking spots
- Built 1970
Property features AI
Finance
- Financial info: Monthly HOA fee of $532
- HOA & community: HOA with monthly fee; HOA amenities: Billiard room, Clubhouse, Fitness center, Maintenance; HOA fee includes grounds and structure maintenance, sewer, trash, water, common areas, elevator, reserve funds; Senior community
Exterior
- Parking: Assigned parking (39 spaces total)
- Security: Security fence; Entry phone/intercom
- Utilities: Water included in HOA; Sewer included in HOA; Trash included in HOA; Power available (central systems)
- Home design: Condominium; Resale condition; 4-story building; Third floor entry
- Construction: Block construction
- Exterior features: Fenced; Not waterfront
Interior
- Kitchen: Electric range; Refrigerator
- Bedrooms: 1 bedroom on the main level (third floor entry)
- Flooring: Tile
- Bathrooms: 1 full bathroom; 1 half bathroom
- Heating & cooling: Central heating; Central air conditioning
- Interior features: Furnished; Tile flooring
- Laundry & utility: Electric water heater
Neighborhood map
What this means for you Summary
Snapshot
- This is a 1-bed/1.5-bath condo listed at $105k.
Deal economics
- At list price, monthly cash flow is $77 ($918/yr) — positive.
- The deal already cash-flows at list — no discount required.
- Meets the 1% rule at list price ($2k rent vs $105k).
- Recommended offer: $95k (9.0% below list) — sets the bar for market timing.
- Cap rate 7.2% vs local median 3.2% in Hollywood — top-decile yield for the area; either an underpriced asset or a hidden risk that comps aren't pricing in. Stress-test before assuming the spread holds.
Location & tenants
- Location reads 76/100 on livability (#232 in FL, #3,548 nationally) — a middle-class / working-renter tenant base. Strengths: commute A+, housing A+, crime B+; Watch: amenities D.
- Broward (suburban): math 42% / reading 53% proficiency, ranked #46 of 73 in FL (top 63%) — families likely to look elsewhere, expect single-tenant / working-renter base with shorter leases.
- Market conditions: Rents rising (+2.4%/yr); 529 active listings in the ZIP; 40 comparable units currently listed for rent nearby; rentals at typical pace (median 17d on market — plan ~3-4 weeks tenant-placement turnaround); 2,111 units permitted in Broward County in 2024 (1,265 in 5+ unit buildings).
Forward outlook
- Local home prices are declining (-3.0%/yr); year-one equity from $725 of loan paydown is wiped out by about $3k of value loss. Plan a longer hold.
- Broward County population projected at +34% by 2050 — long-run rental-demand tailwind backs the buy-and-hold thesis.
Negotiation context
- It's been on market 99 days — a 9% lower offer ($95k) is reasonable based on typical stale-listing flexibility.
Risks & watch-outs
- Watch-outs: HOA is 32% of rent.
- Climate carrying-cost: severe wind risk, 99% chance of damaging wind over 30y; extreme-heat days projected 6→21/yr by 2055 (HVAC capex compounding) — expect insurance premiums to compound above CPI over the hold.
Questions for the listing agent
- It's been on market 99 days. Have you received any prior offers? Is the seller open to a 9% concession, seller financing, or rate buy-down credit?
- Built in 1970 — when were the roof, HVAC, electrical panel, plumbing, and water heater last replaced?
- What does the HOA fee cover, when was the last increase, and are there any pending special assessments or reserve-fund shortfalls?
- Any open or pending special assessments — roof, HVAC, plumbing, elevator, façade? What's the per-unit balance and payoff schedule, and is the seller paying it off at close or rolling it to the buyer?
- Why hasn't it sold? Are there any deal-killer items the seller is aware of (foundation, flood, title, zoning, code violations)?
- Is there a deadline driving the sale (1031 exchange, divorce, estate, relocation)? That informs how much negotiation room exists.
- What's the average days-on-market for RENTAL listings here right now (not sales)? A rising rental-DOM trend means longer vacancies and softer asking-rent achievability than the comps imply.
- What's the recent tenant-quality profile in this submarket — average credit score on applications, eviction rate, late-payment / NSF rate, and stable-employment percentage? A property-management company in the area should have these aggregated.
- How much new apartment / multifamily construction is in the pipeline within 1–3 miles? Heavy new supply (>2% of stock underway) typically softens rents 12–24 months out; light construction supports rent growth.
Investment metrics
- 1% rule
- 1.61% ✓
- Cap rate
- 7.17%
- Cash-on-cash
- 3.13%
- DSCR
- 1.14
- GRM
- 5.2
CMA / ARV
No comps found within radius.
Projected returns pro-forma
-3.0% appreciation · 2.41% rent growth · sell at horizon
- IRR
- -12.1%
- Equity multiple
- 0.57×
- Total profit
- $-12,768
- Equity at exit
- $15,641
- IRR
- -3.9%
- Equity multiple
- 0.75×
- Total profit
- $-7,449
- Equity at exit
- $9,070
Cash invested: $29,372 (down + closing). Projections, not guarantees.
Landlord ↔ Tenant lean methodology
- Overall (STATE)
- 87 Strongly Landlord-Friendly
- State Florida
- 87 Strongly Landlord-Friendly · R+3
- County
- — inherits STATE
- City
- — inherits STATE
ZIP-level market 33021
- Rents YoY
- 2.4%
- Active inventory
- 529
- Price-to-rent
- 5.2×
Monthly cashflow live
- Estimated rent
- $1,688 high interval (Pro) →
- Mortgage (P&I)
- −$550
- Tax est. 1.5%
- −$131 /mo · $1,574/yr
- Insurance
- −$44
- HOA
- −$532
- Vacancy / Maint / Mgmt
- −$354
- Net cashflow
- $77
Break-even live
UW: 25.0% down · 7.5% · 30yr · 1.5% tax · 5.0% vac · 8.0% maint · 8.0% mgmt
Financing live
Cash to close
- Down payment
- $26,225
- Closing costs
- $3,147
- Reserves months
- —
- Total cash needed
- —
Loan-product check · same deal, 3 products live
Conventional
25% down · 7.5% · 30yr
- Down + closing
- —
- Monthly P&I
- —
- Monthly cashflow
- —
- DSCR
- —
- Eligible?
- —
Personal DTI + credit; lowest rate.
DSCR
20% down · 8.5% · 30yr
- Down + closing
- —
- Monthly P&I
- —
- Monthly cashflow
- —
- DSCR
- —
- Eligible?
- —
No personal income docs; deal must DSCR.
Hard money
10% down · 12.0% · 12mo
- Down + closing
- —
- Monthly P&I
- —
- Monthly cashflow
- —
- DSCR
- —
- Eligible?
- —
Short-term bridge; refi at stabilization.
Rent comps 40 comps
| Address | Beds | Baths | Sqft | Rent | $/sqft | DOM | Units | Dist |
|---|---|---|---|---|---|---|---|---|
| 5500 Washington St Hollywood, FL | 1.0–3.0 | 1.0–2.0 | 1000 | $1,590 | $1.59 | 3d | 18 | 0.21mi |
| 4917 Washington St Hollywood, FL | 1.0 | 1.0 | 600 | $1,300 | $2.17 | 7d | 1 | 0.29mi |
| 5685 Flagler St Unit 2 Hollywood, FL | 2.0 | 1.0 | 420 | $1,900 | $4.52 | 3d | 1 | 0.36mi |
| 5685 Flagler St Unit 2 Hollywood, FL | 2.0 | 1.0 | 420 | $1,900 | $4.52 | 13d | 1 | 0.36mi |
| 5740 Mayo St #4 Hollywood, FL | 2.0 | 1.0 | 550 | $1,895 | $3.45 | 24d | 1 | 0.44mi |
| 5821 Washington St Hollywood, FL | 1.0 | 1.0 | 650 | $1,775 | $2.73 | 24d | 2 | 0.46mi |
| 5835 Washington St #52 Hollywood, FL | 1.0 | 1.0 | 650 | $1,625 | $2.50 | 10d | 1 | 0.49mi |
| 5835 Washington St #52 Hollywood, FL | 1.0 | 1.0 | 650 | $1,600 | $2.46 | 5d | 1 | 0.49mi |
| 5901 Washington St #247 Hollywood, FL | 1.0 | 1.0 | 650 | $1,650 | $2.54 | 7d | 1 | 0.50mi |
| 5901 Washington St #247 Hollywood, FL | 1.0 | 1.0 | 650 | $1,600 | $2.46 | 24d | 1 | 0.50mi |
| 5401 SW 20th St Unit B West Park, FL | 1.0 | 1.0 | 600 | $1,500 | $2.50 | 24d | 1 | 0.51mi |
| 900 Tallwood Ave #207 Hollywood, FL | 1.0 | 1.0 | 640 | $1,575 | $2.46 | 20d | 1 | 0.56mi |
| 5981 Washington St #219 Hollywood, FL | 1.0 | 1.0 | 450 | $1,500 | $3.33 | 24d | 1 | 0.57mi |
| 5849 Wiley St Hollywood, FL | 1.0 | 1.0 | 350 | $1,475 | $4.21 | 24d | 1 | 0.57mi |
| 5931 Wiley St Unit 5931 Hollywood, FL | 1.0 | 1.0 | 650 | $1,600 | $2.46 | 24d | 1 | 0.64mi |
| 5230 Hollywood Blvd Hollywood, FL | 1.0–4.0 | 1.0–2.0 | 956 | $1,500 | $1.57 | 24d | 1 | 0.68mi |
| 5112 Hollywood Blvd #3 Hollywood, FL | 1.0 | 1.0 | 650 | $1,550 | $2.38 | 16d | 1 | 0.68mi |
| 5112 Hollywood Blvd Hollywood, FL | 1.0–2.0 | 1.0 | 727 | $1,600 | $2.20 | 18d | 2 | 0.68mi |
| 5420 Hollywood Blvd Unit 208 Hollywood, FL | 1.0 | 1.0 | 700 | $1,775 | $2.54 | 3d | 1 | 0.69mi |
| 5420 Hollywood Blvd Unit 208 Hollywood, FL | 1.0 | 1.0 | 700 | $1,775 | $2.54 | 2d | 1 | 0.69mi |
| 5141 Hollywood Blvd Unit 209 Hollywood, FL | 2.0 | 1.0 | 700 | $2,175 | $3.11 | 2d | 1 | 0.73mi |
| 5141 Hollywood Blvd Apt 206 Hollywood, FL | 1.0 | 1.0 | 700 | $1,825 | $2.61 | 2d | 1 | 0.74mi |
| 4933 Hollywood Blvd Unit 5420-202 Hollywood, FL | 1.0 | 1.0 | 650 | $1,750 | $2.69 | 21d | 1 | 0.75mi |
| 4933 Hollywood Blvd Unit 5141-206 Hollywood, FL | 1.0 | 1.0 | 650 | $1,750 | $2.69 | 24d | 1 | 0.75mi |
| 4130 SW 19th St Unit 3 West Park, FL | 1.0 | 1.0 | 450 | $1,400 | $3.11 | 20d | 1 | 0.83mi |
| 5807 SW 25th St West Park, FL | — | 1.0 | 500 | $1,495 | $2.99 | 7d | 1 | 0.93mi |
| 5819 Polk St Unit 4 Hollywood, FL | 1.0 | 1.0 | 602 | $1,425 | $2.37 | 14d | 1 | 1.01mi |
| 5819 Polk St Apt 2 Hollywood, FL | 1.0 | 1.0 | 682 | $1,559 | $2.29 | 7d | 1 | 1.01mi |
| 532 S Crescent Dr Unit 106 Hollywood, FL | — | 1.0 | 550 | $1,425 | $2.59 | 13d | 1 | 1.02mi |
| 1 Main St Miramar, FL | 3.0 | 1.0–3.0 | 1023 | $2,273 | $2.22 | 1d | 36 | 1.04mi |
| 315 S Crescent Dr Hollywood, FL | — | 1.0 | 544 | $1,425 | $2.62 | 15d | 1 | 1.04mi |
| 504 N 57th Ave Unit N Hollywood, FL | 1.0 | 1.0 | 496 | $1,575 | $3.18 | 19d | 1 | 1.06mi |
| 6129 SW 22nd St Miramar, FL | 2.0 | 1.0 | 674 | $2,200 | $3.26 | 16d | 1 | 1.08mi |
| 6129 SW 22nd St Miramar, FL | 2.0 | 1.0 | 674 | $2,200 | $3.26 | 15d | 1 | 1.08mi |
| 3711 Van Buren St #2 Hollywood, FL | 1.0 | 1.0 | 660 | $1,550 | $2.35 | 24d | 1 | 1.11mi |
| 6025 Polk St Apt 8 Hollywood, FL | 1.0 | 1.0 | 700 | $1,400 | $2.00 | 24d | 1 | 1.17mi |
| 3601 Van Buren St Hollywood, FL | 1.0–2.0 | 1.0–2.0 | 941 | $1,725 | $1.83 | 3d | 3 | 1.18mi |
| 6031 Polk St Unit 4 Hollywood, FL | 1.0 | 1.0 | 644 | $1,425 | $2.21 | 24d | 1 | 1.19mi |
| 6014 Fillmore St Hollywood, FL | 1.0 | 1.0 | 450 | $1,425 | $3.17 | 3d | 1 | 1.22mi |
| 6014 Fillmore St Hollywood, FL | 1.0 | 1.0 | 640 | $1,449 | $2.26 | 24d | 1 | 1.22mi |
HOA detail condo
- Monthly dues
- $532 · $6,384/yr
- Assessments
- None detected in remarks — confirm with the listing agent.
Listing history 13 events
-
2026-06-18days on market $104,900 Active 99 DOM
-
2026-06-17days on market $104,900 Active 98 DOM
-
2026-06-16days on market $104,900 Active 97 DOM
-
2026-06-15days on market $104,900 Active 96 DOM
-
2026-06-13days on market $104,900 Active 94 DOM
-
2026-06-09days on market $104,900 Active 90 DOM
-
2026-06-07days on market $104,900 Active 88 DOM
-
2026-06-04days on market $104,900 Active 85 DOM
-
2026-06-03days on market $104,900 Active 84 DOM
-
2026-06-02days on market $104,900 Active 83 DOM
-
2026-06-01days on market $104,900 Active 82 DOM
-
2026-05-31days on market $104,900 Active 81 DOM
-
2025-12-19$104,900 Active
ⓘ Source: listings_history table (triggers on properties + properties_extension) + one-shot
backfill from property_details.listing_events for pre-trigger history.
Climate risk First Street
- Flood 1/10 Low FEMA zone X (shaded) · 0% chance over 30 yrs
- Wildfire 1/10 Low
- Heat 10/10 Extreme 6 d/yr ≥105°F today · 21 d/yr by 30 yrs out
- Wind 10/10 Extreme 99% chance of damaging wind over 30 yrs
- Air quality 2/10 Low 2 unhealthy d/yr today · 2 by 30 yrs out
Nearby sold comps map
Loading sold comps map…
Walkable amenities ~0.75 mi
Loading nearby amenities…
Taxation est. · year 1
- Rental income
- $20,255
- − Mortgage interest
- −$5,876
- − Property taxes
- −$1,574
- − Insurance
- −$524
- − Repairs & maintenance
- −$1,620
- − Management
- −$1,620
- − HOA
- −$6,384
- − Depreciation
- −$3,052
- Taxable loss
- −$395
- Est. tax savings @ 24.0%
- +$95
- After-tax cash flow
- $1,013/yr
For passive investors: Depreciation is non-cash, so a rental often shows a tax loss while cash-flowing — sheltering income. Rental losses are passive: they offset passive income freely, and up to $25,000/yr can offset ordinary (W-2) income if you actively participate and your MAGI is under $100k (phasing out to $0 by $150k); unused losses carry forward. On sale, claimed depreciation is recaptured at up to 25%, and gains may owe capital-gains tax (a 1031 exchange can defer both). Figures are a year-1 estimate at your 24.0% rate — not tax advice; consult a CPA.
Schools (NCES district)
- District
- Broward
- NCES district ID
- 1200180
- Math proficiency
- 42% ▼ -18.00%
- Reading proficiency
- 53% ▼ -5.00%
- Median HH income
- $52,139
- Composite
- 40.88/100
- National rank
- #3621
- State rank
- #46 of 73 in FL
Livability — Hollywood
- Score
- 76/100
- State rank
- #232
- US rank
- #3548
Category grades
Schools grade is shown separately in the Schools card above.
Census & demographics
- Census place
- Hollywood, FL
- County
- Broward County · 1,963,430 people
- City population
- 109,079
- Metro
- Miami-Fort Lauderdale-Pompano Beach, FL
- Population (ZIP)
- 48,464
- Household income
- $71,318
- Rent vs Own
- Severe rent burden
- 2151.0
Population outlook (Broward County) Hauer SSP2
- Today (2025)
- 2,207,033 people
- By 2030
- 2,360,704 · +7.0%
- By 2040
- 2,661,208 · +20.6%
- By 2050
- 2,946,698 · +33.5%
- By 2075
- 3,602,273 · +63.2%
- By 2100
- 3,970,984 · +79.9%
Race, ethnicity, and origin ACS 2023
- Neighborhood character
- Diverse neighborhood (Simpson 0.65)
- Race & ethnicity
- White 45% Hispanic / Latino 37% Two or more races 17% Black 13% Asian 3%
- Hispanic origin (detail)
- Puerto Rican 5% Cuban 10% Dominican 2%
- Common ancestry
- Romanian 3% Scotch-Irish 2% Hispanic 2%
- Foreign-born
- 35% · Canada, Jamaica, Dominican Republic
- Languages at home
- 53% English-only · Spanish 33% French/Haitian/Cajun 4% Russian/Polish/Slavic 2%
Political lean MEDSL · Broward
- 2024 margin
- D (+17.0) · D 58.0% · R 41.0%
- 2008→2024 swing
- -17.8pp toward R · 2008: 34.7pp · 2024: 17.0pp
- All cycles
- 2024: D+17.0 2020: D+29.8 2016: D+35.0 2012: D+34.9 2008: D+34.7
Not yet ingested
- Civics
- —
Market trends
- HPI YoY
- ▼ -404.28%
- Current HPI
- 429.7129
- Rent YoY
- ▲ 2.41%
- Metro
- Miami-Fort Lauderdale-Pompano Beach, FL
- State GDP YoY
- ▲ 3.28%
- F500 in state
- 36
Industry mix (Fortune 500 HQ in FL)
| Industry | F500 HQs | Revenue |
|---|---|---|
| Industrial Technology | 2 | $29B |
|
||
| Insurance | 2 | $17B |
|
||
| Retail | 1 | $60B |
|
||
| Technology Distribution | 1 | $58B |
|
||
| Homebuilding | 1 | $35B |
|
||
| Technology Manufacturing | 1 | $35B |
|
||
Price history
1 event — show timeline
- 2025-12-19 Listed $104,900 Beaches MLS
Cash-flow waterfall
monthlySold comps — $/sqft
last 12 mo · ≤1 miLoading sold comps…