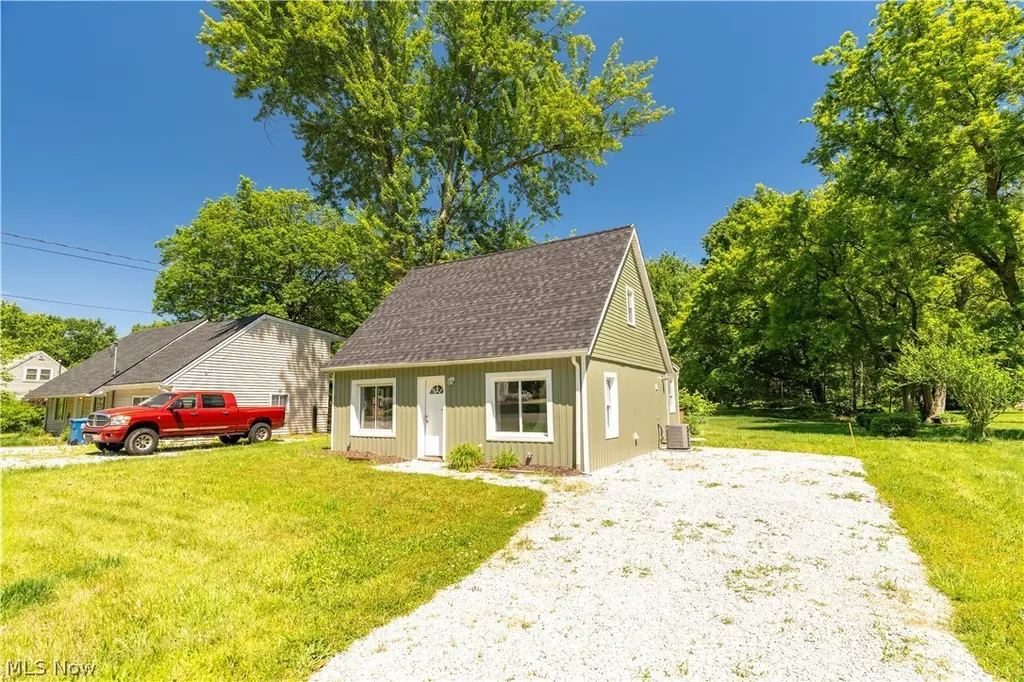
2255 Lake Rd · Lakemore, OH
Flood risk 3/10 · Minor
- FEMA flood zone
- X (unshaded)
- Chance of flooding over 30 yrs
- 0.2%
- Est. flood insurance / yr
- $507 – $1,088
Fire risk 1/10 · Minimal
- Est. fire insurance / yr
- $713 – $1,323
Heat risk 3/10 · Minor
- Hot days now (above 97°F)
- 7 days/yr
- Hot days in 30 yrs
- 17 days/yr
Wind risk 1/10 · Minimal
- Chance of severe wind over 30 yrs
- —
Air-quality risk 2/10 · Minimal
- Unhealthy air days now
- 1 days/yr
- Unhealthy air days in 30 yrs
- 2 days/yr
Risk factors via First Street. Map © Google.
Why this score? — see what drove the C- grade
The composite is a weighted blend of 9 inputs, each scored 0–100. Each bar is that input's sub-score; the figure is the points it added to the 100-point composite (weight × sub-score).
- ARV discount +15.0/15.0
- Cash flow +14.4/30.0
- 1% rule +4.6/10.0
- DSCR +4.4/10.0
- Schools +3.7/10.0
- Livability +3.7/5.0
- Rent growth +2.5/5.0
- Condition / age +2.5/5.0
- Appreciation +0.0/10.0
$159,900
🖨 Deal sheet (PDF) 📄 Offer letter ✓ Due diligence
Listing remarks
Charming and move-in ready, this darling Cape Cod offers 3 bedrooms and 1 full bath, situated on a spacious 3/4-acre lot in Springfield Township. Updates throughout include new flooring, carpet, fresh paint, new appliances, new roof, new furnace, new tankless hot water tank as well as a new well pump and water softener giving you peace of mind for years to come. Enjoy the perfect blend of charm, modern updates, and convenience with an ideal location close to shopping, dining, and everyday amenities. Inspection has been done and all repairs made.
Key facts
- 0.72 acre lot
- Parking
- Built 1950
Property features AI
Exterior
- Parking: Driveway with gravel surface
- Utilities: Public sewer; Well water
- Home design: Two-story property; Above-grade finished area reported by owner (1,114)
- Construction: Vinyl siding construction; Asphalt roof; Year built per public records
- Exterior features: Deck; Shed(s); Chain-link fencing; Lot approximately 0.72 acres
Interior
- Kitchen: Kitchen on the main level (approx. 14 x 11)
- Bedrooms: Two bedrooms total; One main-level bedroom; One second-level bedroom (carpeted, approx. 24 x 16)
- Flooring: Carpet in second-level bedroom
- Bathrooms: One full bathroom on the main level
- Heating & cooling: Gas forced-air heating; Central air conditioning
- Interior features: Crawl space basement; Updated/remodeled condition
- Laundry & utility: Main-level laundry (approx. 7 x 12)
Neighborhood map
What this means for you Summary
Snapshot
- This is a 3-bed/1.0-bath single-family listed at $160k.
Deal economics
- At list price, monthly cash flow is $32 ($383/yr) — positive.
- The deal already cash-flows at list — no discount required.
- To meet the 1% rule (rent ≥ 1% of price), the offer needs to be $154k (3.7% below list).
- Recommended offer: $154k (3.7% below list) — sets the bar for 1% rule.
Location & tenants
- Location reads 73/100 on livability (#338 in OH) — a middle-class / working-renter tenant base. Strengths: cost of living A+, housing A+, health & safety A+; Watch: employment D, crime F, commute F.
- Springfield Local (suburban): math 40% / reading 46% proficiency, ranked #512 of 656 in OH (top 78%) — families likely to look elsewhere, expect single-tenant / working-renter base with shorter leases.
- Zoned schools: Spring Hill Elementary (math 42% / reading 42%, grade F, #1,030 of 1,584 statewide, top 66%, 366 students, 66% FRL); Schrop Intermediate School (math 44% / reading 47%, grade D-, #980 of 1,584 statewide, top 62%, 521 students, 60% FRL); Springfield Junior/Senior High School (math 34% / reading 46%, grade F, #522 of 781 statewide, top 67%, 828 students, 52% FRL).
- Market conditions: 135 active listings in the ZIP; 1 comparable units currently listed for rent nearby; 1,114 units permitted in Summit County in 2024 (397 in 5+ unit buildings).
Forward outlook
- Local home prices are declining (-3.0%/yr); year-one equity from $1k of loan paydown is wiped out by about $5k of value loss. Plan a longer hold.
- Summit County population projected to shrink 6% by 2050 — rents likely to lag national; underwrite the cash flow, not the appreciation.
Negotiation context
- It's been on market 38 days — a 3% lower offer ($155k) is reasonable based on typical stale-listing flexibility.
- 6 sale attempts since 18y ago with the ask held roughly flat each time — persistent listings suggest the price (not the market) is what's stuck; bring a comps-based counter.
- Current owner paid $125k; 28% above their basis — modest negotiation headroom, anchor on the comps not their cost.
Risks & watch-outs
- Watch-outs: built in 1950 — expect roof / HVAC / electrical / plumbing capex.
Questions for the listing agent
- It's been on market 38 days. Have you received any prior offers? Is the seller open to a 4% concession, seller financing, or rate buy-down credit?
- Built in 1950 — when were the roof, HVAC, electrical panel, plumbing, and water heater last replaced?
- Is there a deadline driving the sale (1031 exchange, divorce, estate, relocation)? That informs how much negotiation room exists.
- Schools are D-rated, which usually means shorter tenancies and higher turnover. Who's the typical renter profile here, and what's been the actual vacancy rate?
- Crime grade is F in this area — have there been break-ins, vandalism, or insurance claims at this property in the last 3 years? What carrier currently insures it and at what premium?
- What's the average days-on-market for RENTAL listings here right now (not sales)? A rising rental-DOM trend means longer vacancies and softer asking-rent achievability than the comps imply.
- What's the recent tenant-quality profile in this submarket — average credit score on applications, eviction rate, late-payment / NSF rate, and stable-employment percentage? A property-management company in the area should have these aggregated.
- How much new for-sale + rental construction is in the pipeline within 1–3 miles? Heavy new supply typically softens prices + rents 12–24 months out; constrained supply supports both.
Investment metrics
- 1% rule
- 0.96% ✗
- Cap rate
- 6.53%
- Cash-on-cash
- 0.85%
- DSCR
- 1.04
- GRM
- 8.7
CMA / ARV
- ARV (on-the-fly)
- $226,142
- Comps found
- 1
Show comp detail 1 sale within ~0.75 mi
| Address | Dist | Beds/Ba | Sqft | Sold | Price | $/sf | Match |
|---|---|---|---|---|---|---|---|
| 1295 Hilbish Ave | 0.49mi | 3/2.0 | 1,008 (-10%) | 23mo | $205,000 | $203 | 38 |
Match score weights: distance 35% · size 25% · config 20% · recency 20%. Top-matched comps best support the ARV.
Projected returns pro-forma
-3.0% appreciation · 3.0% rent growth · sell at horizon
- IRR
- -14.9%
- Equity multiple
- 0.47×
- Total profit
- $-23,808
- Equity at exit
- $23,842
- IRR
- -6.2%
- Equity multiple
- 0.60×
- Total profit
- $-17,824
- Equity at exit
- $13,825
Cash invested: $44,772 (down + closing). Projections, not guarantees.
Landlord ↔ Tenant lean methodology
- Overall (STATE)
- 73 Landlord-Friendly
- State Ohio
- 73 Landlord-Friendly · R+6
- County
- — inherits STATE
- City
- — inherits STATE
ZIP-level market 44312
- Active inventory
- 135
- Price-to-rent
- 8.7×
Monthly cashflow live
- Estimated rent
- $1,539 medium interval (Pro) →
- Mortgage (P&I)
- −$839
- Tax from tax record
- −$279 /mo · $3,349/yr
- Insurance
- −$67
- HOA
- −$0
- Vacancy / Maint / Mgmt
- −$323
- Net cashflow
- $32
Break-even live
Sensitivity live
| Price | -10% $122 | -5% $77 | +0% $32 | +5% $-13 | +10% $-59 |
|---|---|---|---|---|---|
| Rent | -10% $-90 | -5% $-29 | +0% $32 | +5% $93 | +10% $154 |
| Rate | -1.0pp $112 | -0.5pp $73 | base $32 | +0.5pp $-10 | +1.0pp $-52 |
UW: 25.0% down · 7.5% · 30yr · 1.5% tax · 5.0% vac · 8.0% maint · 8.0% mgmt
Financing live
Cash to close
- Down payment
- $39,975
- Closing costs
- $4,797
- Reserves months
- —
- Total cash needed
- —
Loan-product check · same deal, 3 products live
Conventional
25% down · 7.5% · 30yr
- Down + closing
- —
- Monthly P&I
- —
- Monthly cashflow
- —
- DSCR
- —
- Eligible?
- —
Personal DTI + credit; lowest rate.
DSCR
20% down · 8.5% · 30yr
- Down + closing
- —
- Monthly P&I
- —
- Monthly cashflow
- —
- DSCR
- —
- Eligible?
- —
No personal income docs; deal must DSCR.
Hard money
10% down · 12.0% · 12mo
- Down + closing
- —
- Monthly P&I
- —
- Monthly cashflow
- —
- DSCR
- —
- Eligible?
- —
Short-term bridge; refi at stabilization.
Rent comps 1 comps
| Address | Beds | Baths | Sqft | Rent | $/sqft | DOM | Units | Dist |
|---|---|---|---|---|---|---|---|---|
| 931 Crestline Dr Akron, OH | 3.0 | 1.0 | 976 | $1,550 | $1.59 | 16d | 1 | 1.14mi |
Listing history 8 events
-
2026-06-21days on market $159,900 Active 38 DOM
-
2026-06-21days on market $159,900 Active 37 DOM
-
2026-06-18days on market $159,900 Active 35 DOM
-
2026-06-17days on market $159,900 Active 34 DOM
-
2026-06-16days on market $159,900 Active 33 DOM
-
2026-06-15days on market $159,900 Active 32 DOM
-
2026-06-15remarks 551-char remark
-
2026-06-15$159,900 Active 31 DOM
ⓘ Source: listings_history table (triggers on properties + properties_extension) + one-shot
backfill from property_details.listing_events for pre-trigger history.
Tax reassessment forecast OH · Partial reset (capped growth)
- Current annual tax
- $3,349 · $279/mo
- Projected year-2 tax
- $3,349 · $279/mo
- Expected delta
- $0/yr ($0/mo · 0.0%)
ⓘ Screening estimate from a state-policy table — verify with the county assessor before closing.
Climate risk First Street
- Flood 3/10 Moderate FEMA zone X (unshaded) · 20% chance over 30 yrs
- Wildfire 1/10 Low
- Heat 3/10 Moderate 7 d/yr ≥97°F today · 17 d/yr by 30 yrs out
- Wind 1/10 Low
- Air quality 2/10 Low 1 unhealthy d/yr today · 2 by 30 yrs out
Nearby sold comps map
Loading sold comps map…
Walkable amenities ~0.75 mi
Loading nearby amenities…
Taxation est. · year 1
- Rental income
- $18,473
- − Mortgage interest
- −$8,957
- − Property taxes
- −$3,349
- − Insurance
- −$800
- − Repairs & maintenance
- −$1,478
- − Management
- −$1,478
- − Depreciation
- −$4,652
- Taxable loss
- −$2,240
- Est. tax savings @ 24.0%
- +$538
- After-tax cash flow
- $920/yr
For passive investors: Depreciation is non-cash, so a rental often shows a tax loss while cash-flowing — sheltering income. Rental losses are passive: they offset passive income freely, and up to $25,000/yr can offset ordinary (W-2) income if you actively participate and your MAGI is under $100k (phasing out to $0 by $150k); unused losses carry forward. On sale, claimed depreciation is recaptured at up to 25%, and gains may owe capital-gains tax (a 1031 exchange can defer both). Figures are a year-1 estimate at your 24.0% rate — not tax advice; consult a CPA.
Schools (NCES district)
- District
- Springfield Local
- NCES district ID
- 3905006
- Math proficiency
- 40% ▼ -16.00%
- Reading proficiency
- 46% ▼ -12.00%
- Median HH income
- $47,669
- Composite
- 36.74/100
- National rank
- #4588
- State rank
- #512 of 656 in OH
Livability — Lakemore
- Score
- 73/100
- State rank
- #338
- US rank
- #5542
Category grades
Schools grade is shown separately in the Schools card above.
Census & demographics
- County
- Summit County · 440,783 people
- City population
- 30,280
- Metro
- Akron, OH
- Population (ZIP)
- 30,280
- Household income
- $65,480
- Rent vs Own
- Severe rent burden
- 483.0
Population outlook (Summit County) Hauer SSP2
- Today (2025)
- 546,583 people
- By 2030
- 544,028 · -0.5%
- By 2040
- 531,363 · -2.8%
- By 2050
- 514,923 · -5.8%
- By 2075
- 481,765 · -11.9%
- By 2100
- 432,265 · -20.9%
Race, ethnicity, and origin ACS 2023
- Neighborhood character
- Predominantly White (90%)
- Race & ethnicity
- White 90% Two or more races 5% Black 3% Hispanic / Latino 2%
- Common ancestry
- Romanian 3% Slovak 2% Serbian 2%
- Foreign-born
- 2% · Canada
- Languages at home
- 97% English-only · Spanish 2% Russian/Polish/Slavic 1%
Political lean MEDSL · Summit
- 2024 margin
- Lean D (+7.0) · D 53.0% · R 46.0%
- 2008→2024 swing
- -9.6pp toward R · 2008: 16.6pp · 2024: 7.0pp
- All cycles
- 2024: D+7.0 2020: D+9.6 2016: D+8.2 2012: D+14.8 2008: D+16.6
Not yet ingested
- Civics
- —
Market trends
- HPI YoY
- ▼ -203.00%
- Current HPI
- 197.5988
- Rent YoY
- —
- Metro
- Akron, OH
- State GDP YoY
- ▲ 1.98%
- F500 in state
- 48
Industry mix (Fortune 500 HQ in OH)
| Industry | F500 HQs | Revenue |
|---|---|---|
| Insurance | 3 | $145B |
|
||
| Industrial Machinery | 3 | $49B |
|
||
| Financial Services | 3 | $24B |
|
||
| Consumer Goods | 2 | $93B |
|
||
| Aerospace / Defense | 2 | $47B |
|
||
| Utilities | 2 | $33B |
|
||
Price history
+1290.4% since first listed23 events — show timeline
- 2026-06-09 Price Changed $159,900 MLSNOW
- 2026-05-14 Listed $164,900 MLSNOW
- 2026-05-13 Listing Removed — MLSNOW
- 2026-04-28 Price Changed $164,900 MLSNOW
- 2026-04-09 Relisted — MLSNOW
- 2026-03-19 Contingent — MLSNOW
- 2026-03-04 Listed $169,900 MLSNOW
- 2025-11-05 Listing Removed — MLSNOW
- 2025-10-02 Listed $130,000 MLSNOW
- 2025-09-29 Sold (Public Records) $125,000 Public Records
- 2024-07-24 Sold (Public Records) $135,000 Public Records
- 2015-11-18 Listing Removed — MLSNOW
- 2015-10-08 Price Changed $29,900 MLSNOW
- 2015-08-18 Price Changed $34,000 MLSNOW
- 2015-06-26 Price Changed $38,000 MLSNOW
- 2015-05-27 Price Changed $44,000 MLSNOW
- 2015-04-13 Listed $49,000 MLSNOW
- 2008-12-23 Sold (MLS) $15,000 MLSNOW
- 2008-12-19 Listing Removed — MLSNOW
- 2008-09-22 Listed $18,000 MLSNOW
- 1994-12-08 Sold (Public Records) $17,000 Public Records
- 1989-12-15 Sold (Public Records) $17,000 Public Records
- 1985-10-17 Sold (Public Records) $11,500 Public Records
Property tax history
+10.7%/yrLatest (2025): $3,349 · +49.9% YoY. Source: county tax records.
Cash-flow waterfall
monthlySold comps — $/sqft
last 12 mo · ≤1 miLoading sold comps…