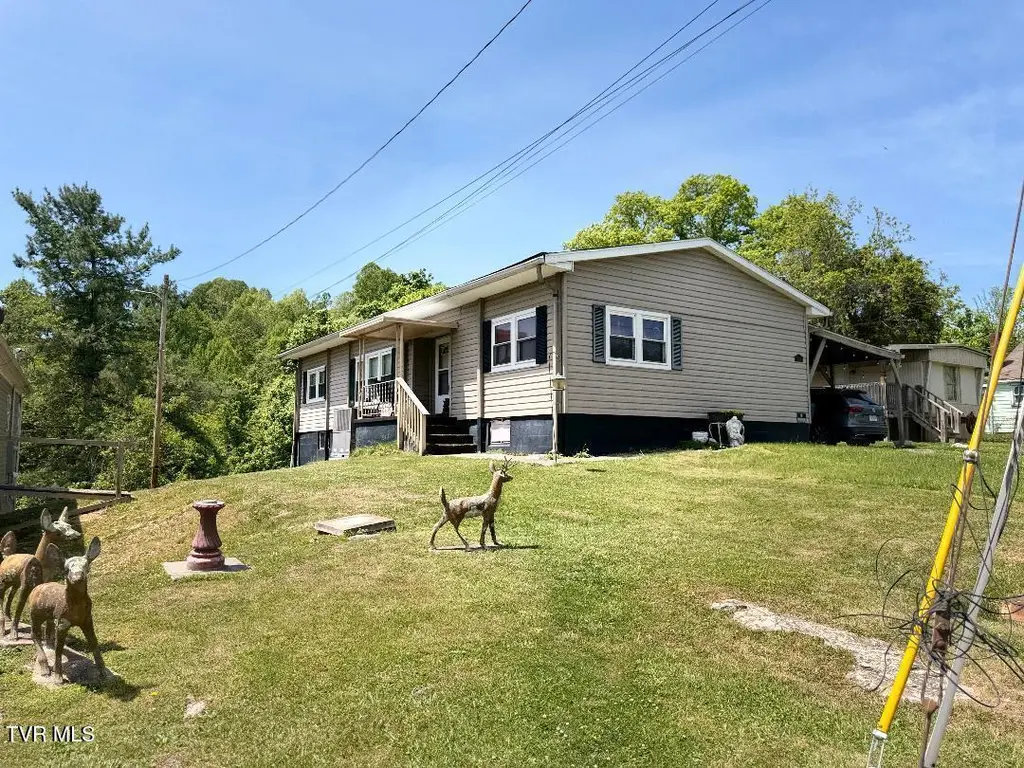
164 Elliott Dr · Gate City, VA
Flood risk 1/10 · Minimal
- FEMA flood zone
- X (unshaded)
- Chance of flooding over 30 yrs
- 0.0%
- Est. flood insurance / yr
- $473 – $860
Fire risk 3/10 · Minor
- Est. fire insurance / yr
- $666 – $1,236
Heat risk 4/10 · Minor
- Hot days now (above 100°F)
- 7 days/yr
- Hot days in 30 yrs
- 21 days/yr
Wind risk 2/10 · Minimal
- Chance of severe wind over 30 yrs
- —
Air-quality risk 1/10 · Minimal
- Unhealthy air days now
- 0 days/yr
- Unhealthy air days in 30 yrs
- 0 days/yr
Risk factors via First Street. Map © Google.
Why this score? — see what drove the A- grade
The composite is a weighted blend of 9 inputs, each scored 0–100. Each bar is that input's sub-score; the figure is the points it added to the 100-point composite (weight × sub-score).
- Cash flow +30.0/30.0
- ARV discount +15.0/15.0
- 1% rule +10.0/10.0
- DSCR +10.0/10.0
- Schools +5.8/10.0
- Appreciation +5.1/10.0
- Livability +3.1/5.0
- Rent growth +2.5/5.0
- Condition / age +2.5/5.0
$85,000
🖨 Deal sheet 📄 Offer letter ✓ Due diligence
Listing remarks
The home itself has undergone extensive renovations in the past couple of years, including: a new Carrier heat pump, new stove vent and fridge, new LVP flooring in the kitchen and dining room, new smoke detectors, new vents in the bathrooms, all new ductwork (which has been tested), new tilt-in double pane windows, a new radon detecting system, new insulation under the roof and pad insulation under the house, and the connections have been tightened and resealed. A stainless steel dishwasher is also included, but hasn't been installed. Buyer and or buyers agent to verify all information. Information is provided as a courtesy only.
Key facts
- 7,200 sq ft lot
- Parking
- Built 1974
Property features AI
Exterior
- Parking: Deeded carport (1 space); Gravel parking
- Security: Smoke detector(s)
- Utilities: Public water; Public sewer
- Home design: Manufactured house (double wide); One level; Updated/remodeled
- Construction: Vinyl siding; Block foundation; Shingle roof; Built as a manufactured (mobile) home
- Exterior features: Front porch; Side porch; Porch; Outbuilding; Shed(s); Cleared lot; Has view
Interior
- Kitchen: Cooktop; Double oven; Electric range; Refrigerator
- Bedrooms: 7 total rooms (includes bedrooms and living spaces)
- Flooring: Laminate
- Bathrooms: 2 full bathrooms
- Heating & cooling: Heat pump for heating and cooling
- Interior features: Eat-in kitchen; Laminate counters; Double pane windows; Smoke detectors
- Laundry & utility: Washer hookup; Electric dryer hookup
Neighborhood map
What this means for you Summary
Snapshot
- This is a 3-bed/1.0-bath manufactured listed at $85k.
Deal economics
- At list price, monthly cash flow is $539 ($6k/yr) — positive.
- The deal already cash-flows at list — no discount required.
- Meets the 1% rule at list price ($1k rent vs $85k).
- Recommended offer: $82k (3.0% below list) — sets the bar for market timing.
- Cap rate 13.9% vs local median 4.4% in Gate City — top-decile yield for the area; either an underpriced asset or a hidden risk that comps aren't pricing in. Stress-test before assuming the spread holds.
Location & tenants
- Location reads 62/100 on livability (#400 in VA) — a middle-class / working-renter tenant base. Strengths: cost of living A+, housing A+, crime B; Watch: amenities F, commute F, employment F.
- Scott County Public School District (rural): math 66% / reading 73% proficiency, ranked #33 of 131 in VA (top 25%) — acceptable for families but not a draw, mixed tenant base, ~2y average lease.
- Zoned schools: Shoemaker Elementary (math 64% / reading 72%, grade B+, #366 of 1,108 statewide, top 33%, 450 students, 81% FRL); Gate City Middle (math 74% / reading 71%, grade A, #61 of 342 statewide, top 18%, 333 students, 78% FRL); Gate City High (math 77% / reading 82%, grade A-, #63 of 319 statewide, top 22%, 619 students, 77% FRL) — zoned schools average 79% FRL vs 48% district-wide (31 pts higher); higher-poverty schools than district average — tighter screening recommended.
- Market conditions: 51 active listings in the ZIP; 22 units permitted in Scott County in 2024 (0 in 5+ unit buildings).
Forward outlook
- In year one you build about $779 of equity ($588 loan paydown + $191 appreciation (0.2% local appreciation)).
- Scott County population projected at -24% by 2050 — secular population decline; favor cash flow + early exit over multi-decade hold.
- At projected returns (0.2% appreciation + 3.0% rent growth), your $24k cash investment doubles in ~4 years — after that, you're playing with house money.
Negotiation context
- It's been on market 37 days — a 3% lower offer ($82k) is reasonable based on typical stale-listing flexibility.
- 3 sale attempts since 4y ago; this cycle's ask has dropped $15k (15%) from the opening price — seller is motivated, your offer sets the floor, not the list.
- Current owner paid $65k; 31% above their basis — modest negotiation headroom, anchor on the comps not their cost.
Questions for the listing agent
- It's been on market 37 days. Have you received any prior offers? Is the seller open to a 3% concession, seller financing, or rate buy-down credit?
- Built in 1974 — when were the roof, HVAC, electrical panel, plumbing, and water heater last replaced?
- Is there a deadline driving the sale (1031 exchange, divorce, estate, relocation)? That informs how much negotiation room exists.
- Schools are A-rated — typically a magnet for longer-tenancy family renters. What's the average tenant stay here, and is there a school-zone premium baked into asking?
- What's the average days-on-market for RENTAL listings here right now (not sales)? A rising rental-DOM trend means longer vacancies and softer asking-rent achievability than the comps imply.
- What's the recent tenant-quality profile in this submarket — average credit score on applications, eviction rate, late-payment / NSF rate, and stable-employment percentage? A property-management company in the area should have these aggregated.
- How much new for-sale + rental construction is in the pipeline within 1–3 miles? Heavy new supply typically softens prices + rents 12–24 months out; constrained supply supports both.
Investment metrics
- 1% rule
- 1.58% ✓
- Cap rate
- 13.91%
- Cash-on-cash
- 27.19%
- DSCR
- 2.21
- GRM
- 5.3
CMA / ARV
- ARV (median comp)
- $133,484
- List price
- $85,000
- Delta
- -36.32%
- Verdict
- UNDERPRICED
- Comps
- 20 within 1.0 mi
Projected returns pro-forma
0.22% appreciation · 3.0% rent growth · sell at horizon
- IRR
- 27.9%
- Equity multiple
- 2.38×
- Total profit
- $32,739
- Equity at exit
- $25,639
- IRR
- 31.4%
- Equity multiple
- 4.56×
- Total profit
- $84,828
- Equity at exit
- $31,593
Cash invested: $23,800 (down + closing). Projections, not guarantees.
Landlord ↔ Tenant lean methodology
- Overall (STATE)
- 55 Moderately Landlord-Leaning
- State Virginia
- 55 Moderately Landlord-Leaning · D+2
- County
- — inherits STATE
- City
- — inherits STATE
ZIP-level market 24251
- Home prices YoY
- 0.1%
- Active inventory
- 51
- Price-to-rent
- 5.3×
Monthly cashflow live
- Estimated rent
- $1,342 medium interval (Pro) →
- Mortgage (P&I)
- −$446
- Tax from tax record
- −$40 /mo · $474/yr
- Insurance
- −$35
- HOA
- −$0
- Vacancy / Maint / Mgmt
- −$282
- Net cashflow
- $539
Break-even live
UW: 25.0% down · 7.5% · 30yr · 1.5% tax · 5.0% vac · 8.0% maint · 8.0% mgmt
Financing live
Cash to close
- Down payment
- $21,250
- Closing costs
- $2,550
- Reserves months
- —
- Total cash needed
- —
Loan-product check · same deal, 3 products live
Conventional
25% down · 7.5% · 30yr
- Down + closing
- —
- Monthly P&I
- —
- Monthly cashflow
- —
- DSCR
- —
- Eligible?
- —
Personal DTI + credit; lowest rate.
DSCR
20% down · 8.5% · 30yr
- Down + closing
- —
- Monthly P&I
- —
- Monthly cashflow
- —
- DSCR
- —
- Eligible?
- —
No personal income docs; deal must DSCR.
Hard money
10% down · 12.0% · 12mo
- Down + closing
- —
- Monthly P&I
- —
- Monthly cashflow
- —
- DSCR
- —
- Eligible?
- —
Short-term bridge; refi at stabilization.
Listing history 13 events
-
2026-06-07statusdays on market $85,000 Pending 37 DOM
-
2026-06-03days on market $85,000 Active 36 DOM
-
2026-06-02days on market $85,000 Active 35 DOM
-
2026-06-01days on market $85,000 Active 34 DOM
-
2026-05-31days on market $85,000 Active 33 DOM
-
2026-05-18price $94,900 637-char remark
-
2026-05-11price $99,700 637-char remark
-
2026-04-28$99,900 Active 637-char remark
-
2023-12-04$90,000 Active
-
2023-11-30price $90,000
-
2022-10-06soldstatus $65,000
-
2022-10-06soldstatus $65,000
-
2022-09-23$64,900
ⓘ Source: listings_history table (triggers on properties + properties_extension) + one-shot
backfill from property_details.listing_events for pre-trigger history.
Tax reassessment forecast VA · Resets to sale price
- Current annual tax
- $474 · $40/mo
- Projected year-2 tax
- $697 · $58/mo
- Expected delta
- +$223/yr (+$19/mo · 46.9%)
ⓘ Screening estimate from a state-policy table — verify with the county assessor before closing.
Climate risk First Street
- Flood 1/10 Low FEMA zone X (unshaded) · 0% chance over 30 yrs
- Wildfire 3/10 Moderate
- Heat 4/10 Moderate 7 d/yr ≥100°F today · 21 d/yr by 30 yrs out
- Wind 2/10 Low
- Air quality 1/10 Low 0 unhealthy d/yr today · 0 by 30 yrs out
Nearby sold comps map
Loading sold comps map…
Walkable amenities ~0.75 mi
Loading nearby amenities…
Taxation est. · year 1
- Rental income
- $16,101
- − Mortgage interest
- −$4,761
- − Property taxes
- −$474
- − Insurance
- −$425
- − Repairs & maintenance
- −$1,288
- − Management
- −$1,288
- − Depreciation
- −$2,473
- Taxable income
- $5,391
- Est. tax owed @ 24.0%
- −$1,294
- After-tax cash flow
- $5,177/yr
For passive investors: Depreciation is non-cash, so a rental often shows a tax loss while cash-flowing — sheltering income. Rental losses are passive: they offset passive income freely, and up to $25,000/yr can offset ordinary (W-2) income if you actively participate and your MAGI is under $100k (phasing out to $0 by $150k); unused losses carry forward. On sale, claimed depreciation is recaptured at up to 25%, and gains may owe capital-gains tax (a 1031 exchange can defer both). Figures are a year-1 estimate at your 24.0% rate — not tax advice; consult a CPA.
Schools (NCES district)
- District
- Scott County Public School District
- NCES district ID
- 5103480
- Math proficiency
- 66% ▼ -26.00%
- Reading proficiency
- 73% ▼ -12.00%
- Median HH income
- $36,567
- Composite
- 57.65/100
- National rank
- #1061
- State rank
- #33 of 131 in VA
Livability — Gate City
- Score
- 62/100
- State rank
- #400
- US rank
- #16427
Category grades
Schools grade is shown separately in the Schools card above.
Census & demographics
- Census place
- Gate City, VA
- Population (ZIP)
- 7,976
Population outlook (Scott County) Hauer SSP2
- Today (2025)
- 20,405 people
- By 2030
- 19,379 · -5.0%
- By 2040
- 17,325 · -15.1%
- By 2050
- 15,464 · -24.2%
- By 2075
- 11,845 · -42.0%
- By 2100
- 8,516 · -58.3%
Race, ethnicity, and origin ACS 2023
- Neighborhood character
- Predominantly White (94%)
- Race & ethnicity
- White 94% Two or more races 3% Hispanic / Latino 3% Black 2%
- Common ancestry
- Serbian 4% Slovak 2% Italian 2%
- Foreign-born
- 1%
Political lean MEDSL · Scott
- 2024 margin
- Solid R (+70.4) · D 14.5% · R 84.9%
- 2008→2024 swing
- -27.3pp toward R · 2008: -43.1pp · 2024: -70.4pp
- All cycles
- 2024: R+70.4 2020: R+67.8 2016: R+66.3 2012: R+50.6 2008: R+43.1
Not yet ingested
- Civics
- —
Market trends
- HPI YoY
- ▲ 0.22%
- Current HPI
- 211.6519
- Rent YoY
- —
- Metro
- —
- State GDP YoY
- ▲ 2.40%
- F500 in state
- 50
Industry mix (Fortune 500 HQ in VA)
| Industry | F500 HQs | Revenue |
|---|---|---|
| Aerospace / Defense | 4 | $236B |
|
||
| Technology / Defense | 3 | $32B |
|
||
| Financial Services | 2 | $176B |
|
||
| Utilities | 2 | $27B |
|
||
| Insurance | 2 | $25B |
|
||
| Technology | 2 | $15B |
|
||
Price history
+31.0% since first listed10 events — show timeline
- 2026-06-05 Pending — TVRMLS
- 2026-05-29 Price Changed $85,000 TVRMLS
- 2026-05-18 Price Changed $94,900 TVRMLS
- 2026-05-11 Price Changed $99,700 TVRMLS
- 2026-04-28 Listed $99,900 TVRMLS
- 2023-12-04 Listed $90,000 SWVAR
- 2023-11-30 Price Changed $90,000 TVRMLS
- 2022-10-06 Sold (Public Records) $65,000 Public Records
- 2022-10-06 Sold (MLS) $65,000 TVRMLS
- 2022-09-23 Listed $64,900 TVRMLS
Property tax history
+3.1%/yrLatest (2025): $474 · +0.0% YoY. Source: county tax records.
Cash-flow waterfall
monthlySold comps — $/sqft
last 12 mo · ≤1 miLoading sold comps…