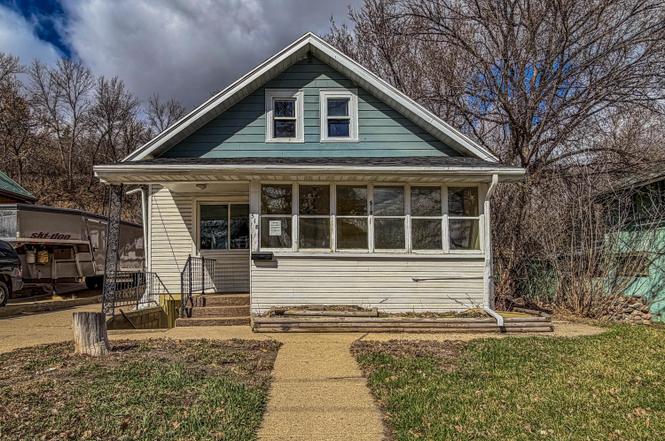
518 4th St SE · Minot, ND
Flood risk 1/10 · Minimal
- FEMA flood zone
- X
- Chance of flooding over 30 yrs
- 0.0%
- Est. flood insurance / yr
- $473 – $860
Fire risk 1/10 · Minimal
- Est. fire insurance / yr
- $1,289 – $2,393
Heat risk 2/10 · Minimal
- Hot days now (above 95°F)
- 7 days/yr
- Hot days in 30 yrs
- 12 days/yr
Wind risk 1/10 · Minimal
- Chance of severe wind over 30 yrs
- —
Air-quality risk 5/10 · Moderate
- Unhealthy air days now
- 7 days/yr
- Unhealthy air days in 30 yrs
- 7 days/yr
Risk factors via First Street. Map © Google.
Why this score? — see what drove the B grade
The composite is a weighted blend of 9 inputs, each scored 0–100. Each bar is that input's sub-score; the figure is the points it added to the 100-point composite (weight × sub-score).
- Cash flow +30.0/30.0
- 1% rule +10.0/10.0
- DSCR +10.0/10.0
- ARV discount +7.5/15.0
- Rent growth +3.8/5.0
- Schools +3.8/10.0
- Livability +3.8/5.0
- Condition / age +2.5/5.0
- Appreciation +0.0/10.0
$59,900
🖨 Deal sheet (PDF) 📄 Offer letter ✓ Due diligence
Listing remarks MLS
STEAL OF A DEAL!!! This 1.5 story home has 1664 Sq feet above grade with with tons of opportunity!! This large home features 5 bedrooms plus 2 bonus rooms non- egress. The lower level has a separate living area with its own entrance complete with a kitchen. The main floor features a master bedroom and laundry off the kitchen. There is also a separate entrance for the upstairs so there is a possibility of 3 separate living areas. There is new carpet on the main and second floors. Many living opportunities such as a mother in law-suite or grown children with their own family but separate living quarters and help make the house payment!! Take a look for yourself!
Key facts
- Close to hospitals
- Close to downtown
- 7,492 sq ft lot
Tags
Property features AI
Exterior
- Parking: Detached concrete garage with 2 car spaces
- Utilities: Public water; Public sewer; Electricity connected; Water connected
- Home design: Single-family residence; Three or more levels
- Construction: Metal/steel siding; Shingle roof; Concrete perimeter foundation; Built on multiple levels (see levels)
- Exterior features: Enclosed porch; Porch
Interior
- Bathrooms: One full bathroom; One three-quarter bathroom
- Heating & cooling: No central cooling; No listed heating (see remarks)
- Interior features: Seven total rooms; Basement with full, unfinished area, walk-out access and bath stubbed
Neighborhood map
What this means for you Summary
Snapshot
- This is a 5-bed/3.5-bath single-family listed at $60k.
Deal economics
- At list price, monthly cash flow is $787 ($9k/yr) — positive.
- The deal already cash-flows at list — no discount required.
- Meets the 1% rule at list price ($1k rent vs $60k).
- Cap rate 22.1% vs local median 2.4% in Minot — top-decile yield for the area; either an underpriced asset or a hidden risk that comps aren't pricing in. Stress-test before assuming the spread holds.
Location & tenants
- Location reads 75/100 on livability (#21 in ND, #3,953 nationally) — a middle-class / working-renter tenant base. Strengths: cost of living A+, housing A+, health & safety A+; Watch: amenities F, commute F.
- Minot 1 (town): math 41% / reading 46% proficiency, ranked #24 of 53 in ND (top 45%) — families likely to look elsewhere, expect single-tenant / working-renter base with shorter leases.
- Market conditions: Rents rising fast (+5.0%/yr); 174 active listings in the ZIP; 123 units permitted in Ward County in 2024 (0 in 5+ unit buildings).
Forward outlook
- Local home prices are declining (-3.0%/yr); year-one equity from $414 of loan paydown is wiped out by about $2k of value loss. Plan a longer hold.
- Ward County population projected at +76% by 2050 — long-run rental-demand tailwind backs the buy-and-hold thesis.
- At projected returns (-3.0% appreciation + 5.0% rent growth), your $17k cash investment doubles in ~2 years — after that, you're playing with house money.
Negotiation context
- Only 5 days on market — expect competitive offers; lowballing is unlikely to land.
- 3 sale attempts since 8y ago with the ask held roughly flat each time — persistent listings suggest the price (not the market) is what's stuck; bring a comps-based counter.
Risks & watch-outs
- Watch-outs: built in 1919 — expect roof / HVAC / electrical / plumbing capex.
Questions for the listing agent
- Built in 1919 — when were the roof, HVAC, electrical panel, plumbing, and water heater last replaced?
- Is there a deadline driving the sale (1031 exchange, divorce, estate, relocation)? That informs how much negotiation room exists.
- What's the average days-on-market for RENTAL listings here right now (not sales)? A rising rental-DOM trend means longer vacancies and softer asking-rent achievability than the comps imply.
- What's the recent tenant-quality profile in this submarket — average credit score on applications, eviction rate, late-payment / NSF rate, and stable-employment percentage? A property-management company in the area should have these aggregated.
- How much new for-sale + rental construction is in the pipeline within 1–3 miles? Heavy new supply typically softens prices + rents 12–24 months out; constrained supply supports both.
Investment metrics
- 1% rule
- 2.46% ✓
- Cap rate
- 22.07%
- Cash-on-cash
- 56.33%
- DSCR
- 3.51
- GRM
- 3.4
CMA / ARV
- ARV (on-the-fly)
- $304,056
- Comps found
- 12
Show comp detail 12 sales within ~0.75 mi
| Address | Dist | Beds/Ba | Sqft | Sold | Price | $/sf | Match |
|---|---|---|---|---|---|---|---|
| 519 4th St | 0.03mi | 5/5.0 | 3,172 (+8%) | 4mo | $439,000 | $138 | 77 |
| 316 5th Ave SE | 0.03mi | 4/2.0 (-1) | 3,124 (+6%) | 4mo | $386,000 | $124 | 74 |
| 203 7th Ave SE | 0.12mi | 4/3.0 (-1) | 3,179 (+8%) | 8mo | $327,000 | $103 | 68 |
| 624 Main St S | 0.25mi | 5/3.5 | 3,136 (+6%) | 13mo | $255,000 | $81 | 67 |
| 229 10th Ave Ave SE | 0.29mi | 4/2.5 (-1) | 2,925 (-1%) | 18mo | $295,000 | $101 | 61 |
| 621 Main St S | 0.22mi | 4/2.0 (-1) | 3,114 (+6%) | 22mo | $285,000 | $92 | 52 |
| 424 1st St NE | 0.71mi | 6/4.0 (+1) | 2,856 (-3%) | 4mo | $335,000 | $117 | 51 |
| 106 8th St SE | 0.41mi | 5/2.0 | 2,634 (-11%) | 8mo | $293,000 | $111 | 50 |
| 1419 2nd St SE | 0.69mi | 4/3.0 (-1) | 2,954 (+0%) | 15mo | $284,250 | $96 | 48 |
| 315 9th Ave Ave SW | 0.55mi | 4/3.0 (-1) | 2,832 (-4%) | 14mo | $250,000 | $88 | 48 |
| 1105 Hiawatha St | 0.55mi | 4/2.5 (-1) | 3,032 (+3%) | 20mo | $512,000 | $169 | 44 |
| 1431 1st St SE | 0.74mi | 5/3.0 | 2,541 (-14%) | 20mo | $235,000 | $92 | 24 |
Match score weights: distance 35% · size 25% · config 20% · recency 20%. Top-matched comps best support the ARV.
Projected returns pro-forma
-3.0% appreciation · 5.05% rent growth · sell at horizon
- IRR
- 57.0%
- Equity multiple
- 3.60×
- Total profit
- $43,549
- Equity at exit
- $8,931
- IRR
- 62.6%
- Equity multiple
- 7.90×
- Total profit
- $115,795
- Equity at exit
- $5,179
Cash invested: $16,772 (down + closing). Projections, not guarantees.
Landlord ↔ Tenant lean methodology
- Overall (STATE)
- 82 Strongly Landlord-Friendly
- State North Dakota
- 82 Strongly Landlord-Friendly · R+20
- County
- — inherits STATE
- City
- — inherits STATE
ZIP-level market 58701
- Rents YoY
- 5.0%
- Active inventory
- 174
- Price-to-rent
- 3.4×
Monthly cashflow live
- Estimated rent
- $1,476 medium interval (Pro) →
- Mortgage (P&I)
- −$314
- Tax from tax record
- −$40 /mo · $480/yr
- Insurance
- −$25
- HOA
- −$0
- Vacancy / Maint / Mgmt
- −$310
- Net cashflow
- $787
Break-even live
Sensitivity live
| Price | -10% $821 | -5% $804 | +0% $787 | +5% $770 | +10% $753 |
|---|---|---|---|---|---|
| Rent | -10% $671 | -5% $729 | +0% $787 | +5% $846 | +10% $904 |
| Rate | -1.0pp $818 | -0.5pp $803 | base $787 | +0.5pp $772 | +1.0pp $756 |
UW: 25.0% down · 7.5% · 30yr · 1.5% tax · 5.0% vac · 8.0% maint · 8.0% mgmt
Financing live
Cash to close
- Down payment
- $14,975
- Closing costs
- $1,797
- Reserves months
- —
- Total cash needed
- —
Loan-product check · same deal, 3 products live
Conventional
25% down · 7.5% · 30yr
- Down + closing
- —
- Monthly P&I
- —
- Monthly cashflow
- —
- DSCR
- —
- Eligible?
- —
Personal DTI + credit; lowest rate.
DSCR
20% down · 8.5% · 30yr
- Down + closing
- —
- Monthly P&I
- —
- Monthly cashflow
- —
- DSCR
- —
- Eligible?
- —
No personal income docs; deal must DSCR.
Hard money
10% down · 12.0% · 12mo
- Down + closing
- —
- Monthly P&I
- —
- Monthly cashflow
- —
- DSCR
- —
- Eligible?
- —
Short-term bridge; refi at stabilization.
Listing history 5 events
-
2026-06-19days on market $59,900 Active 5 DOM
-
2026-06-18days on market $59,900 Active 4 DOM
-
2026-06-17days on market $59,900 Active 3 DOM
-
2026-06-16days on market $59,900 Active 2 DOM
-
2026-06-15$59,900 Active 1 DOM
ⓘ Source: listings_history table (triggers on properties + properties_extension) + one-shot
backfill from property_details.listing_events for pre-trigger history.
Tax reassessment forecast ND · Resets to sale price
- Current annual tax
- $480 · $40/mo
- Projected year-2 tax
- $587 · $49/mo
- Expected delta
- +$107/yr (+$9/mo · 22.4%)
ⓘ Screening estimate from a state-policy table — verify with the county assessor before closing.
Climate risk First Street
- Flood 1/10 Low FEMA zone X · 0% chance over 30 yrs
- Wildfire 1/10 Low
- Heat 2/10 Low 7 d/yr ≥95°F today · 12 d/yr by 30 yrs out
- Wind 1/10 Low
- Air quality 5/10 Major 7 unhealthy d/yr today · 7 by 30 yrs out
Nearby sold comps map
Loading sold comps map…
Walkable amenities ~0.75 mi
Loading nearby amenities…
Taxation est. · year 1
- Rental income
- $17,718
- − Mortgage interest
- −$3,355
- − Property taxes
- −$480
- − Insurance
- −$300
- − Repairs & maintenance
- −$1,417
- − Management
- −$1,417
- − Depreciation
- −$1,743
- Taxable income
- $9,006
- Est. tax owed @ 24.0%
- −$2,161
- After-tax cash flow
- $7,287/yr
For passive investors: Depreciation is non-cash, so a rental often shows a tax loss while cash-flowing — sheltering income. Rental losses are passive: they offset passive income freely, and up to $25,000/yr can offset ordinary (W-2) income if you actively participate and your MAGI is under $100k (phasing out to $0 by $150k); unused losses carry forward. On sale, claimed depreciation is recaptured at up to 25%, and gains may owe capital-gains tax (a 1031 exchange can defer both). Figures are a year-1 estimate at your 24.0% rate — not tax advice; consult a CPA.
Schools (NCES district)
- District
- Minot 1
- NCES district ID
- 3813030
- Math proficiency
- 41% ▼ -4.00%
- Reading proficiency
- 46% ▼ -1.00%
- Median HH income
- $54,224
- Composite
- 37.79/100
- National rank
- #4341
- State rank
- #24 of 53 in ND
Livability — Minot
- Score
- 75/100
- State rank
- #21
- US rank
- #3953
Category grades
Schools grade is shown separately in the Schools card above.
Census & demographics
- Census place
- Minot, ND
- County
- Ward County · 55,225 people
- City population
- 55,225
- Metro
- Minot, ND
- Population (ZIP)
- 33,086
- Household income
- $73,269
- Rent vs Own
- Severe rent burden
- 1146.0
Population outlook (Ward County) Hauer SSP2
- Today (2025)
- 92,683 people
- By 2030
- 104,825 · +13.1%
- By 2040
- 131,945 · +42.4%
- By 2050
- 163,134 · +76.0%
- By 2075
- 256,561 · +176.8%
- By 2100
- 354,426 · +282.4%
Race, ethnicity, and origin ACS 2023
- Neighborhood character
- Predominantly White (83%)
- Race & ethnicity
- White 83% Two or more races 8% Hispanic / Latino 5% Black 3% Native American 2% Asian 2%
- Common ancestry
- Portuguese 27% Scotch-Irish 3% Lithuanian 2%
- Foreign-born
- 5% · Canada
- Languages at home
- 94% English-only · Spanish 2% Other Asian/Pacific 1% Tagalog/Filipino 1%
Political lean MEDSL · Ward
- 2024 margin
- Solid R (+47.4) · D 25.5% · R 72.8% · Other 1.7%
- 2008→2024 swing
- -28.2pp toward R · 2008: -19.2pp · 2024: -47.4pp
- All cycles
- 2024: R+47.4 2020: R+44.9 2016: R+47.7 2012: R+30.8 2008: R+19.2
Not yet ingested
- Civics
- —
Market trends
- HPI YoY
- ▼ -227.47%
- Current HPI
- 144.9492
- Rent YoY
- ▲ 5.05%
- Metro
- Minot, ND
- State GDP YoY
- ▲ 2.09%
- F500 in state
- 2
Industry mix (Fortune 500 HQ in ND)
| Industry | F500 HQs | Revenue |
|---|---|---|
| Utilities / Construction | 1 | $6B |
|
||
Price history
-0.2% since first listed9 events — show timeline
- 2026-06-14 Listed $59,900 GNMLS
- 2024-12-18 Price Changed $122,000 MMLS
- 2024-11-25 Listed $129,900 MMLS
- 2019-06-10 Sold (Public Records) $124,900 Public Records
- 2019-06-06 Sold (MLS) — MMLS
- 2018-04-30 Listed $124,900 MMLS
- 2016-10-10 Sold (Public Records) — Public Records
- 2008-10-17 Sold (Public Records) $60,000 Public Records
- 2006-10-27 Sold (Public Records) — Public Records
Property tax history
-11.4%/yrLatest (2025): $480 · -70.0% YoY. Source: county tax records.
Cash-flow waterfall
monthlySold comps — $/sqft
last 12 mo · ≤1 miLoading sold comps…